Lesson 1
| Site: | MoodleHUB.ca 🍁 |
| Course: | Math 20-1 SS |
| Book: | Lesson 1 |
| Printed by: | Guest user |
| Date: | Thursday, 4 December 2025, 2:08 AM |
Description
Created by IMSreader
1. Lesson 1
Module 4: Quadratic Equations and Inequalities
Lesson 1: Solving Quadratic Equations by Graphing
Focus

© Photos courtesy of the Katz Group
Major projects, such as the development of a city’s downtown business sector or the construction of a shopping district, cannot begin without plans and blueprints. In fact, large-scale projects such as these often start with an artist’s drawing of how the completed project would look. A drawing brings clarity to something that may otherwise be difficult to imagine.
In this lesson you will you will use the graphs of quadratic functions to “visually” determine the solutions to quadratic equations.
Outcomes
At the end of this lesson, you will be able to
- explain, using examples, the relationship among the roots of a quadratic equation, the zeros of the corresponding quadratic function, and the x-intercepts of the graph of the quadratic function
- solve a quadratic equation of the form ax2 + bx + c = 0 by graphing its corresponding function
Lesson Questions
You will investigate the following questions:
- How are the roots of quadratic equations related to the graphs of their corresponding quadratic functions?
- In what ways can you solve a quadratic equation by graphing?
Assessment
Your assessment may be based on a combination of the following tasks:
- completion of the Lesson 1 Assignment (Download the Lesson 1 Assignment and save it in your course folder now.)
- course folder submissions from Try This and Share activities
- additions to Module 4 Glossary Terms and Formula Sheet
- work under Project Connection
Self-Check activities are for your own use. You can compare your answers to suggested answers to see if you are on track. If you are having difficulty with concepts or calculations, contact your teacher.
Materials and Equipment
You will need a graphing calculator.
1.1. Launch
Module 4: Quadratic Equations and Inequalities
Launch
Do you have the background knowledge and skills you need to complete this lesson successfully? This section, which includes Are You Ready? and Refresher, will help you find out.
Before beginning this lesson you should be able to
- graph functions
- identify properties of a parabola
- substitute given values and solve for a variable in a quadratic equation
- solve systems of linear equations by graphing
1.2. Are You Ready?
Module 4: Quadratic Equations and Inequalities
Are You Ready?
Complete these questions. If you experience difficulty and need help, visit Refresher or contact your teacher.
-
Consider the graph of the quadratic function. Identify the following properties of the parabola:
- vertex
- equation of the axis of symmetry
- maximum or minimum value
- x-intercept(s)
- y-intercept
- domain
- range
Answer
- Graph the linear function

- on graph paper
 Answer
- using a graphing application
Answer
- on graph paper
-
The equation of a quadratic function is y = 3x2 + 5x − 2. Determine the value of y when
- What is a system of equations? How do you find the solution to a system of equations by graphing? Answer
- Solve the following system of equations by graphing.
1.3. Refresher
Module 4: Quadratic Equations and Inequalities
Refresher

Screenshot reprinted with permission of ExploreLearning.
Review graphing quadratic functions in “Quadratic Functions.”

Review the properties of parabolas in Graphs of Quadratic Functions.

Use Solving Linear Systems by Graphing to review graphing systems of linear equations.

Linear Systems Graph helps you graph two linear systems to find the solution.

Solving Systems of Linear Equations Using the TI-83 can help you review how to use your graphing calculator.
Go back to the Are You Ready? section, and try the questions again. If you are still having difficulty, contact your teacher.
1.4. Discover
Module 4: Quadratic Equations and Inequalities
Discover
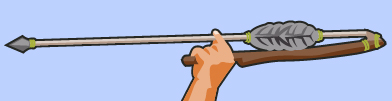
The atlatl (pronounced at-‘lat-al) is a device that was used by the Hopi Indians to hunt game, including rabbits and deer. The atlatl is a leveraging device that increases the acceleration of a spear or dart as it is launched. This launching mechanism increases the effectiveness of the weapon.
The design principles of the atlatl can be found in modern tools. One such tool is a ball-thrower, which is used to throw a tennis ball for a dog to chase. Such devices enable the user to throw a ball farther than when the ball is simply thrown with the arm only.
Try This 1

Students from a high school class are studying the history and mechanics of the atlatl. They spend a few classes constructing atlatls, and then they use the devices in a spear-throwing competition. Atlatl Graph shows the height of a spear over time after being thrown from an atlatl. Answer the following questions based on this graph.
- From what height was the spear released?
-
- What is the maximum height that the spear reaches?
- How long did it take for the spear to reach the maximum height?
- What is the maximum height that the spear reaches?
- How long was the spear in the air? Where do you look on the graph to answer this question, and why do you look there?
- The equation of the function represented by the path of the spear is h(t) = −1.42t2 + 3.75t + 1.53, where h(t) is the height of the spear in metres and t is the time in seconds.
- What similarity in numbers is there between this equation and your answers to questions 1 to 3?
- Graph this function on your calculator. Select an appropriate window setting to view the graph.
- What similarity in numbers is there between this equation and your answers to questions 1 to 3?
![]() Save your responses in your course folder.
Save your responses in your course folder.
1.5. Discover 2
Module 4: Quadratic Equations and Inequalities
Share 1
With a classmate, compare your responses to Try This 1. Discuss and resolve any differences in your answers. Then work together on the following questions.
- Compare the function h(t) = −1.42t2 + 3.75t + 1.53 to the equation 0 = −1.42t2 + 3.75t + 1.53. How could you use the graph of h(t) = −1.42t2 + 3.75t + 1.53 to determine the solution(s) to the equation?

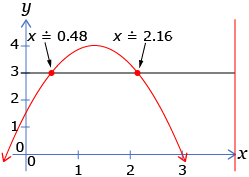
- Consider the equation 3 = −1.42t2 + 3.75t + 1.53. What would be the meaning of this equation in the context of the problem? How could you use the graph to find the solutions to this problem?
![]() Save your work in your course folder. You will revisit these ideas later in the lesson.
Save your work in your course folder. You will revisit these ideas later in the lesson.
1.6. Explore
Module 4: Quadratic Equations and Inequalities
Explore

© Photo courtesy of the Katz Group
This is a photo collage of an artist’s conception of two additional views of a proposed arena district in Edmonton, Alberta.
Many factors determine the design of a business district. Some of these factors deal with function and form. If a building’s purpose is for the sale of warehouse items, the building must be designed with enough room for large amounts of merchandise and customers. In the case of a warehouse supercentre, the space requirement is far greater than that of a specialty-item store, for example.
Other factors that influence the design of a new development include
- cost
- potential returns on investment
- maintenance and upkeep
These factors are addressed in a feasibility study at the onset of the project, before any construction begins. This allows investors and other stakeholders to see the big picture before committing to the project.
In Module 3 you studied the properties of quadratic functions and their graphs. The graph of a parabola, like a big picture, can tell you much about the quadratic function the graph represents. The graph of a parabola can also help you solve a quadratic equation.
![]() Save Module 4 Glossary Terms in your course folder now.
Save Module 4 Glossary Terms in your course folder now.
Here are some of the words you will want to define in your copy of Module 4 Glossary Terms in this lesson:
- quadratic equation
- roots of an equation
- zeros of a function
1.7. Explore 2
Module 4: Quadratic Equations and Inequalities
Determining the Roots of a Quadratic Equation
In Module 3 you learned about quadratic functions. You learned that a quadratic function is a second-degree expression that can be written in the form y = ax2 + bx + c. A quadratic equation has the same form as a quadratic function and can be expressed as ax2 + bx + c = 0, where a ≠ 0 and a, b, and c are real numbers.
Why is it a condition of quadratic functions and equations that a ≠ 0? ![]()
To solve a quadratic equation means to determine the value(s) of the unknown variable that would make the equation true. The solution(s) of a quadratic equation are known as the roots of the equation.
You can determine the roots of a quadratic equation by analyzing the graph of the corresponding quadratic function. See how you can do this by completing Try This 2.
Try This 2
- Consider the quadratic equation x2 − 6x = 0. Use any strategy to find two different values of x that would satisfy the equation. Verify your solutions by substituting the values into the equation and checking that the left-hand side equals 0.
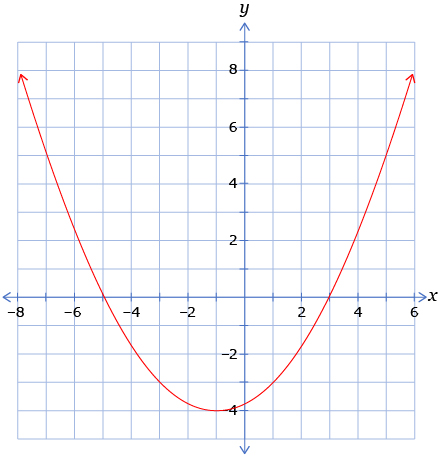
- The graph shows the graph of the quadratic function y = x2 − 6x. Study the properties of the graph. See if you can spot the solutions you identified in question 1 on the graph.
![]() Save your responses in your course folder.
Save your responses in your course folder.
Share 2
With a partner, respond to the following questions:
- What is the relationship between the roots of the quadratic equation and the x-intercepts of the corresponding quadratic function?
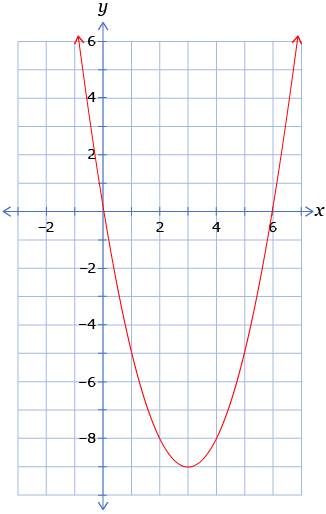
- Check your hypothesis by graphing and solving the quadratic equation x2 + 2x − 15 = 0.
- The x-intercepts of a graph are also known as the zeros of the graph. Give a possible explanation as to why x-intercepts of a graph are called zeros.
![]() Save your responses in your course folder.
Save your responses in your course folder.
Self-Check 1
Work through Distinguishing Between Roots, x-intercepts, and Zeros. You will need to select Solving Quadratic Equations: Using Graphs and then the blue Tutorial button at the top of the window. Finally, select Distinguishing Between Roots, x-intercepts, and Zeros. After working through the applet, make any necessary revisions to your responses to Try This 2 and Share 2.
See what happens when a = 0 is substituted into the quadratic function:
Can you see how this is now a linear equation in the form of y = mx + b? In order to have a quadratic function, the a-value of the coefficient of the x2-term must not be equal to 0.
1.8. Explore 3
Module 4: Quadratic Equations and Inequalities
Graphing Quadratic Functions
You have discovered that the roots of a quadratic equation can be found by determining the x-intercepts of the graph of the corresponding quadratic function. The x-intercepts are also known as the zeros of the quadratic function.
There are many ways of graphing a quadratic function. You can graph by hand with paper and pencil, or you can graph electronically using a graphing calculator, spreadsheet, or other graphing application.
Turn to “Example 1” on pages 208 to 209 of the textbook to see three different ways of graphing a quadratic function. As you work through the example, try to answer the following questions:
- How can you tell how many roots there are by looking at the graph?
- Which graphing method do you prefer?
Self-Check 2

Complete Do You Know Your Quadratic Equations?
Number of Roots and Number of x-Intercepts
If the roots of a quadratic equation are equal to the values of the x-intercepts on its graph, it is reasonable to state that the number of roots is equal to the number of x-intercepts.

Try This 3
- How many x-intercepts can a quadratic function have? Use Quadratic Functions to answer this question.
Screenshot reprinted with permission of ExploreLearning.
-
What is the minimum number of roots that a quadratic equation could have? What is the maximum number of roots?
-
Using Quadratic Functions from question 1, choose one quadratic equation for each of the different number of roots.
-
Number your equations from question 3 and copy the equations into a document. Save your document as Questions_Your Name in your course folder. Record the roots of the equations in a separate document called Answers_Your Name.
![]() Save your work in your course folder.
Save your work in your course folder.
Share 3
With a classmate, exchange your question documents from Try This 3 question 4. Use any graphing strategy to find the roots of each of the equations.
After you and your partner have completed each other’s question documents, exchange the documents again. Mark the questions using your answer document from Try This 3 question 4.
Discuss the following points:
- Did you and your partner have the same number of questions? Remember that you were asked to construct one question for each unique number of roots.
- What are the benefits and drawbacks of graphing by hand?
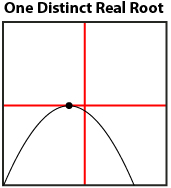
- For any quadratic equation with only one real root, what will its graph look like? What part of the graph intersects the x-axis?
1.9. Explore 4
Module 4: Quadratic Equations and Inequalities
Two Methods for Solving Quadratic Equations
Retrieve your work from Try This 1 and Share 1. You investigated a quadratic equation representing the height of a spear over time. Revisit your answer from Share 2 question 2. You were asked to solve the quadratic equation 3 = −1.42t2 + 3.75t + 1.53. You can solve this equation in a number of ways. Two possible methods are described here.
Method 1: The Zero Method
You can solve this equation by rearranging the equation so that all of the terms are on one side.
The solution to this rearranged equation is seen when the function on the right side is equal to zero.
Graphically, the roots of the equation are the zeros of the quadratic function. You can find the zeros using any of the graphing methods previously encountered.
Method 2: Graphing a Related System of Equations
There is another way to solve this problem graphically. Watch Solving a Quadratic Equation by Graphing a Related System of Equations to see Method 2.
Self-Check 3

Take a moment to check your understanding of the concepts presented so far. Complete Solving Quadratic Equations Self-Check. The questions are not for marks; instead, they are provided for you to assess your own learning. Have some scrap paper handy to do rough work. You may wish to save your rough work in your course folder for future reference. If you make a mistake, don’t worry! You can reset the question and then try again!
1.10. Explore 5
Module 4: Quadratic Equations and Inequalities
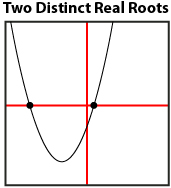
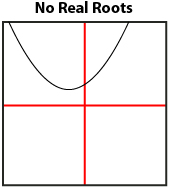
You have learned that a quadratic equation can have one root if the vertex of the corresponding graph touches the x-axis; two roots if the graph crosses the x-axis in two distinct points; and no roots if the graph does not cross the x-axis at all.
For the rest of this lesson you will use graphing to solve quadratic equations in different contexts.
Example: Determining the Dimensions of a Building Footprint

Hemera/Thinkstock
The footprint of a building describes the shape and size of its ground floor. The area of the rectangular footprint of a particular building is 546 m2. The length of the footprint is 5 m more than its width. Determine the dimensions of the footprint. You may want to try to answer this problem before looking at the solution.

When you are ready for the solution, watch Building Footprint Sample Solution.
Try This 4
Turn to “Example 4” on page 213 of the textbook to see an example of how a quadratic equation can be used to solve a problem dealing with a suspension bridge. In this problem the solution is not represented by the zeros of a quadratic function. However, determining the zeros is part of the solution process. As you work through the problem, respond to the following questions:
- How are the variables in the quadratic equation similar to and different from those of the quadratic equation found in Try This 1, which was related to atlatls?
- What does the x-axis represent in this problem?
- What must you do with the zeros of the function in order to solve the problem? Why?
![]() Save your work in your course folder.
Save your work in your course folder.
Self-Check 4
Complete questions 5, 7, and 12 on pages 215 to 217 in the textbook. Show your work to support your answers. Answer
1.11. Connect
Module 4: Quadratic Equations and Inequalities

In the Lesson 1 Assignment you will demonstrate your understanding of the lesson outcomes. You will apply the concepts and strategies you learned to new situations. You must show your work to support your answers.
Open your copy of the Lesson 1 Assignment, which you saved in your course folder at the start of this lesson. Complete the assignment.
![]() Save your work in your course folder.
Save your work in your course folder.
Project Connection
You are ready to begin Module 4 Project: Imagineering. Open Module 4 Project. Read the following sections to become familiar with what you will be doing and how you will be assessed:
- Project Introduction
- Project Assessment

Still in Module 4 Project: Imagineering, begin Blue Sky. You will complete Blue Sky in Lesson 3.
![]() Save your work in your course folder.
Save your work in your course folder.
Going Beyond
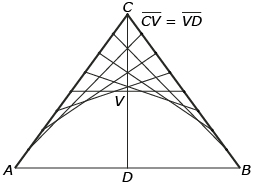
Isn’t it frustrating when you need to draw a parabola but you don’t have your computer or graphing calculator with you? The following instructions show one of many ways to construct a parabola. The diagram will help you understand the steps given.
Step 1: Determine the span and height of the parabola.
Step 2: Construct a horizontal line segment equal to the span. Label the endpoints A and B.
Step 3: Construct the midpoint of ![]() . Label this D.
. Label this D.
Step 4: Construct a vertical line segment with endpoints V and D (the midpoint of![]() ) equal to the height of the parabola.
) equal to the height of the parabola.
Step 5: Extend line segment ![]() to C, where
to C, where ![]() is equal in length to
is equal in length to ![]() .
.
Step 6: Use a ruler to divide ![]() and
and ![]() into equal segments. (The more equal segments you have, the more accurate the parabola.)
into equal segments. (The more equal segments you have, the more accurate the parabola.)
Step 7: Connect the points, as shown in the diagram, to create tangents to the parabola.
Step 8: Use freehand to draw the parabola that is revealed amongst all of the tangent lines.
What other methods are there of drawing a parabola?
Another method requires the use of some common items you may find around the house, such as string and a measuring square. Search the Internet using the keywords “how to draw a parabola” to find other ways of constructing a parabola.
Copy any instructions for drawing parabolas that you find especially interesting. Follow the instructions and save your drawings in your course folder.
1.12. Lesson 1 Summary
Module 4: Quadratic Equations and Inequalities
Lesson 1 Summary

In this lesson you investigated the following questions:
- How are the roots of quadratic equations related to the graphs of their corresponding quadratic functions?
- In what ways can you solve a quadratic equation by graphing?
You discovered that the roots of a quadratic equation are precisely the zeros of the corresponding quadratic function, which are, in turn, the x-intercepts of the graph. Therefore, you can solve a quadratic equation by finding the x-intercepts of the related quadratic function. You learned that any given quadratic equation can have one, two, or no roots depending on the number of x-intercepts.
There are many ways of graphing a quadratic function. Besides constructing a graph by hand, you can graph electronically using spreadsheets, graphing calculators, or applets.
As an alternative to using the zero feature of a calculator to find the x-intercepts of a quadratic function’s graph, you can graph a related system of equations and determine the roots by finding the points of intersection.
The graphing methods you learned for solving quadratic equations can be used to solve any equation. It is still important that you know how to solve quadratic equations algebraically. Solving equations algebraically gives you a deeper understanding of the nature of these equations. This is the subject of the next several lessons.