Lesson 5
| Site: | MoodleHUB.ca 🍁 |
| Course: | Math 20-1 SS |
| Book: | Lesson 5 |
| Printed by: | Guest user |
| Date: | Thursday, 4 December 2025, 2:08 AM |
Description
Created by IMSreader
1. Lesson 5
Module 4: Quadratic Equations and Inequalities
Lesson 5: Solving Quadratic Systems Graphically
Focus

Courtesy City of Edmonton/Dialog. Reproduced with permission.
The illustration to the right shows what the Walterdale Bridge, which spans the North Saskatchewan River in Edmonton, might look like when the existing bridge is replaced. Notice that the arches resemble parabolas and that the supports resemble lines. Do the arches intersect? Where do the supports and arches intersect?
Previously in this module you used the graphs of quadratic functions to solve quadratic equations. In this lesson you will study systems of linear-quadratic and quadratic-quadratic equations. Just as you did with the illustration, you will focus on where lines and parabolas intersect. You will also discover the use of multiple parabolas in the design of buildings and other structures.
Outcomes
At the end of this lesson you will be able to
- explain the meaning of the points of intersection of a system of linear-quadratic or quadratic-quadratic equations
- explain, using examples, why a system of linear-quadratic or quadratic-quadratic equations may have zero, one, two, or an infinite number of solutions
- determine and verify the solution of a system of linear-quadratic or quadratic-quadratic equations graphically, with technology
- relate a system of linear-quadratic or quadratic-quadratic equations to the context of a given problem
- model a situation using a system of linear-quadratic or quadratic-quadratic equations
Lesson Questions
You will investigate the following questions:
- Why are the points of intersection of a system of equations related to its solution?
- How does a graphical representation facilitate mathematical understanding?
Assessment
Your assessment may be based on a combination of the following tasks:
- completion of the Lesson 5 Assignment (Download the Lesson 5 Assignment and save it in your course folder now.)
- course folder submissions from Try This and Share activities
- additions to Module 4 Glossary Terms and Formula Sheet
- work under Project Connection
Materials and Equipment
You will need the following to complete the optional Math Lab in the Going Beyond section:
- two small objects of similar size and weight (e.g., tennis balls, toy cars, whiteboard brushes)
- a flat elevated surface that is at least 1 m in length (e.g., table top, whiteboard ledge)
1.1. Launch
Module 4: Quadratic Equations and Inequalities
Launch
Do you have the background knowledge and skills you need to complete this lesson successfully? This section, which includes Are You Ready? and Refresher, will help you find out.
Before beginning this lesson you should be able to
- solve linear systems using graphs
- find the equation of a line
- find the equation for a parabola
1.2. Are You Ready?
Module 4: Quadratic Equations and Inequalities
Are You Ready?
Complete these questions. If you experience difficulty and need help, visit Refresher or contact your teacher.
1.3. Refresher
Module 4: Quadratic Equations and Inequalities
Refresher
Use the Solving Linear Systems by Graphing tutorial to review the following:
- Define a system of equations.
- Review the significance of the point of intersection as it relates to a system of equations.
- Determine the solution to a system of linear equations by graphing.
- Review how to verify the solution to a system of equations.

If you encounter difficulties working with the mini-explorer, you may want to use your own graphing technology instead.

Linear Systems Graph can be used to help graph and solve systems of linear equations.
Use the interactive lesson entitled Given Two Points on the Graph to practise writing equations of linear functions. Select Determining the Equation of a Line. Then choose Given the Slope and a Point. Work through slides 1 to 9 only.

Use Quadratic Function (Vertex Form) to find the equation of a parabola.
Go back to the Are You Ready? section and try the questions again. If you are still having difficulty, contact your teacher.
1.4. Discover
Module 4: Quadratic Equations and Inequalities
Discover
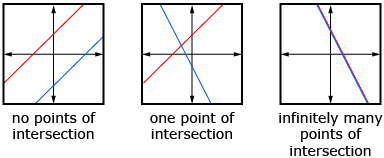
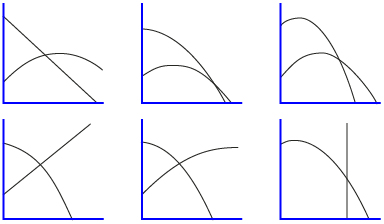
The following graphs show the different ways two linear functions can be sketched on the same set of axes.
In Try This 1 you will construct all the ways that quadratic functions and linear functions can be sketched. You will need to use graph paper. You can use Four Grids or use your own graph paper.
Try This 1
Part A: Linear-Quadratic System
- Think about the number of ways that a parabola and a line can intersect on the coordinate plane. For each of the ways this can happen, sketch a possible graph.
- Consider the following system of equations:
y = x2 + 4x − 1
y = x + 1
-
Why do you think this is called a linear-quadratic system?
-
How many solutions are possible for this system?
-
How could you determine the solutions?
-
Part B: Quadratic-Quadratic System
- Think about the number of ways that two parabolas can intersect on the coordinate plane. For each of the ways this can happen, sketch a possible graph.
- Consider the following system of equations:
y = x2 − 6x + 13
y = –2x2 + 12x − 14
-
Why do you think this is called a quadratic-quadratic system?
-
How many solutions are possible for this system?
-
How could you determine the solutions?
-
![]() Save your work in your folder.
Save your work in your folder.
The concepts you have explored here represent the basis of this lesson. You will work with these concepts further in the remainder of the lesson.
1.5. Explore
Module 4: Quadratic Equations and Inequalities
Explore
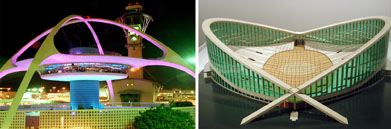
LAX: Los Angeles International
Airport "Theme Building." photo (Los Angeles: Friedman Archives, Gary L.
Friedman, 2001-2009 .) Reproduced with permission.; stadium: A model of the Matthew Nowicki-designed Dorton Arena (Photo courtesy of the Gregg Museum and NC State University Libraries' Special Collections Research Center, 2011.) Reproduced with permission.
Parabolic designs represent a modern innovation in architecture. The aesthetic appeal of the parabola has been used for many structures, including the Los Angeles airport, and the J. S. Dorton Arena in North Carolina, both shown in the photo collage. In both cases, the architects based their designs on the intersection of two parabolas. The point of intersection of the parabolas in each structure is the focal point of the structure.
In Mathematics 10C Learn EveryWare you studied systems of linear equations. You learned that you can graphically determine the solution to a linear system by graphing the equations and then finding the points of intersection. In this lesson you will apply the same graphing techniques to linear-quadratic and quadratic-quadratic systems.
Here are some of the words you will want to define in your copy of Module 4 Glossary Terms in this lesson:
- linear-quadratic system
- quadratic-quadratic system
1.6. Explore 2
Module 4: Quadratic Equations and Inequalities
Solving a System of Equations by Graphing
Recall from your previous studies that to solve a system of equations means to find the values of the variables that will simultaneously satisfy all equations in the system. For example, consider the following system of linear equations:
x + y = 8
2x − y = 7
The solution to the equation is x = 5 and y = 3. This is because these values will satisfy each of the equations in the system. You can verify this by substituting the values into each equation as shown.
Equation 1: x + y = 8
| LS | RS |
|
8 |

Equation 2: 2x − y = 7
| LS | RS |
|
7 |

One way that you can solve a system of equation is by graphing. Recall that the points of intersection of the graphs of a system represent the solutions to the system.
Try This 2
-
- Solve the following quadratic systems by graphing. You may wish to do this using paper and pencil or using a graphing tool.
- 4x − y + 3 = 0
2x2 + 8x − y + 3 = 0
- 2x2 − 16x − y = −35
2x2 − 8x − y = −11
Save a copy of your hand-sketched graphs or, if you used a graphing tool, by taking a screen capture of the completed graphs.
- 4x − y + 3 = 0
- Verify the solution by comparing the left side to the right side, as shown in the example before this Try This activity.
- Solve the following quadratic systems by graphing. You may wish to do this using paper and pencil or using a graphing tool.
- Retrieve your work from Try This 1. Compare your answers from the graphs in Try This 2 to those in Try This 1, Part A, question 1 and Try This 1, Part B, question 3. Do the graphs from this activity have a corresponding match in your earlier work? If not, make any necessary additions or revisions.
![]() Save your work in your course folder.
Save your work in your course folder.
Turn to “Example 2” and “Example 3” on pages 428 to 430 of the textbook. Notice that the systems shown in these examples are precisely the same as those that you just attempted.
- Compare the process you followed to the process shown in the textbook. Note any variations in the solution process that you may use to solve subsequent systems.
- Check that your solutions are correct.
Self-Check 1
Complete Solving by Graphing Self-Check.
1.7. Explore 3
Module 4: Quadratic Equations and Inequalities
Relating a System of Equations to a Given Context
Now that you have learned how to solve linear-quadratic and quadratic-quadratic systems by graphing, you are prepared to consider how these systems can be related to different contexts.

© 1985 California Institute of Technology, The Corporation for Community College Television and The Annenberg/CPB Project
In the next section you will consider a classic physics problem in action. Watch Gravity Experiment (“Newton's Laws: Summary”) to get started.
Share 1
With a partner, consider the following systems.
Decide which system would best represent the scenario shown in Gravity Experiment (“Newton's Laws: Summary”). Give explanations to support your choice. Also give reasons to reject the other choices.
Example 1: Olympic Springboard Diving
Turn to “Example 1” on page 427 of the textbook and work through a context similar to the one you experienced in Gravity Experiment (“Newton's Laws: Summary.”) In this case, the context relates to Olympic springboard diving. Look for the answers to the following questions as you read through the problem:
- In what way is the system represented by this example different from the system in Gravity Experiment (“Newton's Laws: Summary”)?

- The solution not only gives the reasoning for choosing the graph that represents the system, but the solution also gives reasons for eliminating the graphs that do not represent the system. On what grounds are those graphs eliminated?
Try This 3
Julie and Nate are siblings. Julie is older than Nate by 7 yr. The square of Nate’s age 5 yr ago is the same as Julie’s age now.
The situation is represented by this system of equations:
y = x + 7
y = (x − 5)2
- Explain what the variables in the system represent.

- Explain why the system of equations represents the situation.
- Solve the system of equations by graphing. How old are Julie and Nate?
![]() Save your work in your course folder.
Save your work in your course folder.
Share 2
With a partner, compare your work from Try This 3. Discuss the following points. Record your discussion.
- One of the solutions that you obtained from your graph is extraneous. Explain why this solution does not have any meaning in the context of the problem.
- How do you know that there could not be any other solution?
- If you were not given the system of equations, how would you use the information about Julie’s and Nate’s ages to model the situation?
- How could you solve this problem without using a calculator?
![]() Save a copy of your discussion points in your course folder.
Save a copy of your discussion points in your course folder.
You will use your discussion notes as you investigate algebraic methods of solving a system of linear-quadratic equations in the next lesson.
System A is eliminated because the height of the springboard is shown as changing over time.
System B is eliminated because the diver's path is linear, not parabolic.
System C is eliminated because the starting height of the diver is different from the height of the springboard.
1.8. Explore 4
Module 4: Quadratic Equations and Inequalities
Self-Check 2
Complete questions 11, 12, and 14 on pages 437 and 438 in the textbook. Answers
Try This 4
You have just learned how to relate a system of equations to a given context. In Try This 4 you will work through an interactive example to see how you can model a situation based on a quadratic-quadratic system of equations. You will be led through a series of steps that will enable you to solve a measurement problem.

Work through Modelling with a Quadratic-Quadratic System: Waldo’s Sign.
Example 2: Vertical Curves
Turn to “Example 4” on page 430 of the textbook to study a problem involving vertical curves. Look for the answers to the following questions as you read through the problem:
- What is the purpose of a vertical curve in the design of roadways?

- What kinds of systems of equations are used to solve the problem? How many systems of equations are used?
Self-Check 3
Complete questions 10, 13, and 15 on pages 437 and 438 in the textbook. Answer
1.9. Connect
Module 4: Quadratic Equations and Inequalities
Open your copy of the Lesson 5 Assignment, which you saved in your course folder at the start of this lesson. Complete the assignment.
![]() Save your work in your course folder.
Save your work in your course folder.

liquidlibrary/Thinkstock
The Cannon Coaster at Coney Island was an early twentieth-century rollercoaster designed to leap across a gap in the tracks. Unfortunately, the ride failed initial safety tests because factors, such as uneven weight distribution and prevailing wind conditions, would often cause crashes. As a result, the gap was closed and the ride lost a measure of its thrill. Despite this, many people lined up to experience the ride due to false rumours that lives were lost in the ride’s construction.
Project Connection

© wong yu liang/29976438/Fotolia
Go to Module 4 Project: Imagineering. Complete Step 3: Design and Construction.
![]() Save your work in your course folder.
Save your work in your course folder.
Going Beyond
The experiment demonstrated in Gravity Experiment (“Newton's Laws: Summary”) is a classic physics problem that shows that the horizontal component of an object’s motion is independent of its vertical component. You don’t have to take this explanation at face value though. Try this experiment to see if it is true. You will need to work with a partner.
Problem
If two objects fall from the same height, will the objects hit the ground at the same time even if one object possesses a horizontal velocity?
Materials
- two small objects of similar size and weight (e.g., tennis balls, toy cars, whiteboard brushes)
- a flat elevated surface that is at least 1 m in length (e.g., table top, whiteboard ledge)
Procedure
For the purpose of this procedure, assume that the objects are tennis balls and that the flat surface is a kitchen table.
Step 1: Hold Ball A at the level of the flat surface in preparation to drop the ball to the floor.
Step 2: Have your partner position himself or herself at the other end of the table with Ball B.
Step 3: Your partner rolls the ball towards the edge of the table with enough force that it will fall off the table.
Step 4: At the moment Ball B rolls off the edge of the table, drop Ball A.
Step 5: Observe how the balls land—Ball A first, Ball B first, or both balls at the same time.
Step 6: Repeat steps 1 to 5, but have your partner roll Ball B at different speeds.
Analysis
- How did the balls land?
- How did changing the speed of the rolling ball affect the results?
- What conditions are necessary in order for the results of this experiment to be repeated?
- What implications do the results have for calculating how long it takes an object to land?
![]() You may want to save your answers in your course folder.
You may want to save your answers in your course folder.
If you plan to study physics, this might be a problem that you will encounter again.
1.10. Lesson 5 Summary
Module 4: Quadratic Equations and Inequalities
Lesson 5 Summary

© Magnum/24244922/Fotolia
In this lesson you investigated the following questions:
- Why are the points of intersection of a system of equations related to its solution?
- How does a graphical representation facilitate mathematical understanding?
You studied graphical methods of solving systems of linear-quadratic and quadratic-quadratic equations. As in the case of linear systems that you studied previously, the solutions to quadratic systems are found at the points of intersection. This is due to the fact that such points lie on both graphs and therefore satisfy both equations simultaneously.
Throughout this lesson, you used graphs to represent the systems. You learned how to model problems using both linear-quadratic and quadratic-quadratic systems. In many cases, you used a sketch or drawing to help you visualize the problem. By doing so, you were able to better connect the nature of the problem to the math underlying the solution.
In the next lesson you will continue to work with quadratic systems. You will explore methods of solving these systems algebraically.