Lesson 4
| Site: | MoodleHUB.ca 🍁 |
| Course: | Math 20-1 SS |
| Book: | Lesson 4 |
| Printed by: | Guest user |
| Date: | Thursday, 4 December 2025, 2:08 AM |
Description
Created by IMSreader
1. Lesson 4
Module 7: Absolute Value and Reciprocal Functions
Lesson 4: Reciprocal Functions
Focus

iStockphoto/Thinkstock
M. C. Escher was a Dutch graphic artist whose works were mathematically inspired. Though Escher himself was not trained in mathematics, he seemed to have an intuitive understanding of geometry and plane symmetry. While he created pieces on various themes throughout his career, Escher is perhaps best known for his depictions of impossible reality. The image here, though not by Escher, is remarkably similar to his lithograph Relativity. Another one of his works that exhibits this theme is Still Life and Street. You may want to search the Internet for these and other examples of M. C. Escher’s lithographs and woodcuts.
In this lesson you will explore reciprocal functions. Graphing reciprocal functions is similar to creating a work of art. The graph of the reciprocal of a function is very different from the graph of the original function. Like the artworks of Escher, however, the basis of creating the graph is mathematical.
Outcomes
At the end of this lesson you will be able to
- compare the graph of
 to the graph of y = f(x)
- identify, given a function f(x), values of x for which
 will have vertical asymptotes; and describe their relationship to the non-permissible values of the related rational expression
- graph, with or without technology, , given y = f(x) as a function or a graph, and explain the strategies used
- graph, with or without technology, y = f(x), given as a function or a graph, and explain the strategies used
Lesson Questions
In this lesson you will investigate the following questions:
- How are the properties of reciprocals related to the properties of reciprocal functions?
- What are the strategies for graphing the reciprocal of a function?
Assessment
Your assessment may be based on a combination of the following tasks:
- completion of the Lesson 4 Assignment (Download the Lesson 4 Assignment and save it in your course folder now.)
- course folder submissions from Try This and Share activities
- additions to Module 7 Glossary Terms and Formula Sheet
- work under Project Connection
Materials and Equipment
You will need a graphing calculator and graph paper.
1.1. Launch
Module 7: Absolute Value and Reciprocal Functions
Launch
Do you have the background knowledge and skills you need to complete this lesson successfully? This section, which includes Are You Ready? and Refresher, will help you find out.
Before beginning this lesson, you should be able to
- determine the reciprocals of given numbers
- identify non-permissible values of rational expressions
- graph linear and quadratic functions
1.2. Are You Ready?
Module 7: Absolute Value and Reciprocal Functions
Are You Ready?
Complete these questions. If you experience difficulty and need help, visit Refresher or contact your teacher.
- Determine the reciprocals of each of the following values.
- Identify the non-permissible value or values for each expression.
- Sketch the following functions without technology.
How did the questions go? If you feel comfortable with the concepts covered in the questions, skip forward to Discover. If you experienced difficulties, use the resources in Refresher to review these important concepts before continuing through the lesson.
1.3. Refresher
Module 7: Absolute Value and Reciprocal Functions
Refresher

Review the definition of reciprocal by viewing Reciprocal at the Mathematics Glossary.

Watch the video example “Reciprocal of a Mixed Number” to see the steps used to find a reciprocal.
Identify non-permissible values of rational expressions by going to Module 6: Lesson 1: Explore 3 of this course for a review.

Review graphing linear functions by watching the “Graphs of Linear Equations” video.
Khan Academy - CC BY-NC-SA 3.0
Review graphing quadratic functions by watching the video “Graphs of Quadratic Functions.”
Go back to the Are You Ready? section, and try the questions again. If you are still having difficulty, contact your teacher.
1.4. Discover
Module 7: Absolute Value and Reciprocal Functions
Discover

Hemera/Thinkstock
Try This 1
Part A: Special Reciprocals
- Determine the reciprocal of the number in each case.
Number Reciprocal 1 −1 0
- What do you notice about the reciprocals of 1 and −1?
- Give reasoning to justify your response for the reciprocal of zero.
![]() Save your work in your course folder.
Save your work in your course folder.
Part B: Trends in Reciprocals
- Determine the reciprocals of each of the following numbers.
Number Reciprocal 2 3
5 10 20 50 100
- As you move down the “Number” column, how do the numbers change?
- As you move down the “Reciprocal” column, how do the numbers change?
- Complete this sentence:
As a set of numbers increases, the corresponding reciprocals _____________.
![]() Save your work in your course folder.
Save your work in your course folder.
You will use the principles that you have discovered here to support concepts that you will learn later in the lesson.
1.5. Explore
Module 7: Absolute Value and Reciprocal Functions
Explore

Stockbyte/Thinkstock
In music, contrary motion is when two melodies move in opposite directions. For example, on a piano, contrary motion is achieved when the left hand plays an ascending scale while the right hand plays a descending scale. Perhaps surprisingly, even though the notes played by each hand do not match, a pleasant melody is created.
In this lesson you will see how the idea of contrary motion is applied to the graphs of reciprocal functions. You will learn strategies for graphing reciprocal functions and discover how the properties of reciprocals are used to create graphs of reciprocal functions.
Here are some of the words you will want to define in Module 7 Glossary Terms in this lesson:
- reciprocal function
- vertical asymptote
- horizontal asymptote
- invariant point
1.6. Explore 2
Module 7: Absolute Value and Reciprocal Functions
If a function is defined as y = f(x), then its reciprocal function is ![]() . You may recall that a function in this form is considered rational. Remember that rational functions are undefined when the denominator is equal to zero. For instance, consider the function y = x − 1.
. You may recall that a function in this form is considered rational. Remember that rational functions are undefined when the denominator is equal to zero. For instance, consider the function y = x − 1.
The reciprocal of this function is ![]() . This function is defined except where x − 1 is equal to zero. In other words, this reciprocal function is not defined when x = 1. So what does the graph of a function with a restriction look like? Find out in the next activity.
. This function is defined except where x − 1 is equal to zero. In other words, this reciprocal function is not defined when x = 1. So what does the graph of a function with a restriction look like? Find out in the next activity.
Try This 2
- Graph the function
 with technology (graphing calculator or other graphing tool).
- The function is not defined when x = 1. How does the graph behave at points close to x = 1? What line does the graph approach?
- How does the graph behave as x gets larger? As x gets smaller? What line does the graph approach in both cases?
![]() Record your answers and save them in your course folder.
Record your answers and save them in your course folder.
The graph of a reciprocal function will often contain asymptotes. An asymptote is a line that a curve or graph approaches but never touches. Vertical asymptotes occur where the domain is restricted, as you saw in Try This 2. Horizontal asymptotes occur along the x-axis.
In the next exercise, you will use a table to manually graph a reciprocal function.
Try This 3
Consider the function y = x. The reciprocal of this function would be ![]() , where x ≠ 0.
, where x ≠ 0.
- Complete a table like the one that follows.
x y = x
ordered pair, ( x, y)
ordered pair, ( x, y)
−3 −1 

0 

1 3
- Use the ordered pairs from the table to graph y = x and
 on the same set of axes. Differentiate the two graphs by using different colours.
- Verify your graphs from question 2 on a graphing calculator.
- State the properties of each function.
y = x 
Domain Range x-Intercept y-Intercept
![]() Save your answers in your course folder.
Save your answers in your course folder.
Share 1
With a classmate, discuss the following questions. Record your answers.
- What kind of expression is the reciprocal function?
- The denominator of
 cannot be equal to zero. How does this restriction affect the domain on the graph? What is the behaviour that is exhibited at values close to x = 0?
- Explain what happens to the graph as x-values
- increase
- decrease
- increase
- The graph of
 will never touch the x-axis. Explain why.
- Discuss advantages and disadvantages of using a table to graph the reciprocal of a function.
![]() Save your results in your course folder.
Save your results in your course folder.
1.7. Explore 3
Module 7: Absolute Value and Reciprocal Functions
Turn to “Example 1” on pages 394–395. Compare the solution presented in the textbook to your answers from Try This 2. Make any necessary revisions to your own work as you confirm your understanding of the concepts. Pay careful attention to the following elements of the solution:
- Look carefully at the graph along the y-axis. What do you notice? What do you think is the significance of that part of the graph?
- What is the end behaviour of each graph?
- What do you think is meant by invariant points?
Self-Check 1
- A function is defined as f(x) = 3 − 2x. Which of the following is the reciprocal, g(x), of this function?
- Which of the following is the equation of the vertical asymptote for the function
 ?
?
-
Two functions are defined as f(x) = x2 + 9x + 20 and g(x) = x2 + 3x − 10.
The graphs of the reciprocals of f and g share a common vertical asymptote. Which one of these equations does this asymptote have?
- x = 5
- x = −5
- x = 2
- x = −2
Answer - x = 5
1.8. Explore 4
Module 7: Absolute Value and Reciprocal Functions
You saw in Try This 3 that to graph the reciprocal of the function y = f(x), you can plot ![]() for every point (x, y) on the original function. One way to do this is by using a table as you did in Try This 3. There are some disadvantages to using a table or plotting the reciprocal of each individual point. When using a table, for example, it may be necessary to plot more than a dozen points before a trend can be detected. A more efficient method is based on the patterns that you detected earlier in the lesson.
for every point (x, y) on the original function. One way to do this is by using a table as you did in Try This 3. There are some disadvantages to using a table or plotting the reciprocal of each individual point. When using a table, for example, it may be necessary to plot more than a dozen points before a trend can be detected. A more efficient method is based on the patterns that you detected earlier in the lesson.
Retrieve your results from the Discover section. Answer the following questions based on your results.
Self-Check 2
- Which of the numbers below are identical to their reciprocals?

- −1
- 0
- 1
- 2
- −1
-
If a set of numbers is arranged from least to greatest, how would the values of the corresponding reciprocals be arranged?
-
least to greatest
-
greatest to least
-
least to greatest
- What is the reciprocal of zero?
- undefined
- zero
- 1
- −1
Answer
- undefined
1.9. Explore 5
Module 7: Absolute Value and Reciprocal Functions
Before you develop a strategy for sketching a reciprocal function based on the principles you discovered earlier, you can practise graphing by using technology.
Try This 4
Consider the function f(x) = x2− 4.
- Graph y = f(x). Use the window settings x:[−6, 6, 1], y:[−5, 10, 1]. Capture a screenshot image of the graph, and save it in your course folder; or make a sketch of the screen and save the sketch.
- Now graph the function
 . Note the properties of the function. Capture a screenshot image of the graph, and save it in your course folder; or make a sketch of the screen and save the sketch. Write down any questions you may have about what you see.
- Watch the Graphing Reciprocal Functions video to see how you can sketch an accurate graph of a reciprocal function without technology. Be sure to pay attention to the three steps that are outlined. Focus on the following questions:
- What is the acronym that is used to graph reciprocal functions? What do each of the letters represent?
- How are the properties of reciprocals related to the properties of reciprocal functions?

- What is the acronym that is used to graph reciprocal functions? What do each of the letters represent?
Share 2
Discuss the following questions with a classmate.
- Name the properties of reciprocals that you explored in the Discover section.
- How are the properties of reciprocals related to the graphs of reciprocal functions?
- How can you improve upon the A.I.M. method for graphing reciprocal functions? What would you add, delete, or revise?
1.10. Explore 6
Module 7: Absolute Value and Reciprocal Functions
Self-Check 3
Take a moment to check your understanding of the concepts presented so far.
- The partial graph of y = f(x) is shown below.
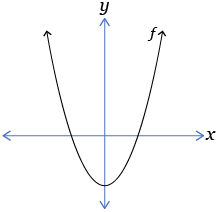
Which of the following graphs represents ?
?
A. 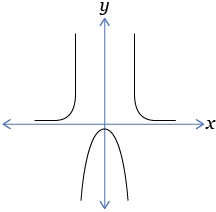
B. 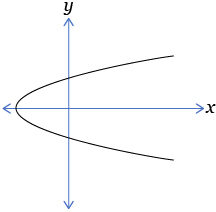
C. 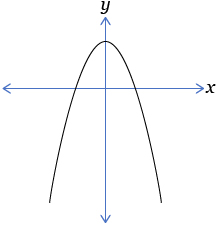
D. 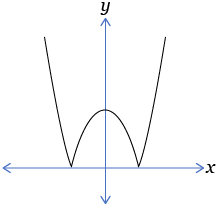
Answer
- If the function g is the reciprocal of f, which of the points below will appear on the function g?

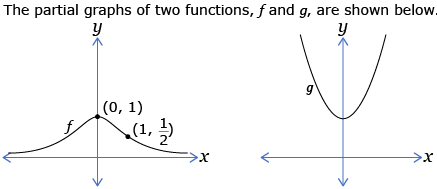
-
(0,1)
- (1,0)

- (1, 2)
-
(0,1)
-
Consider the graphs of the following functions. List the functions in order of least number of asymptotes to greatest number of asymptotes.
-
If g(x) is the reciprocal function of f(x), then what is f(x)?
-
the same function as g(x)
- the reciprocal function of g(x)
- the absolute value function of g(x)
-
the reflected function of g(x)
Answer -
1.11. Explore 7
Module 7: Absolute Value and Reciprocal Functions
If you were asked to identify the reciprocal of the number 2, you would say ![]() . What if you were asked to identify the reciprocal of
. What if you were asked to identify the reciprocal of ![]() ? The answer, of course, is 2. This shows that the reciprocal of a reciprocal is the original number!
? The answer, of course, is 2. This shows that the reciprocal of a reciprocal is the original number!
Consider a question phrased this way:
“If the reciprocal of a number is ![]() , then what is the number?”
, then what is the number?”
This question is really asking for the reciprocal of ![]() .
.
You can adopt a similar approach in graphing functions when given the graphs of reciprocal functions. For example, consider the question:
“If the graph of ![]() is shown, then what does the graph of y = f(x) look like?”
is shown, then what does the graph of y = f(x) look like?”
For this question, you can simply graph the reciprocal function using any of the strategies that you have previously learned. After all, the reciprocal of ![]() is y = f(x) and vice versa. In fact, the question might as well be stated as:
is y = f(x) and vice versa. In fact, the question might as well be stated as:
“If the graph of y = f(x) is shown, then what does the graph of ![]() look like?”
look like?”
Turn to “Example 4” on page 401 to work through an example similar to what has been described above. You have to sketch the original function when given a graph of its reciprocal. Look carefully for the answers to the following questions.
- What property of the graph of a function corresponds to a vertical asymptote?
- How does the location of a vertical asymptote on the graph of a reciprocal function help you to determine the equation of the original function?
Self-Check 4
Turn to pages 403–406 of your textbook to practise applying the concepts that you have learned. Complete questions 2.b. and d., 9, and 10. Check the solutions in the back of the textbook to make sure you are doing the questions correctly. You may also want to review relevant parts of the lesson as you work through the questions.
1.12. Connect
Module 7: Absolute Value and Reciprocal Functions
Open your copy of Lesson 4 Assignment, which you saved in your course folder at the beginning of this lesson. Complete the assignment.
![]() Save all your work in your course folder.
Save all your work in your course folder.
Project Connection
In this lesson you learned strategies for graphing reciprocal functions. You are now ready to move on to the final phase of the project. Go to the project now and complete Step 4. Prepare your project for submission.
![]() Save all your work in your course folder.
Save all your work in your course folder.
Going Beyond
Investigating the Reciprocals of Trigonometric Functions
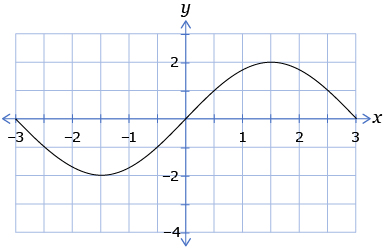
Earlier in this course, you learned the principles of trigonometry, including how to solve trigonometric equations. The following graph is the partial graph of y = sin x.
-
-
Sketch the graph of the reciprocal of y = sin x.
- Determine the domain, range, and equations of the asymptotes.
-
Sketch the graph of the reciprocal of y = sin x.
-
- Sketch the graph of the reciprocal of y = cos x.
- Determine the domain, range, and equations of the asymptotes.
- Sketch the graph of the reciprocal of y = cos x.
-
- Sketch the graph of the reciprocal of y = tan x.
- Determine the domain, range, and equations of the asymptotes.
- Sketch the graph of the reciprocal of y = tan x.
In the next math course in this stream you will explore these graphs. You will also learn that there are names for these specific functions!
![]() Save your answers in your course folder.
Save your answers in your course folder.
1.13. Lesson 4 Summary
Module 7: Absolute Value and Reciprocal Functions
Lesson 4 Summary

© pureguitarfury/4749720/Fotolia
In this lesson you investigated the following questions:
- How are the properties of reciprocals related to the properties of reciprocal functions?
- What are the strategies for graphing the reciprocal of a function?
In this lesson you learned that the graph of the reciprocal of a function can be obtained by plotting the point ![]() for every point (x, y) on the original function. Since it would not be efficient to transform each point on the function, you explored other graphing strategies. One strategy was to use a table to track a set of points.
for every point (x, y) on the original function. Since it would not be efficient to transform each point on the function, you explored other graphing strategies. One strategy was to use a table to track a set of points.
Another strategy for graphing reciprocal functions that you learned is based on the properties of reciprocals. The A.I.M. method quickly allows you to identify key properties of the graph, including locations of asymptotes, y-intercepts, and the direction of each part of the curve.
Throughout this lesson, you saw how the properties of reciprocals are applied in the graphing of reciprocal functions. You saw how the
- undefined reciprocal of zero translates into a vertical asymptote
- fact that the reciprocal of 1 is also 1, and the reciprocal of –1 is also –1, translates into invariant points
- contrary motion of a set of numbers and their reciprocals translates into the opposing directions of functions and their reciprocals
You will continue to study different types of functions in the future. Your understanding of the properties of these functions will help you to use them to model real-world situations.