Lesson 1
| Site: | MoodleHUB.ca 🍁 |
| Course: | Math 30-3 SS |
| Book: | Lesson 1 |
| Printed by: | Guest user |
| Date: | Sunday, 2 November 2025, 12:14 PM |
Description
Created by IMSreader
1. Lesson 1
Module 1: Probability
Lesson 1: Experimental Probability
Focus

Hemera/Thinkstock
Various levels of predicted and worst-case scenario flooding are often shown on flood maps. However, estimating flooding beyond the “100-year flood” is a difficult task, as there is a lack of historical flood information to compare.
Estimates of how often a flood will occur in a given time period are referred to as a “1-in-20-year flood” or “1-in-100-year flood” and are based on the amount of flooding that occurs.
The longer the time period, the larger the flood event. Statistically, this means that a 1-in-100-year flood will have a one percent chance of occurring in any given year. A 1-in-100-year flood would be rarer and much bigger than a 1-in-20-year flood.
This does not mean that if a 100-year flood happened this year, it wouldn't happen again for another 100 years. It could happen again next year, or even two or more times in any year.
Lesson Outcome
At the end of this lesson you will be able to use data to help make predictions and/or determine the probability of an event.
Lesson Question
In this lesson you will investigate the following question:
- How does probability affect your decisions?
Assessment
Your assessment may be based on a combination of the following tasks:
- completion of the Lesson 1 Assignment (Download the Lesson 1 Assignment and save it in your course folder now.)
- course folder submissions from Try This and Share activities
- additions to Glossary Terms and Formula Sheet
- work under Project Connection
Self-Check activities are for your own use. You can compare your answers to suggested answers to see if you are on track. If you have difficulty with concepts or calculations, contact your teacher.
Remember that the questions and activities you will encounter provide you with the practice and feedback you need to successfully complete this course. You should complete all questions and place your responses in your course folder. Your teacher may wish to view your work to check on your progress and to see if you need help.
Materials and Equipment
You will need
- calculator
- two standard six-sided dice (virtual dice are also available in the lesson)
1.1. Launch
Module 1: Probability
Launch
Do you have the background knowledge and skills you need to complete this lesson successfully? Launch will help you find out.
Before beginning this lesson you should be able to
- convert between decimals, percentages, and fractions
- find the percent of a number
- solve equations using proportional reasoning (cross multiplying)
1.2. Are You Ready?
Module 1: Probability
Are You Ready?
Complete these questions. If you experience difficulty and need help, visit Refresher or contact your teacher.
- Convert the percent to a decimal.
- Calculate the percentage.
- Complete the table.
Percent
Decimal
Fraction
30%
0.24

62.5%
0.2

125%
0.035

Answer - Solve for x.
- Sean gets 70% on a test consisting of 20 questions. How many questions did Sean get right? Answer
- Assume that 60% of children will have a cellphone by the time they are fourteen years of age. In a group of 90 fourteen-year-olds, how many can you assume will have a cellphone? Answer
- There were 24 students who took their class 5 drivers test during a particular week. Of those 24 students, 18 passed the test. What percentage of students did not pass the test? Answer
If you answered the Are You Ready? questions without difficulty, move to Discover.
If you found the Are You Ready? questions difficult, complete Refresher.
1.3. Refresher
Module 1: Probability
Refresher

iStockphoto/Thinkstock
Recall that a ratio is a comparison between two things.
For example, suppose a mixed ball-hockey team has 3 female players on a team of 10. How can the number of female players on this team be represented?
There are a few ways to express this; however, the most common way is to write a ratio in a fractional form. Here are a few ratios to represent the number of female players:
- female players to all players:

- female players to male players:

A ratio can also be expressed as a percent or a decimal.
Recall that percent is a ratio represented out of 100. Therefore, if there are 100 players on the team and the ratio remained consistent, what percentage of players could you assume would be female?
Write the ratio as equivalent fractions, with x representing the number of female players out of 100.

Therefore, x = 3 × 10 or 30.
![]()
30% written as a decimal is simply “3 divided by 10” ![]() or “30 divided by 100”
or “30 divided by 100” ![]() which equals 0.30.
which equals 0.30.
In summary, the number of female players on this ball-hockey team can be expressed in the following ways.
Percent |
Decimal |
Fraction |
30% |
0.30 |
|

Screenshot reprinted with permission of ExploreLearning
Use the "Percent, Fractions, and Decimals" gizmo, as well as the following questions, to help you further develop your understanding in connecting percents, fractions, and decimals.
- Adjust the grid size to be 10 by 10. (Drag the handle in the lower-right corner to change the size of the grid.)
- In your notebook, make a table like the one shown.
Number of Shaded Squares
Percent
Decimal
Fraction
- In the first column, write down five random numbers between 0 and 100.
- Using the gizmo, shade the number of squares that you have in row one of the table.
- Complete the table by making note of its equivalent percent, decimal, and fraction as provided in the gizmo.
- Can you think of some strategies that will help you quickly convert percent, decimals, and fractions without using the gizmo?
Go back to the Are You Ready? section and try the questions again. If you are still having difficulty, contact your teacher.
1.4. Discover
Module 1: Probability

© RTimages/6986221/Fotolia
Discover
How do you make decisions? Some decisions can be made quickly, while others need time for deliberation.
Think of a difficult choice that you have had to make recently. It might have involved choosing a cellphone, a transportation method, a computer, the date and destination for a vacation, a school, and so on.
How did you make the decision? Perhaps your decision was based on facts and information, prior knowledge, assumptions, and observations, or maybe you used your emotion or intuition.
Looking back, did you make the right decision? If you could change it, would you and why?
Photos.com/Thinkstock
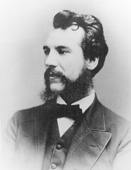
In 1876, William Orton, President of the Western Union Communications Company, was approached by Gardiner G. Hubbard, an investor in a recent communication invention to buy a patent (No. 174,465) for $100 000. At that time, the Western Union had a monopoly on the market because of their most advanced telegraph communications technology. Orton appointed a committee to investigate the offer. After careful consideration, he decided to turn the offer down, referring to the patented device as a novelty toy that they had no use for.
The patent was for the telephone, invented by Alexander Graham Bell. Bell kept the patent and in a few decades, he had the largest communication corporation in America.
Try This 1
It is difficult to make decisions that affect the outcomes of the future. Making logical predictions based on data would certainly make decision making easier! Test your predicting abilities in the following activity.

Open Dice Roller and use it to answer the following questions.
- Does each number on the green die have an equal chance of appearing when rolled?
- Predict how many times each number will appear on the green die in 6 rolls. Explain your reasoning.
Roll the die 6 times and record the results from the green die in a table like the one shown.
Outcome
Tally
1
2
3
4
5
6
Total
- Did the results show that each number appeared once when the green die was rolled 6 times?
Now roll the die 6 more times and continue recording the results from the green die in your table.
-
How many times would you expect each number to appear after rolling a die 12 times?
- From your results, are there any numbers on the die that have not yet appeared?
Roll the die 6 more times and continue recording the results from the green die in your table.
By now, you should have rolled the die a total of 18 times. Complete your table by adding a frequency column as seen in the hint. Once you are finished rolling the die, fill in the frequency column of your table. Your table should have 18 rolls of the green die.
![]() Save your responses in your course folder.
Save your responses in your course folder.
Share 1
With a partner or in a group, share the results of your table and responses to the previous questions.
- Were the frequencies of the outcomes the same? Explain.
- Create a new table containing the combined results from your partner’s table or each group member’s table. Determine the sum of the frequency column. What does that number tell you?
- From this new table, how many times would you expect any particular number to occur? Is this the same for each number 1 through 6?
- Describe a way you could numerically represent the likelihood of a 2 occurring when you roll a standard 6-sided die once.
![]() Save your shared responses in your course folder.
Save your shared responses in your course folder.
Outcomes are the list of events that are possible when a die is rolled. A tally is a list of ticks or checks that represent the number of times an outcome occurs. Frequency is the numerical representation of the tally. An example of what the table may look like after rolling the green die six times is shown.
Outcome |
Tally | Frequency |
1 |
l l | 2 |
2 |
0 |
|
3 |
l | 1 |
4 |
l l l | 3 |
5 |
0 |
|
6 |
0 |
1.5. Explore
Module 1: Probability
Explore
Stockbyte/Thinkstock
Your table of results from Share 1 may have resembled the one shown.
Outcome |
Frequency |
1 |
5 |
2 |
9 |
3 |
6 |
4 |
11 |
5 |
4 |
6 |
1 |
Total |
36 |
The total of the frequency column represents the total number of times the die was rolled, or the number of possible outcomes.
Looking at the example table given, what was the chance of rolling a 5? What was the chance of rolling a 1? ![]()
1.6. Explore 2
Module 1: Probability
probability: the chance of an event happening, expressed as a percentage, fraction, ratio, or a statement 1
experimental probability: a ratio of the number of occurrences of a particular event during an experiment or trial to the total number of trials conducted 2
1-2 Source: MathWorks 12 Student Book/Teacher Guide. (Vancouver: Pacific Educational Press, 2011.)
A word that can easily replace chance is probability.
If the probability is determined from an experiment, such as rolling a die many times and making a frequency table, then it is called experimental probability. The activity you did in Discover was an example of experimental probability.
In Try This 2 you will show the different ways of representing probabilities.
Try This 2
Outcome |
Frequency |
1 |
5 |
2 |
9 |
3 |
6 |
4 |
11 |
5 |
4 |
6 |
1 |
Total |
36 |
The following table expresses the experimental probability of each of the outcomes from rolling one die using the preceding frequency table.
The probabilities are in the form of fractions, decimals, percentages, and words.
Copy and complete the table by filling in the missing blanks. Round the decimal to the nearest thousandth. The first row has been done for you.
EXPERIMENTAL PROBABILITY |
||||
Outcome |
Fraction |
Decimal |
Percentage |
Words |
1 |
|
0.139 |
13.9% |
5 out of 36 |
2 |
|
|
|
|
3 |
|
|
17% |
|
4 |
|
0.31 |
|
|
5 |
|
|
|
|
6 |
|
|
|
1 out of 36 |
![]() Save your responses in your course folder.
Save your responses in your course folder.
1.7. Explore 3
Module 1: Probability
In Try This 2 you found that probabilities can be expressed as fractions, decimals, percentages, and in words. Now try Self-Check 1 to test your abilities in demonstrating these skills.
Self-Check 1
Answer “Build Your Skills” question 1 on page 154. Answer
From your work in Try This 2 and Self-Check 1, you may have noticed a pattern in the way probability is calculated as a fraction. The pattern can be condensed into a formula. The experimental probability of an event occurring can be calculated from a frequency table using the following formula.
![]()
Source: MathWorks 12 Student Book/Teacher Guide. (Vancouver:Pacific Educational Press, 2011.)
Outcome |
Frequency |
1 |
5 |
2 |
9 |
3 |
6 |
4 |
11 |
5 |
4 |
6 |
1 |
Total |
36 |
From the frequency table, the chance of rolling a 5 is ![]() That is because a 5 occurs 4 times out of 36 rolls.
That is because a 5 occurs 4 times out of 36 rolls.
Similarly, the chance of rolling a 2 is ![]() That is because a 2 occurs 9 times out of 36 rolls.
That is because a 2 occurs 9 times out of 36 rolls.
1.8. Explore 4
Module 1: Probability
Self-Check 2
An experiment is performed that consists of spinning a spinner and recording the results.
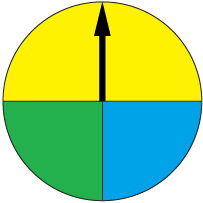
The results from 40 spins are recorded in the following table.
Outcome |
Frequency |
yellow |
23 |
green |
6 |
blue |
11 |
Total |
40 |
- Express each question outcome in a different way, such as a fraction, decimal, or percent.
- If the spinner was spun 120 times, how many times would you expect it to land on yellow? Answer
![]()
- Answer “Build Your Skills” questions 2 and 3 from page 154. Answer
random sample: a sample randomly selected from a larger population
In business and industry, smaller random samples are often taken from a larger group to help make informed decisions. The information gained from the random sample can be used to make predictions and estimates about the larger group. The larger group is often called a population. In the next activity, you will explore the idea of random sampling.
Try This 3

iStockphoto/Thinkstock
As media players come off the assembly line, they are tested to see if they are defective in any way. It is not practical, due to time and money constraints, to test each media player. The supervisor decides to assign an employee to test a random sample of the media players.
Out of the 386 media players in the random sample, it was found that 4 were defective in some way.
- Express the probability of a media player being defective as a fraction, a decimal, a percentage, and in a statement.
- If 12 000 media players were produced in a production run, how many would you expect, based on the results of the random sample, to be defective?
![]() Save your responses in your course folder.
Save your responses in your course folder.
1.9. Explore 5
Module 1: Probability
In Try This 3 the probability that a media player was defective was determined by the ratio ![]() which is equal to
which is equal to ![]() or 0.010 36.
or 0.010 36.
The probability determined in the random sample can be used to estimate the number of defective media players in the larger group of 12 000.
Compare the following two strategies to arrive at your solution.
Strategy 1 |
Multiply the total number of media players by the probability.
|
| Strategy 2 |
The proportion of defective media players in the random sample should be the same as the proportion of defective media players in the entire production run.
|
Based on the results from the random sample, in a production run of 12 000 media players, it can be expected that approximately 124 will be defective.
Try This 4
![]()
Turn to page 149 of the textbook and read “Example 1.” You may notice that it is similar to the Try This 3 media player problem.
Use Try This 3 as a guide to solve the Example 1 problem before reading the solution provided in the textbook.
When you have completed the questions in the example, check your answers with the solution provided on the bottom of page 149 and the top of page 150 before continuing.
1.10. Explore 6
Module 1: Probability
Self-Check 3
![]()
Answer “Build Your Skills” questions 4 to 6 on page 154. Answer
In Try This 3 and Self-Check 3, you used a random sample from a population to make predictions about the entire population. How important do you think the size of the random sample is? Do you think a small sample or a large sample will give better information about the population? In the following activity, you will explore the effects of different sample sizes.
Try This 5

Open the activity Sample Size.
Set the population size to 1800 and the sample size to 5. Click the “Take Sample” button to take a sample of the population. (You don’t need the “Check True Values” or “New Population” buttons yet.)
Determine the proportion of objects that are defective. ![]()
Create a table similar to the one that follows and use information from Sample Size to complete the first line of the table.
Sample |
Number |
Proportion Defective |
5 |
|
|
10 |
|
|
20 |
|
|
50 |
|
|
100 |
|
|
150 |
|
|
200 |
|
|
300 |
|
|
500 |
|
|
Change the sample size to 10 and click “Take Sample” to complete the second line of the table.
Complete the remainder of the table using the same population.
- Which sample size do you expect has a defective proportion closest to the defective proportion of the population? Explain your reasoning.
Click the “Check True Values” button and determine the actual proportion of defective objects from the population.
- How does the true proportion of defective objects compare to the sample proportions?
![]() Save your responses in your course folder.
Save your responses in your course folder.
Share 2
With a partner or in a group, discuss your findings from Try This 5. Then, complete the following questions.
- Describe the pros and cons of a large sample size.
- Describe the pros and cons of a small sample size.
- Explain what size you feel is a good sample size for the population you used in Try This 5.
![]() Record your shared responses in your course folder.
Record your shared responses in your course folder.
This is the number of defective objects divided by the size of the sample.
![]()
1.11. Explore 7
Module 1: Probability
Self-Check 4
![]()
Check how well you can calculate experimental probability by doing “Build Your Skills” questions 7 and 8 on page 155. You’ll get a chance to use your probability skills to solve problems as well. Answer
Add the following terms to your copy of Glossary Terms:
- probability
- experimental probability
- random sample
Add the following formula to your copy of Formula Sheet:
The formula for calculating the probability (P) of event A is
![]()
1.12. Connect
Module 1: Probability
Complete the Lesson 1 Assignment that you saved in your course folder at the beginning of the lesson. Show work to support your answers.
![]() Save your responses in your course folder.
Save your responses in your course folder.
Project Connection
You are ready to start working on Module 1 Project: Applying Probability in a Business. Go to the Module 1 Project and read over all project requirements. Become familiar with what you will be doing and how you will be assessed.
Your Module 1 Project will be evaluated by your teacher using the evaluation guidelines in the Project Rubric. Read the rubric carefully. Make sure you are aware of how you will be assessed. You can print or save a digital copy of the rubric.
Go to Module 1 Project: Applying Probability in a Business. Begin your research for Part 1: Start to Plan, Step A. To guide your research, take note of the questions provided in Step B.
![]()
Make sure to save all your work in your course folder as you will be building onto your project in each lesson.
1.13. Lesson 1 Summary
Module 1: Probability
Lesson 1 Summary
Hemera/Thinkstock
In this lesson you looked at examples of experimental probability and made decisions pertaining to the chance of an event occurring, such as the chance of a flood in the next 100 years. Experimental probability is based on past experiments to help decide whether a specific outcome may or may not occur. In the next lesson you will begin to explore theoretical probabilities. These probabilities are determined without conducting an experiment or looking at previous data.