Lesson 3
| Site: | MoodleHUB.ca 🍁 |
| Course: | Math 30-3 SS |
| Book: | Lesson 3 |
| Printed by: | Guest user |
| Date: | Saturday, 1 November 2025, 7:37 AM |
Description
Created by IMSreader
1. Lesson 3
Module 1: Probability
Lesson 3: Odds and Probability
Focus
Hemera/Thinkstock
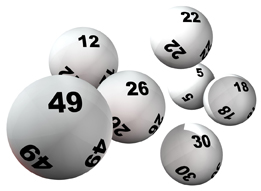
For most people, winning the lottery is a dream. For only a few dollars you can select six numbers between 1 and 49 for example, and if those numbers are drawn, then you win the grand prize! The grand prize varies from one million dollars and up.
In this lottery scenario, the odds of winning the grand prize are 1 to 13 983 815. What does this mean? Do you have a good chance of winning? Does buying more tickets and choosing different numbers increase your chance of winning? What are the odds of you not winning the grand prize?
This lesson will focus on the concept of odds and probability. Perhaps winning a million dollars or more will become a reality for you!
Lesson Outcomes
At the end of this lesson you will be able to
- interpret statements pertaining to odds and probability
- connect odds to probability
Lesson Questions
You will investigate the following questions:
- What is the relationship between odds and probability?
- How are odds calculated?
- How does an understanding of odds and probability help you make decisions and solve contextual problems?
Assessment
Your assessment may be based on a combination of the following tasks:
- completion of the Lesson 3 Assignment (Download the Lesson 3 Assignment and save it in your course folder now.)
- course folder submissions from Try This and Share activities
- additions to Glossary Terms
- work under Project Connection
Materials and Equipment
You will need
- calculator
1.1. Discover
Module 1: Probability
Discover
You have been calculating the experimental and theoretical probability of an event. You know that ![]() You will now examine the probability of event A not occurring.
You will now examine the probability of event A not occurring.
Try This 1
Consider the following set of shapes.
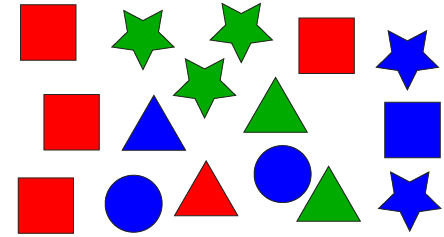
- Complete the following table to show the number of each type of shape. The first row has been completed for you.
Red
Green
Blue
Total
Triangle
1
2
1
4
Square
Star
Circle
Total
-
- Suppose you were to choose a shape at random. Explain how you could compare the chance of getting a shape that is red to the chance of getting a shape that is not red.

- Use the strategy you described above to compare the chance of getting a square to getting a shape that is not a square.
- Suppose you were to choose a shape at random. Explain how you could compare the chance of getting a shape that is red to the chance of getting a shape that is not red.
-
- Calculate the probability of choosing a shape that is red, and the probability of choosing a shape that is not red.
- Calculate the probability of choosing a square and choosing a shape that is not a square.
- Calculate the probability of choosing each colour.
![]() Save your work in your course folder.
Save your work in your course folder.
Share 1
With a partner or in a group, share your responses from the Try This 1.
- How did your strategies for calculating the chance of getting a specific shape, and the chance of not getting a specific shape from question 2 compare?
- How are the probabilities you calculated in question 3 related to the comparisons you made in question 2?
![]() Save your work in your course folder.
Save your work in your course folder.
1.2. Explore
Module 1: Probability
Explore
odds: a ratio that compares a desired event to the number of undesired events or vice versa
Source: MathWorks 12 Student Book/Teacher Guide. (Vancouver: Pacific Educational Press, 2011.)
In Try This 1 and Share 1, you should have noticed that the number of red shapes added to the number of non-red shapes equals the total number of shapes. You could express this ratio in the following ways:
- the number of red shapes:non-red shapes
- the number of red shapes
total number of shapes − number of red shapes)
You also should have noticed that the probability of choosing a red shape added to the probability of choosing a non-red shape is 1.
So far in this module you have used probabilities to compare the likelihood of events, such as rain on your camping trip, occurring. Another method of comparison is to use odds. You might want to compare the odds of getting into a technical school to the odds of getting an apprenticeship when you finish school.
Since odds are a ratio, they can be simplified in the same way as fractions.
Simplifying a Fraction |
Simplifying Odds |
|
6:18 = 1:3 |
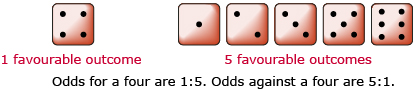
For example, the odds of rolling a four on a standard six-sided die are 1:5, read as “one to five” since there is 1 four and 5 non-four sides. Notice that there are a total of six sides, one with a four and five with numbers other than a four.
You can also list the odds against an event. In this situation, the ratio compares the unfavourable events to the favourable event, which is the one you want to occur. The odds against rolling a four are 5:1, read as “five to one.”
In Try This 2 you will use your knowledge of the number of favourable events compared to the number of unfavourable events and their relationship to the total number of events.
Try This 2

Ingram Publishing/Thinkstock
Estella is a member of her school’s badminton team. She joins 4 other players from her school to compete in a singles tournament with 65 players from other schools.
Assuming that all players are evenly matched, answer the following questions.
- Determine the odds for Estella winning the tournament.
- Determine the odds against Estella winning the tournament.
- Determine the odds against a student from Estella’s school winning the tournament.
- Determine the odds for a student from Estella’s school, who is not Estella, winning the tournament.
![]() Save your work in your course folder.
Save your work in your course folder.
Share 2
With a partner or in a group, share your responses to the questions in Try This 2.
Suppose Estella and the other 4 players from her school have a practice tournament. In the past, Estella has won most of the practice tournaments. Are her odds of winning this practice tournament 1:4? Explain.
![]() Save your work in your course folder.
Save your work in your course folder.
1.3. Explore 2
Module 1: Probability
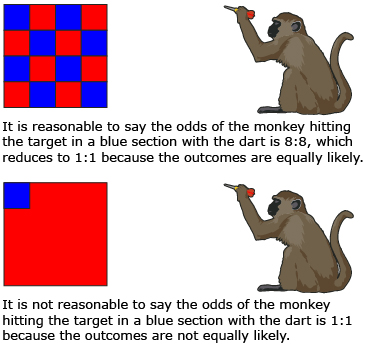
You should have noticed that when calculating the odds of any player winning the tournament, it was important to know that they were all evenly matched. In the same manner, all ticket holders would be equally likely to win a lottery if they all purchased the same number of tickets.
Self-Check 1
![]()
- Turn to page 168 of the textbook, and work through “Example 1.” Check your answer with the solution provided on the same page.
- Answer “Build Your Skills” questions 1, 2, and 3 on page 172. Answer
In Lesson 2 of this module you learned that to calculate theoretical probability, you need to know the likelihood of each outcome.
In Share 2 you may have noticed that to calculate odds from the number of favourable to unfavourable outcomes, each outcome must also be equally likely.
Probability and odds are closely related in other ways as well. Knowing the number of favourable events and the number of unfavourable events, you can calculate the total number of events that is used in determining probability. The following activity explores how to determine the probability if you know the odds.
Try This 3
In Focus you were told the odds of choosing the six numbers that are drawn in a lottery was 1 to 13 983 815. This means there is one way for you to win and 13 983 815 ways for you to lose.
- What is the total number of events possible?
- What is the probability that you will win?
- What is the probability that you will lose?
- Explain how these probabilities are related to the odds.
![]() Save your work in your course folder.
Save your work in your course folder.
1.4. Explore 3
Module 1: Probability
In Try This 3 you may have found that both odds and probability can be used to express the chance of something happening. However, consider the following table.
Odds |
Probability |
compares an event to its alternatives |
compares an event to all possible outcomes |
From previous lessons, you learned that the probability of an event is the number of favourable outcomes divided by the total possible outcomes. The odds in favour of an event occurring is the ratio of the number of ways the event may occur to the number of ways the event does not occur.
Sometimes it is useful to determine the odds when you know a probability. Complete the following Try This activity to explore this idea.
Try This 4
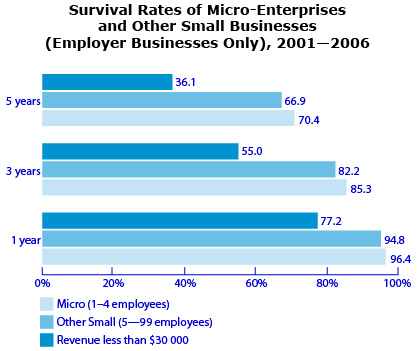
Source: �Figure 3: Survival Rates of Micro-Enterprises and Other Small Businesses (Employer Businesses Only), 2001�2006.� Key Small Business Statistics - January 2009: How long do small businesses survive? (Industry Canada, 2009), <http://www.ic.gc.ca/eic/site/sbrp-rppe.nsf/eng/rd02345.html>; (11 March 2012)
The survival of small businesses depends on a number of factors, which may include location, size, availability of capital, education of employees and management, age of business, innovation, and the business plan. These factors can be controlled and/or are predictable, but there are also factors that are unforeseen, such as the current economy, the market influences, and the number of competitors. Regardless of the factors, the goal of all business owners is to increase the odds of success, and thus survive.
The graph shows the survival rates for three different sized small businesses in Canada. These success rates are examples of experimental probabilities. Use these to answer the following questions.
-
- Which of the three types of small businesses has the greatest survival rate?
- Explain the relationship between the length of time in business and the survival rate for small businesses.
-
- What is the probability that a microbusiness will survive three years?
- What are the odds of a microbusiness surviving three years?
- What are the odds against a microbusiness surviving three years?
- Suppose you watched 450 new businesses with 5–99 employees for five years.
- How many businesses do you expect to survive?
- How many businesses do you expect to fail?
![]() Save your work in your course folder.
Save your work in your course folder.
Share 3
With a partner or in a group, share the results of your responses to Try This 4, and answer the following questions.
- Explain why the odds of a business surviving decreases as time increases.
- Explain the relationship between the number of successes, the number of failures, and the total number of businesses.
- List some reasons that could cause a new business to fail.
![]() Save your work in your course folder.
Save your work in your course folder.
1.5. Explore 4
Module 1: Probability
Self-Check 2
Turn to pages 168 and 169 of the textbook and work through “Example 2.” Check your answer with the solution provided on page 169. Compare the strategies used to the strategies you used in Try This 4.
You have now learned how to convert probability into odds by determining the total number of favourable outcomes and the number of unfavourable outcomes.
Complete the following activity to review how odds and probability are related.
Share 4
With a partner or a group, discuss the solutions to “Discuss the Ideas” questions 1 and 2 on page 170.
![]() Save your work in your course folder.
Save your work in your course folder.
You should have noticed that both probability and odds measure the likelihood of an event occurring. Whether you measure the likelihood in odds or probability depends on the context and you can easily convert from one form to the other.
Self-Check 3
Answer “Build Your Skills” questions 4, 5, and 7 on page 173. Answer
Add odds to your copy of Glossary Terms.
1.6. Connect
Module 1: Probability
Complete the Lesson 3 Assignment that you saved in your course folder at the beginning of the lesson. Show work to support your answers.
![]() Save your work in your course folder.
Save your work in your course folder.
Project Connection
You are now ready to apply your knowledge of the relationship between odds and probability to Module 1 Project: Applying Probability in a Business. Go to the Module 1 Project, and complete Part 2: Products and Promotions. Be sure you answer Step 3 questions 1 to 3 that follow your research.
![]() Save your work in your course folder.
Save your work in your course folder.
1.7. Lesson 3 Summary
Module 1: Probability
Lesson 3 Summary
In this lesson you explored how odds can be used to express the likelihood of an event occurring. In this way, calculating odds is similar to calculating probability. Odds compare the number of favourable outcomes to the number of unfavourable outcomes, and probability compares the number of favourable outcomes to the total number of possible outcomes.
In the next lesson you will use your knowledge of odds and probabilities to help you solve problems and make decisions.