Lesson 4
| Site: | MoodleHUB.ca 🍁 |
| Course: | Math 30-3 SS |
| Book: | Lesson 4 |
| Printed by: | Guest user |
| Date: | Sunday, 2 November 2025, 12:14 PM |
Description
Created by IMSreader
1. Lesson 4
Module 1: Probability
Lesson 4: Applications and Problem Solving
Focus
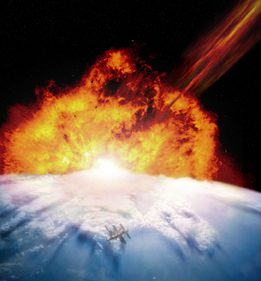
Photodisc/Thinkstock
NASA’s Near Earth Object Program identifies and tracks objects that will pass nearby Earth. They display information about these objects daily, including a probability that the objects will collide with Earth. On January 6, 2012 the two objects with the highest probability of hitting Earth were named “2011 UZ255” and “2011 VG9.” 2011 UZ255 had a diameter of 75 m and a probability of 0.000 029 of colliding with Earth. 2011 VG9 had a diameter of 120 m and a probability of 0.000 002 3 of colliding with Earth.
Should you be worried that an object from space will strike Earth? If one of the objects listed above did strike Earth, is it likely that you would be affected? How much should governments invest in defending Earth against objects like asteroids?
You can look up information from the Near Earth Object Program at the following websites:
In this lesson you will explore when and how to apply odds and probabilities to help solve problems.
Lesson Outcome
At the end of this lesson you will be able to use probability and odds to help make decisions.
Lesson Question
In this lesson you will investigate the following question:
- How can probability and odds be used to help make decisions?
Assessment
Your assessment may be based on a combination of the following tasks:
- completion of the Lesson 4 Assignment (Download the Lesson 4 Assignment and save it in your course folder now.)
- course folder submissions from Try This and Share activities
- additions to Glossary Terms
- work under Project Connection
Materials and Equipment
You will need
- calculator
1.1. Discover
Module 1: Probability
Discover
Disasters such as asteroids hitting the Earth are not likely. However, there are many other natural disasters that are much more likely to occur.
Try This 1
An earthquake can be a frightening event, and major ones have the potential to cause significant damage. Moderate and major earthquakes are more common off the coast of British Columbia than other areas of Canada. The following image shows how the Richter scale is used to measure the magnitude of an earthquake. Larger numbers on this scale indicate more violent shaking. Open “Earthquakes in or near Canada, 1627 – 2012” to see a larger version of the image.
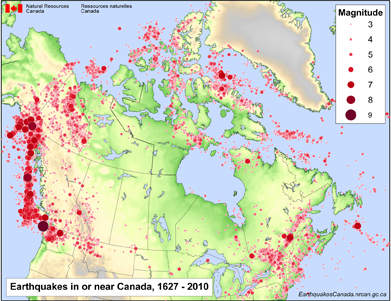
Source: Earthquakes in or near Canada, 1627 - 2010, (Natural Resources Canada, 2012),
< http://www.earthquakescanada.nrcan.gc.ca/historic-historique/images/caneqmap_e.pdf>; (11 March 2012).
| MMI | Description of Effects |
| V | Felt indoors by practically all, outdoors by many or most. Buildings tremble throughout. Broken dishes and glassware to some extent. Hanging objects and doors swing, generally. Pictures knocked against walls or swung out of place. |
| VI | Felt by all, indoors and outdoors. General excitement, some alarm. Damage slight in poorly built buildings. Fall of plaster, cracks in plaster, and fine cracks in chimneys in some instances. Broken dishes and glassware in considerable quantity, as well as some windows. Overturned furniture in many instances. |
| VII | General alarm, all run outdoors. Some or many find it difficult to stand. Damage negligible in buildings of good design, slight to moderate in ordinary buildings and considerable in poorly built or badly designed buildings. Cracked chimneys to considerable extent and walls to some extent. Fall of plaster in considerable to large amounts. Dislodged brick and stone. Overturned heavy furniture. |
Source: Probabilities Of Significant Earthquake Shaking In Communities Across British Columbia: Implications For Emergency Management, 1627 - 2010, (Natural Resources Canada, 2010) <ftp://seismo.nrcan.gc.ca/pub/hazardpubs/13WCEEp1065Onur_Seemann.pdf> (11 March 2012).
The following image shows the distribution of earthquake shaking probabilities in BC within a 100-year period (for firm ground). Open “Probabilities Of Significant Earthquake Shaking” to see a larger version of the image.
Modified Mercalli Intensity (MMI) is a descriptive scale based on how severely the shaking was felt and how much damage certain types of structures suffered at a certain location.
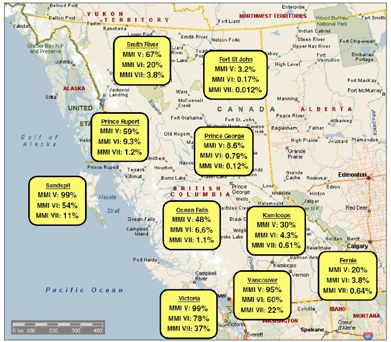
Distribution of earthquake shaking probabilities in
BC within a 100-year period (for firm ground)
Source: Probabilities Of Significant Earthquake Shaking In Communities Across British Columbia:
Implications For Emergency Management, 1627 - 2010, (Natural Resources Canada, 2010),
<ftp://seismo.nrcan.gc.ca/pub/hazardpubs/13WCEEp1065Onur_Seemann.pdf> (11 March 2012).
Probabilities of Exceeding MMI V, VI, and VII on Firm Ground in 10, 50, and 100 Years (Selected Communities)
| Community | P[MMl ≥ V] (%) in: | P[MMl ≥ Vl] (%) in: | P[MMl ≥ Vll] (%) in: | ||||||
| 10 years | 50 years | 100 years | 10 years | 50 years | 100 years | 10 years | 50 years | 100 years | |
| Vancouver | 26 | 77 | 95 | 8.6 | 36 | 60 | 2.5 | 12 | 22 |
| Victoria | 35 | 88 | 99 | 14 | 53 | 78 | 4.5 | 21 | 37 |
| Kamloops | 3.5 | 16 | 30 | 0.44 | 2.2 | 4.3 | 0.061 | 0.31 | 0.61 |
| Prince George | 0.89 | 4.4 | 8.6 | 0.079 | 0.40 | 0.79 | 0.012 | 0.058 | 0.12 |
| Fort St. John | 0.33 | 1.6 | 3.2 | 0.017 | 0.083 | 0.17 | 0.001 | 0.006 | 0.012 |
| Prince Rupert | 8.5 | 36 | 59 | 0.97 | 4.7 | 9.3 | 0.12 | 0.59 | 1.2 |
| Fernie | 2.2 | 11 | 20 | 0.39 | 1.9 | 3.8 | 0.064 | 0.32 | 0.64 |
| Sandspit | 35 | 88 | 99 | 7.4 | 32 | 54 | 1.2 | 5.7 | 11 |
| Smith River | 11 | 43 | 67 | 2.2 | 11 | 20 | 0.39 | 1.9 | 3.8 |
| Ocean Falls | 6.3 | 28 | 48 | 0.68 | 3.4 | 6.6 | 0.11 | 0.53 | 1.1 |
Source: Probabilities Of Significant Earthquake Shaking In Communities Across British Columbia: Implications For Emergency Management, 1627 - 2010, (Natural Resources Canada, 2010), <ftp://seismo.nrcan.gc.ca/pub/hazardpubs/13WCEEp1065Onur_Seemann.pdf> (11 March 2012).
Use the information from the map and table to answer the following questions.
-
- Which type of Modified Mercalli Intensity (MMI) scale effect level is the most common? Explain.
- Explain the relationship between the earthquake occurrences map and the earthquake probability map.
-
- Which location is the most prone to earthquakes? Explain.
- Which location is the least prone to earthquakes? Explain.
- What happens to the probability of an earthquake being felt as the number of years increase between earthquakes? Explain why this happens.
-
- How many earthquake effects of MMI VII or greater do you predict will be felt in Vancouver in the next 1000 years? Explain your thinking.
- How many earthquakes of MMI VII or greater will be felt in Fort St. John in the next 1 000 000 years? Explain your thinking.
- Suppose two earthquakes of MMI V had been felt in Quebec City in the last decade. Explain whether or not it is reasonable to assume the next decade will include two earthquakes of similar size.
- Suppose an insurance company is planning to sell earthquake insurance in British Columbia. The rate the company will charge is to be based on the risk of the client. That is, if the company expects to pay the client more over a long period, the client will be charged more.
- Which area do you expect to have the least expensive earthquake insurance? Explain.
- Which area do you expect to have the most expensive earthquake insurance? Explain.
![]() Save your responses in your course folder.
Save your responses in your course folder.
Share 1
With a partner or in a group, share your responses to the Try This questions. Then answer the following questions with your partner or group.
-
- The British Columbia earthquake probability table shows the probability that one or more earthquakes of a given size will occur. This means more than one earthquake of a given size can occur in the time period. Does this information change your estimate from question 4.a.? If so, explain how.
- Question 4.b. asked you to predict the number of earthquakes in Fort St. John for 1 000 000 years. Explain why this may not be a sound prediction.
-
- How do you expect an emergency management organization would use the earthquake data to help make decisions?
- What other organizations would find this information useful? How might they use it?
- Earthquake probabilities are one factor an insurance company may consider when determining rates. Describe some other factors.
1.2. Explore
Module 1: Probability
Explore

David De Lossy/Photodisc/Thinkstock
In Discover you saw that insurance companies can use probability to help determine how much money to charge for insurance. In fact, insurance companies rely heavily on probability. A different example of this can be seen in vehicle insurance. Data has shown that the probability is greater that a teenage driver will be in a vehicular accident than for an adult driver over the age of 25. As a result, an insurance company will have higher insurance premiums for teenage drivers because it is “more likely” that the teenage driver will get into an accident, resulting in the insurance company having to pay out.
Another common use of probability is in the manufacturing industry. Both the manufacturer and the consumer can use this information to help make decisions. The next Try This activity explores some smartphone probabilities.
1.3. Explore 2
Module 1: Probability
Try This 2

Photos.com/Thinkstock
You want to buy a new smartphone, but you’re not sure what brand to buy. You are interested in specific features, but you are also interested in reliability. Some of your friends say that the iPhone is the best product, but others insist the Blackberry is the way to go.
How can you find out about the reliability of a variety of phones? There are many consumer organizations that test consumer products. Their websites would be a good place to start.
In November 2011, failure rates of over 50 000 smartphones were analyzed by a warranty company. The reported 12-month malfunction rates for a variety of phones are shown in the following table.
| Brand of Smartphone |
12-Month Malfunction Rate |
| iPhone 4 | 2.1% |
| iPhone 3GS | 2.3% |
| Motorola | 2.3% |
| HTC | 3.7% |
| Blackberry | 6.3% |
| Other Smartphones | 6.7% |
Source: Smart Phone reliability: Apple iPhones with fewest failures, and major Android manufacturers not far behind.
<http://www.squaretrade.com/pages/cell-phone-comparisonstudy-nov-10>; (11 March 2012).
From the table, you can say the probability that an iPhone 4 will malfunction in the first year is 2.1%. You could also say that the odds of it malfunctioning in the first year are 2.1%:97.9%.
- Add a column to the previous table to show the odds of each phone malfunctioning in the first year.
Brand of
Smartphone12-Month
Malfunction RateOdds of
Phone Malfunctioning - Research another website that has analyzed the failure rate of smartphones. Prepare a table similar to question 1 for the information you find. If the failure rates differ from the previous ones, can you suggest a reason for this?
Another consideration in buying a new phone may be its ability to survive accidents such as falls. The following table gives the reported accident rate after 12 months for the same phones as in the previous table.
| Brand of Smartphone |
Reported Accident Rate after 12 Months |
| iPhone 4 | 13.8% |
| iPhone 3GS | 9.4% |
| Motorola | 12.2% |
| HTC | 12.2% |
| Blackberry | 6.7% |
| Other Smartphones | 10.2% |
Source: Smart Phone reliability: Apple iPhones with fewest failures, and major Android manufacturers not far behind. <http://www.squaretrade.com/pages/cell-phone-comparisonstudy-nov-10>; (11 March 2012).
- Create a new table with the accident rate for each phone expressed as a percent, decimal, and fraction. Add a column with the accident rate expressed as the odds of an accident in the first year.
-
For each phone, add the malfunction rate to the accident rate to determine the overall failure rates after 12 months. Next, give the odds of the phone failing in the first year.
- Given the information you have about a variety of smartphones, which one would you buy? Justify your selection.
![]() Save your responses in your course folder.
Save your responses in your course folder.
Share 2
With a partner or in a group, share your responses to the Try This 2 questions. Answer the following questions with your partner or group.
- Beyond failure rates, what other information would you consider before buying a smartphone?
- The malfunction and accident rates from Try This 2 were collected by a warranty company.
- How do you suppose the warranty company would use this information?
- The malfunction and accident rates were collected by counting only those reported to the warranty company. Do you expect the true rates to be higher or lower than these? Explain.
1.4. Explore 3
Module 1: Probability
Warranty companies rely heavily on probability. The company will try to balance the length of the warranty with the cost of replacing products due to product failure. The longer the warranty, the happier a customer will be, but the more likely the product will need to be replaced during the warranty period.
In the next Self-Check you will look at a different example of how probability data can be interpreted to answer questions.
Self-Check 1
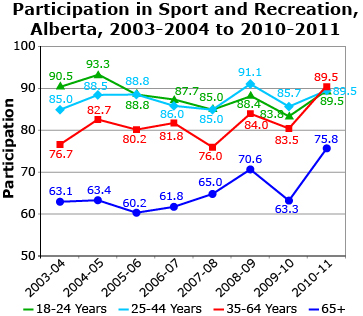
Alberta Tourism, Parks and Recreation: Tourism, Parks and Recreation, Survey of Albertans, 2003-2004 to 2010-2011.
<https://osi.alberta.ca/osicontent/Pages/Factsheets/ParticipationinSportandRecreation,Alberta.aspx>; (13 March 2012).
Use the information from the graph to answer the following questions.
- What is the probability that an Albertan senior (65+) participated in sport and recreation in the 2006–2007 year? Answer
- Determine the odds against a 28-year-old Albertan participating in sport and recreation in 2009–2010. Answer
- In 2006–2007 there were nearly 300 000 Albertans between 18 and 24. How many do you expect participated in sport and recreation? Answer
- Which age group is most likely to participate in sports and recreation? Explain. Answer
In Try This 2 you used probability to determine the best smartphone to buy. In Try This 3 you will use odds and probability to help interpret information about the CN Tower and to determine when to plan a trip to Toronto.
Try This 3

© Elenathewise/10709072/Fotolia
The CN Tower in Toronto was the tallest structure in the world when it was built, and is still the world�s tallest tower. It was designed to withstand lightning strikes, winds up to 418 km/h, and earthquakes up to 8.5 on the Richter scale.
-
- The CN Tower is struck by lightning about 75 times per year. Using this information, determine the odds for the tower being struck by lightning today.
- Are the odds you determined in question 1.a. reasonable? What assumptions did you make? Explain.
- During one thunderstorm, the tower was struck by lightning 24 times in 100 minutes. If you watched a one-minute video of the storm, what are the odds against you seeing lightning hit the tower?
- Are the odds you determined in question 1.c. reasonable? What assumptions did you make? Explain.
- Explain which set of odds, the yearly rate or the odds from a specific storm, better represent the likelihood of the CN Tower being struck by lightning?
- Suppose you are planning a trip to Toronto to visit the CN Tower. You hope to go on a day that it is not raining or snowing, so you can see a long distance from the observation deck. Consider the following table from Environment Canada.
Average Days of Precipitation Per Year for Toronto |
|||||||||||||
| Jan | Feb | Mar | Apr | May | Jun | Jul | Aug | Sep | Oct | Nov | Dec | Year | |
Days with Rainfall: |
|||||||||||||
| ≥ 0.2 mm | 5.2 | 4.6 | 8 | 10.9 | 12.2 | 11.1 | 10.3 | 10.5 | 10.6 | 11.4 | 10.6 | 7.4 | 112.8 |
| ≥ 5 mm | 1.8 | 1.7 | 2.8 | 4.2 | 4.7 | 4.5 | 4.1 | 4.4 | 4.7 | 4.2 | 4.3 | 2.7 | 44.1 |
| ≥ 10 mm | 1 | 0.87 | 1.4 | 2 | 2.5 | 2.6 | 2.4 | 2.4 | 3 | 2.1 | 2.2 | 1.4 | 23.7 |
| ≥ 25 mm | 0.17 | 0.07 | 0.13 | 0.33 | 0.37 | 0.47 | 0.43 | 0.80 | 0.67 | 0.27 | 0.33 | 0.20 | 4.2 |
Day with Snowfall: |
|||||||||||||
| ≥ 0.2 cm | 12 | 8.7 | 6.4 | 2.2 | 0 | 0 | 0 | 0 | 0 | 0.07 | 3.2 | 9.5 | 42 |
| ≥ 5 cm | 2.6 | 1.7 | 1.5 | 0.40 | 0 | 0 | 0 | 0 | 0 | 0 | 0.43 | 2.3 | 9 |
| ≥ 10 cm | 0.90 | 0.57 | 0.57 | 0.20 | 0 | 0 | 0 | 0 | 0 | 0 | 0.17 | 0.67 | 3.1 |
| ≥ 25 cm | 0.07 | 0 | 0 | 0 | 0 | 0 | 0 | 0 | 0 | 0 | 0 | 0.03 | 0.10 |
Day with Precipitation: |
|||||||||||||
| ≥ 0.2 mm | 15.3 | 11.7 | 12.7 | 12.1 | 12.2 | 11.1 | 10.3 | 10.5 | 10.6 | 11.4 | 12.7 | 14.5 | 145 |
| ≥ 5 mm | 4 | 3.2 | 4.3 | 4.7 | 4.7 | 4.5 | 4.1 | 4.4 | 4.7 | 4.2 | 5 | 4.5 | 52.3 |
| ≥ 10 mm | 1.7 | 1.4 | 2.1 | 2.3 | 2.5 | 2.6 | 2.4 | 2.4 | 3 | 2.1 | 2.4 | 2.2 | 27 |
| ≥ 25 mm | 0.23 | 0.13 | 0.27 | 0.33 | 0.37 | 0.47 | 0.43 | 0.80 | 0.67 | 0.27 | 0.33 | 0.30 | 4.6 |
Source: Canadian Climate Normals 1971-2000, (Environment Canada, 2011), < http://climate.weatheroffice.gc.ca> (09 March 2012).
-
What are the odds for precipitation in Toronto for any given day?
-
What are the odds against more than 5 mm of rain in Toronto tomorrow?
-
Using the yearly amounts, what is the probability that there will be more than 25 mm of precipitation tomorrow?
-
Which month has the lowest probability of receiving precipitation? Explain.
-
Which month has the highest probability of receiving 25 mm or more of precipitation? Explain.
![]() Save your responses in your course folder.
Save your responses in your course folder.
Share 3
With a partner or in a group, share your responses to the questions from Try This 3. Then complete the following questions.
- Which month is more likely to have snow, January or February? Explain how you decided.
-
- Is consulting a weather table a good way to plan a vacation when the vacation is a week away? Explain.
- How about when the vacation is a year away? Explain.
- Odds and probability provide similar information.
- When is it preferable to use each?
- Which do you prefer to use? Explain.
1.5. Explore 4
Module 1: Probability
In Try This 3 you may have noticed that using the value of 75 lightning strikes per year to calculate the odds of lightning striking on a random day was not reasonable. One reason why this is not a good measure is that lightning is much more common during the summer months than during the winter. Also, lightning may strike multiple times on some days; therefore, there will be fewer than 75 days per year that lightning occurs.
Weather information resembling that in the previous table, “Average Days of Precipitation Per Year for Toronto,” is useful for long-term predictions. However, a weather forecast would likely provide better information for the immediate future.
Self-Check 2
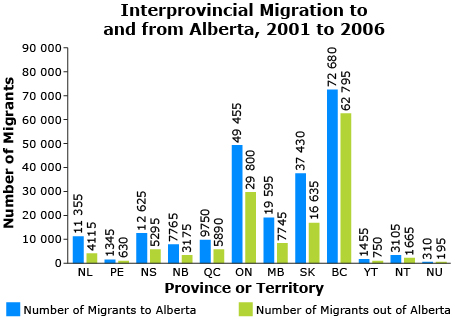
Source: 2001 Census of Canada and 2006 Census of Canada, (Statistics Canada, 2001 and 2006), < http://www12.statcan.ca> (11 March 2012).
© Iryna Volina/18675311/Fotolia
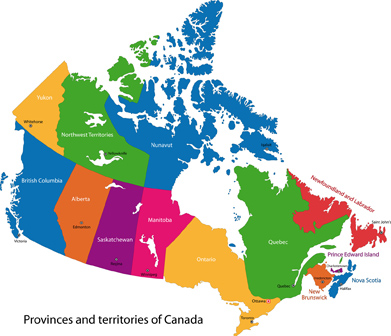
Use the information from the map and the graph to complete the following questions. Open “Map of Provinces and territories of Canada” to see a larger version of the map.
- A person migrated between Alberta and Ontario in 2004. What are the odds that she moved from Alberta to Ontario? Answer
- A Canadian from outside Alberta migrated to Alberta. What is the probability that he was from Newfoundland? Answer
- Suppose 472 people moved out of Alberta today. How many of these do you expect moved to British Columbia? Answer
- Explain whether or not it is reasonable to use the table with information from 2001–2006 to make predictions for today. Answer
1.6. Connect
Module 1: Probability
Complete the Lesson 4 Assignment that you saved in your course folder at the beginning of the lesson. Show work to support your answers.
![]() Save your responses in your course folder.
Save your responses in your course folder.
Project Connection
You are now ready to complete the final part of Module 1 Project: Applying Probability in a Business. Go to Module 1 Project, and complete Part 3: Conclusion.
As this is the final part of your project, be sure you review the checklist and the rubric to ensure that you have completed all parts of the project to the best of your ability. When finished, submit your final project to your teacher.
![]() Save your responses in your course folder.
Save your responses in your course folder.
1.7. Lesson 4 Summary
Module 1: Probability
Lesson 4 Summary
In this lesson you looked at how probability and odds can be used to help both businesses and individuals make decisions. Probability and odds are typically used when you want to predict what will happen based on past occurrences, or when you want to predict information about a large number of objects when you know information about some of the objects.
When using probability and odds, it is important to consider where the information came from and when its use is reasonable.