Lesson 4
| Site: | MoodleHUB.ca 🍁 |
| Course: | Math 30-3 SS |
| Book: | Lesson 4 |
| Printed by: | Guest user |
| Date: | Saturday, 1 November 2025, 10:45 PM |
Description
Created by IMSreader
1. Lesson 4
Module 3: Algebra
Lesson 4: Applying Linear Relations and Solving Problems
iStockphoto/Thinkstock
Focus
Linear relations are common in your life; you just have to be aware of these relationships.
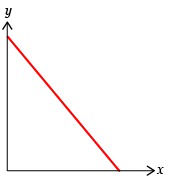
Can you think of a set of labels and a scenario to match the graph shown? How many scenarios can you think of that this graph could be used for? What is similar about all of the scenarios you came up with?
Lesson Outcome
At the end of this lesson you will be able to solve problems involving linear relations.
Lesson Questions
You will investigate the following questions:
- How do linear relations connect with the workplace?
- What applications involve linear relations?
Assessment
Your assessment may be based on a combination of the following tasks:
- completion of the Lesson 4 Assignment (Download the Lesson 4 Assignment and save it in your course folder now.)
- course folder submissions from Try This and Share activities
Materials and Equipment
You will need
- ruler or straight edge
- Grid Paper Template
- calculator
1.1. Discover
Module 3: Algebra
Discover
Try This 1
The fare passengers are charged for a taxi ride is based on a fixed cost plus a cost per kilometre.

Creatas/Jupiterimages/Thinkstock
In a search engine, enter “taxi fare calculator.” Select a fare calculator for your favourite city. Enter a starting location and a destination and find the total cost of the ride. Now enter another destination that leaves from the same starting location. For example, you may enter the airport as your first destination and the address of a particular hotel as your second destination.
Now determine the distance from your starting location to each of the two destinations. The fare calculator might even provide this information.
- Record your data in a table like the one shown.
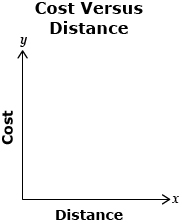
Destination Distance Total Cost of Fare - Graph these two points as shown in the diagram. You can graph by hand, digitally using a spreadsheet, or by using Grid Paper Template.
-
Which quantity is the independent variable? Which quantity is the dependent variable?
- What does the slope of this line represent in the context of this scenario?
- Calculate the slope.
- From the graph, estimate the y-intercept.
- What does the y-intercept represent in the context of this scenario?
- Can you represent this situation with a linear equation of the form y = mx + b? If so, what is the equation?
![]() Save your responses in your course folder.
Save your responses in your course folder.
Share 1
With a partner or in a group, share your responses to Try This 1. In your sharing session, be sure to address the following questions.
- Should your points on the graph be connected?
- Pick a distance and estimate the cost of the ride using the graph you created.
- Using the same distance, use the equation you developed to find the cost of the ride.
- Are your responses to Try This questions 3 and 4 approximately the same? Explain.
![]() Save your summarized responses in your course folder.
Save your summarized responses in your course folder.
1.2. Explore
Module 3: Algebra
Explore
© corepics/34195429/Fotolia
In Discover you probably found that the independent variable is the distance travelled by a cab, and the dependent variable is the cost of the cab ride. Your graph is a linear relation and should have resembled the following graph:
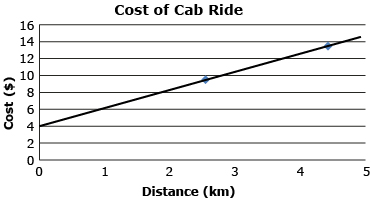
The slope of your graph represents the cost per kilometre and the y-intercept represents the fixed cost. Finding the y-intercept is an example of extrapolation. It would be an example of interpolation to estimate the cost of a 3.5-km trip from the graph.
Try This 2
Respond to “Discuss the Ideas: Forecasting Based on a Trend” questions 1 to 3 on pages 56 and 57 of the textbook.
![]() Save your responses in your course folder.
Save your responses in your course folder.
Share 2
With a partner or in a small group, discuss your responses to Try This 2 and the following question.
- Would this data be accurate for any major Canadian city?
![]() Save your responses in your course folder.
Save your responses in your course folder.
Try This 3
Pick another major Canadian city and research the average house price from 2002 to present. Start your search by entering the name of the city followed by “average house price 2002 to present” in an Internet search engine.
What changes would be made to the slope and y-intercept if a different city were considered? Explain.
![]() Save your responses in your course folder.
Save your responses in your course folder.
1.3. Explore 2
Module 3: Algebra
You have seen that the line of best fit identifies a trend in data but the line does not necessarily include all points. The situation in Self-Check 1 gives a more exact line of best fit. Now check your skills in Self-Check 1.
Self-Check 1
The amount of money spent on gas is related to the number of litres purchased. The following chart shows amounts of gas purchased.
Litres (L) |
10 | 20 | 30 | 40 | 50 |
Cost ($) |
11.20 | 22.40 | 33.60 | 44.80 | 56.00 |
- Is this a direct linear relation or a partial linear relation? Explain. Answer
- Should the points be connected? Answer
- What is the cost per litre? Answer
- Determine the equation that relates the data in the relation above. Answer
From your work and checked answers in Self-Check 1, you should feel comfortable in attempting Try This 4.
Try This 4
A professional photographer charges $75 for a sitting fee and an additional $12.50 for each portrait taken.
- Find an equation that relates the total cost to the sitting fee and to the number of portraits taken.
- Using the equation, how much would it cost for 14 portraits?
- How much would it cost to get an individual portrait for each student in a graduating class of 350 people? The students will share one sitting.
- How many individual portraits are taken if the total cost is $2725 and only one sitting fee is paid?
![]() Save your responses in your course folder.
Save your responses in your course folder.
1.4. Explore 3
Module 3: Algebra
Self-Check 2 and Self-Check 3 provide extra practice for applications of linear relations. Check your skills by doing the following self-checks.
Self-Check 2
The mass of a beaker and ethanol (M) is recorded when the beaker contains varying volumes of ethanol (v). The results of the experiment are recorded in the table. The beaker can hold a maximum of 1000 mL of ethanol.
Volume of Ethanol (mL) |
0 | 50 | 100 | 150 | 200 |
Mass of Beaker and Ethanol (g) |
90 | 129 | 168 | 207 | 246 |
Measurements may be assumed to be correct to the nearest millilitre (mL) and to the nearest gram (g).
Graph the relation, and respond to the following questions.
- Assuming this pattern continues, determine the mass of the beaker and ethanol when 250 mL of ethanol is present. Answer
- What volume of ethanol is in the beaker if the total mass is 450 g? Answer
- When the volume of ethanol is 700 mL, determine the mass of the ethanol alone. Answer
- Find an equation that relates the mass of the beaker and ethanol to the volume of ethanol. Answer
Self-Check 3
A small business makes ball caps and sells the caps to stores. Each ball cap costs $5 to make. The fixed monthly costs of the business, such as rent, salaries, and insurance, are $4000. The business sells the ball caps to the stores for $15 each. An equation to represent the cost (y) of making x ball caps is y = 5x + 4000. An equation to represent the revenue (y) of selling x ball caps is y = 15x.
- Complete two tables of values similar to the tables shown.
 Answer
COST: y = 5x + 4000
Ball Caps (x) Cost (y) 0 100 200 300
REVENUE: y = 15x
Ball Caps (x) Revenue (y) 0 100 200 300
profit = revenue − cost - Calculate the profit when 600 ball caps are sold. Answer
- Calculate the profit when 150 ball caps are sold. Answer
- The break-even point is when the revenue is equal to the cost, and thus the profit is 0. Calculate the break-even point using
1.5. Connect
Module 3: Algebra
Complete the Lesson 4 Assignment that you saved in your course folder at the beginning of the lesson. Show work to support your answers.
![]() Save your responses in your course folder.
Save your responses in your course folder.
Project Connection
There is no Project Connection in this lesson.
1.6. Lesson 4 Summary
Module 3: Algebra
Lesson 4 Summary
You looked at examples and applications of linear relations. The ideas in this lesson can be applied to any scenario that involves a constant change.
When interpreting the graph of a linear relation, it is often useful to determine the slope and y-intercept. The graph of a relation and the equation itself are connected by the equation y = mx + b, where m represents the slope and b is the y-intercept.