Lesson 1
| Site: | MoodleHUB.ca 🍁 |
| Course: | Math 30-3 SS |
| Book: | Lesson 1 |
| Printed by: | Guest user |
| Date: | Friday, 19 December 2025, 5:42 PM |
Description
Created by IMSreader
1. Lesson 1
Module 4: Statistics
Lesson 1: Mean, Median, and Mode
Focus

Courtesy of and © Canadian Institute of Extreme Racing
(canadiandeathrace.com), a non-profit society.
The Canadian Death Race takes place yearly in Grande Cache, Alberta. The racers are allowed to compete alone or in groups of up to five. The race covers 125 km of mountain trails that include three mountain summits, which is 17 000 ft of elevation change. Runners from around the world compete, and many locals also join in the fun. The winning solo time for 2011 was 12:15:54 (12 hours, 15 minutes, and 54 seconds). Racers whose time exceeds 24 hours are disqualified.
Often when looking at a set of data, the highest or lowest value gets all the focus while the middle values are ignored. Does either the winning time or disqualification time represent a typical runner? Given a list of finishing times, how would you decide on a typical time that would represent a typical runner in the race? Could more than one time be considered typical?1
© Jacob Kjerumgaard/7600523/Fotolia
Lesson Outcomes
At the end of this lesson you will be able to
- calculate the mean, median, and mode for a set of data
- solve problems that involve measures of central tendency
Lesson Questions
You will investigate the following questions:
- How can the average be determined given a set of data?
- How can a set of data be represented with one number?
- How can data be described in different ways?
Assessment
Your assessment may be based on a combination of the following tasks:
- completion of the Lesson 1 Assignment (Download the Lesson 1 Assignment and save it in your course folder now.)
- course folder submissions from Try This and Share activities
- additions to Glossary Terms and Formula Sheet
- work under Project Connection
Self-Check activities are for your own use. You can compare your answers to suggested answers to see if you are on track. If you have difficulty with concepts or calculations, contact your teacher.
Remember that the questions and activities you will encounter provide you with the practice and feedback you need to successfully complete this course. You should complete all questions and place your responses in your course folder. Your teacher may wish to view your work to check on your progress and to see if you need help.
Materials and Equipment
You will need
- calculator
1 Canadian Death Race/Canadian Institute of Extreme Racing
1.1. Launch
Module 4: Statistics
Launch
Do you have the background knowledge and skills you need to complete this lesson successfully? Launch will help you find out.
Before beginning this lesson you should be able to
- calculate sums, differences, and quotients
- read and interpret graphs
1.2. Are You Ready?
Module 4: Statistics
Are You Ready?
Complete these questions. If you experience difficulty and need help, visit Refresher or contact your teacher.
- The graph shows the number of pets in a group of households. Look at the graph and answer the questions.
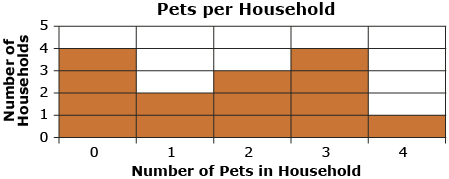
The table represents the information from the graph.
Number of Pets Number of Households 0 4 1 2 2 3 4
Did you realize that there are two common ways of ordering data—ascending and descending? Review the definitions for Ascending and Descending.

- From the information in question 1, answer these questions.
- How many households have four pets? Answer
- What is the difference between the number of households with 3 pets and the number of households with 4 pets? Answer
- When shopping for pet gifts, the households with 4 pets must buy how many times greater the number of gifts than the households with only 1 pet? Answer
If you answered the Are You Ready? questions without difficulty, move to Discover. If you found the Are You Ready? questions difficult, complete Refresher.
1.3. Refresher
Module 4: Statistics
Refresher
The Interpreting Graphs interactive will help refresh your knowledge and understanding of graphs.
Go back to the Are You Ready? section and try the questions again. If you are still having difficulty, contact your teacher.
1.4. Discover
Module 4: Statistics
Discover
Read the cartoon and then answer the questions that follow in Try This 1.
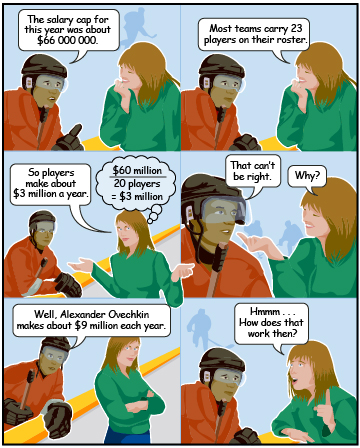
Try This 1
- If the Edmonton Oilers carry a roster of 21 players in this hockey season, then what would the average player’s salary be? Explain how you determined the amount.
- Do all the hockey players earn the same amount? Are there players who earn more or less than the average salary? Explain.
![]() Save your responses in your course folder.
Save your responses in your course folder.
Share 1
Discuss your findings with a partner or classmate and answer these questions.
- Discuss what is meant by the “average salary” of an NHL player.
- Did you and your partner calculate a similar value for “average salary”?
- Did you and your partner use a similar method to come to a solution? Discuss your strategies and explain how your methods are the same and/or different.
![]() If required, place a summary of your discussion in your course folder.
If required, place a summary of your discussion in your course folder.
1.5. Explore
Module 4: Statistics

Ingram Publishing/Thinkstock
Explore
In Discover you were introduced to the concept of average. The concept of average is connected to the measures of central tendency. Central tendency refers to the “middle” of a set of data and is commonly measured by the arithmetic mean, median, and mode. In this lesson you will explore how each of these measures of central tendency is calculated and how each can be used to describe the average of a set of data.
When people think of “average,” they usually think of the measure that is correctly known as the arithmetic mean. To determine the arithmetic mean, find the sum of all the data values and divide the sum by the number of values.
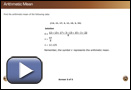
For an example of this calculation, view the Arithmetic Mean interactive.
For this module, arithmetic mean will be referred to as “mean.”
Calculator Keystrokes Hint: A common mistake made when calculating the mean is to forget to press the equal sign before the divide key. This will result in an incorrect solution, as shown.
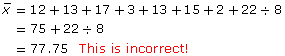
The table displays the correct sequence.
Steps |
Example |
|
12 + 13 + 17 + 3 + 13 + 15 + 2 + 22 |
|
= 97 |
|
8 |
|
97 ÷ 8 |
= 12.125 |
Self-Check 1
- What is the mean of the data set {9, 16, 10, 32, 7, 16}? Answer
- If the mean of a set of numbers is 55, which of the following could be true?
- All the numbers in the set could equal 55.
- When all the numbers are added and then divided by the number of values, the result is 55.
- Some numbers could be over 75.
- All of the above.
Answer
Share 2
Refer back to the hockey players’ salary discussion in Discover and answer these questions.
- Would you expect half of the players’ salaries to be above the average salary and half of the players’ salaries to be below the average salary?
- Given the data {10, 11, 13, 17, 21}, find the middle value.
- Given the data {10, 11, 13, 15, 17, 21}, find the middle value.
Consider your findings and share your answers with a partner.
1.6. Explore 2
Module 4: Statistics
So far in this lesson, you have explored how the arithmetic mean can represent the average of a set of data. Now it's time to explore two other common measures of central tendency—the median and the mode. These measurements can also be used to describe a set of numbers using a single value.

Ingram Publishing/Thinkstock
Median is the middle or midpoint value of a set of numbers when arranged in order.
In the mountain range shown, which peak represents the median?
iStockphoto/Thinkstock/Coin image© 2012 Royal
Canadian Mint – All Rights Reserved
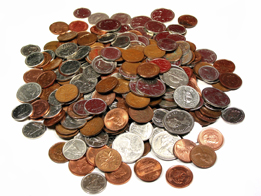
Mode is the value that occurs most often in the given set of data.
In the pile of coins shown, which type of coin represents the mode?
In Try This 2 you will use the ideas of mean, median, and mode on a set of numbers.
Try This 2
Use the Random Number Generator to generate 15 random numbers. Record the numbers and calculate the mean, median, and mode.
Then generate 20 random numbers and calculate the mean, median, and mode of those numbers.
In your course folder, record the process or steps you used to determine each measure of central tendency—mean, median, and mode. If you had any questions about the activity, write them down. Keep your work handy as you will be referring back to it shortly.
1.7. Explore 3
Module 4: Statistics
Self-Check 2

Comstock/Jupiterimages/Thinkstock
Check your understanding of mode and median by selecting the best response for questions 1 to 3 based on what you did in Try This 2. Be sure to read the feedback provided when you check your answers. In question 4, attempt to explain each question and then check your answer.
- What did you do with numbers that repeated themselves? Do you include the numbers in the list multiple times when ordering them from smallest to largest, or simply discard them?
- Leave repeated numbers in the list.
- Discard repeated numbers.
- When calculating the mode, did you have values that repeated themselves the same number of times? How does this affect the mode?
- There is no mode.
- There is more than one mode.
- In the case of finding the mode, what happens if none of the data values repeat themselves?
- There is no mode.
- There is more than one mode.
- When you generated the list of 15 numbers, it was probably easier to find the median (middle point) than it was with the list of 20 numbers.
From Try This 2, you hopefully discovered the following information about median:
- The middle number is the median if the ordered data has an odd number of elements.
- The average (arithmetic mean) of the two middle numbers is the median if the ordered data has an even number of elements.
From Try This 2, you hopefully discovered the following information about mode:
- If each value occurs once, then there is no mode. If two or more values appear the same number of times, and this is the greatest number of occurrences in the data set, then they are all considered modes.
Self-Check 3
Determine the mean, median, and mode of each of the following sets of data.
1.8. Explore 4
Module 4: Statistics
Try This 3
- What are the similarities and differences between mean, median, and mode?
- Can all three measures be represented by the same number?
- Create a set of five numbers that have the same mean, median, and mode.
![]() Save your responses in your course folder.
Save your responses in your course folder.
Share 3
With a partner or in a group, share your answers from Try This 3. Now consider the following:
- Referring back to the hockey players’ salary discussion in Discover, would you expect to find that some of the players make the same amount?
![]() If required, place a summary of your discussion in your course folder.
If required, place a summary of your discussion in your course folder.
1.9. Explore 5
Module 4: Statistics
Share 4
Use the information that you've learned and the following table of data to determine the mean, median, and mode for the salaries of the Washington Capitals.

Digital Vision/Thinkstock
2011 Salaries of Washington Capitals |
|
Alexander Ovechkin |
$9 000 000 |
Alexander Semin |
$6 700 000 |
Brooks Laich |
$6 500 000 |
Nicklas Backstrom |
$6 000 000 |
Mike Green |
$5 000 000 |
Dennis Wideman |
$4 500 000 |
Roman Hamrlik |
$3 500 000 |
Joel Ward |
$3 000 000 |
Tom Poti |
$3 000 000 |
Jeff Schultz |
$2 500 000 |
Troy Brouwer |
$2 350 000 |
Eric Fehr |
$2 200 000 |
Mike Knuble |
$2 000 000 |
Jason Chimera |
$1 875 000 |
John Erskine |
$1 500 000 |
Tomas Vokoun |
$1 500 000 |
Michal Neuvirth |
$1 150 000 |
Marcus Johansson |
$900 000 |
Matt Hendricks |
$850 000 |
Jeff Halpern |
$825 000 |
John Carlson |
$787 000 |
D.J. King |
$650 000 |
Braden Holtby |
$550 000 |
Jay Beagle |
$525 000 |
Keith Aucoin |
$525 000 |
Patrick McNeill |
$525 000 |
Ryan Potulny |
$525 000 |
Once you have calculated each measure of central tendency, discuss with a partner any differences in your conclusions. What causes the mean, median, and mode to be so different?
![]() Place a summary of your discussion in your course folder.
Place a summary of your discussion in your course folder.
1.10. Explore 6
Module 4: Statistics
Self-Check 4
Answer “Build Your Skills” questions 1, 3, 5, 8, and 9 from pages 118 to 121 of the textbook. Answers
Add the following terms to your copy of Glossary Terms:
- ascending order
- descending order
- arithmetic mean
- median
- mode
1.11. Connect
Module 4: Statistics
Photodisc/Digital Vision/Thinkstock
Complete the Lesson 1 Assignment that you saved in your course folder at the beginning of the lesson. Show work to support your answers.
![]() Save your responses in your course folder.
Save your responses in your course folder.
Project Connection
You are ready to start working on Module 4 Project: Recycling Used Beverage Containers. Go to the Module 4 Project and read over all project requirements. Become familiar with what you will be doing and how you will be assessed.
There is also a working project document where you will complete and save all parts of your project. Download the Student Project Document to your course folder now.
Your Module 4 Project will be evaluated by your teacher using the evaluation guidelines in the Project Rubric. Read the rubric carefully. Make sure you are aware of how you will be assessed. You can print or save a digital copy of the rubric.
Complete Part 1: Collection and Part 2: Calculate the Measures of Central Tendency of Module 4 Project: Recycling Used Beverage Containers.
![]() Save your responses in the Student Project Document in your course folder.
Save your responses in the Student Project Document in your course folder.
1.12. Lesson 1 Summary
Module 4: Statistics
Lesson 1 Summary
In this lesson you investigated the following questions:
- How can an average be determined given a set of data?
- How can a set of data be represented with one number?
- How can data be described in different ways?
Through the Discover and Explore activities you learned that there are three common measures of central tendency—mean, median, and mode. These central tendencies represent the middle value of a given set of data or a typical value that represents the average. You saw this in the examples of hockey player salaries where you learned how to calculate each measure of central tendency.
Finally, you learned that the mean, median, and mode can each be used to describe the data in different ways and each is dependent on the situation. In the next lesson you will use these measures in relation to outliers.