Lesson 2
| Site: | MoodleHUB.ca 🍁 |
| Course: | Math 30-3 SS |
| Book: | Lesson 2 |
| Printed by: | Guest user |
| Date: | Friday, 19 December 2025, 6:08 PM |
Description
Created by IMSreader
1. Lesson 2
Module 4: Statistics
Lesson 2: Outliers
Focus

Digital Vision/Thinkstock
Many people aspire to be actors. If you think of actors such as Johnny Depp, who grossed $100 million in 2010, and Angelina Jolie, who grossed $23.5 million in 2010, it sounds like a great career idea.
Consider though that most actors must take a second job to maintain a reasonable standard of living and act more for the passion than for the money. Therefore, using the salaries of the top grossing actors as representative of the industry may be flawed. How would you decide what the typical actor makes?
Lesson Outcomes
At the end of this lesson you will be able to
- identify the outliers in a set of data
- explain the effects of outliers on mean, median, and mode
- calculate the trimmed mean for a set of data and justify the removal of the outliers
Lesson Questions
You will investigate the following questions:
- Why might outlying values exist in a data set, and when should they be removed?
- How do outlying values impact the central tendency of a data set?
- How can data that contains outlying values be interpreted?
Assessment
Your assessment may be based on a combination of the following tasks:
- completion of the Lesson 2 Assignment (Download the Lesson 2 Assignment and save it in your course folder now.)
- course folder submissions from Try This and Share activities
- additions to Glossary Terms
- work under Project Connection
Materials and Equipment
You will need
- calculator
1.1. Discover
Module 4: Statistics

Hemera/Thinkstock
Discover
Sometimes a set of data includes a value that is much different than the rest. In the following activity you will explore how mean, median, and mode can be affected by one of these values.
Try This 1
The table shows the average housing costs in some major cities in Canada. Use this information to answer the questions.
City |
Average Housing Prices ($1000) |
St. John |
168 |
Winnipeg |
243 |
Halifax |
269 |
Saskatoon |
310 |
Montréal |
324 |
Edmonton |
329 |
Vancouver |
809 |
Source: The Canadian Real Estate Association <http://www.crea.ca/public/news_stats/statistics.htm>;
- Estimate the typical average cost of a house in Canada.
- Is there a city (or cities) whose average house price is not similar to the others?
- What factors may influence the difference in the average price of a house from city to city?
![]() Save your responses in your course folder.
Save your responses in your course folder.
Share 1
Share your findings with a partner and answer these questions.
- Which measure of central tendency (mean, median, or mode) would be most affected by one or more piece(s) of data?
- What should be done with data that does not align with the rest?
![]() If required, place a summary of your discussion in your course folder.
If required, place a summary of your discussion in your course folder.
1.2. Explore
Module 4: Statistics
Explore
In Discover you may have noticed that Vancouver’s average housing cost is much greater than the other listed averages. In the next activity, you will use the methods of calculating the mean, median, and mode learned in the last lesson to determine how each is changed by including or excluding Vancouver in your calculation.
Self-Check 1
Use the data from the table to respond to the questions.
City |
Average Housing Prices ($1000) |
St. John |
168 |
Winnipeg |
243 |
Halifax |
269 |
Saskatoon |
310 |
Montréal |
324 |
Edmonton |
329 |
Vancouver |
809 |
Source: The Canadian Real Estate Association <http://www.crea.ca/public/news_stats/statistics.htm>;
You can use a table like the following for your responses.
|
Mean |
Median |
All Cities |
|
|
All Cities Excluding Vancouver |
|
|
- In Discover you were asked to estimate the average cost of a house in Canada. How does your calculation of each mean in the table of data compare to your estimate? Answer
- Which of the two calculated means better represents the data? Provide an explanation to support your choice. Answer
- Which of the two central tendencies, mean or median, was more affected by excluding Vancouver’s data from your calculations? Provide evidence to support your response. Answer
1.3. Explore 2
Module 4: Statistics

Hemera/Thinkstock
As you completed Self-Check 1, you may have noticed that Vancouver’s average housing price greatly influenced the mean, causing Canada’s average housing cost to be higher. However, it may have had little influence on the median.
Vancouver’s data is an example of an outlier. As you learned in Module 3, an outlier is a data point that is significantly different from the other data. If you were to graph the data, you would notice that an outlier would lie “outside” the other data.
outlier: a data point that lies significantly outside the general trend of the data
Source: MathWorks 12 Student Book/Teacher Guide.
(Vancouver: Pacific Educational Press, 2011.)
Self-Check 2
In each set of data, identify the outlier(s), if any, and justify why they are outliers.
- 7, 24, 24, 28, 31, 35 Answer
- Use the data from the bar graph.
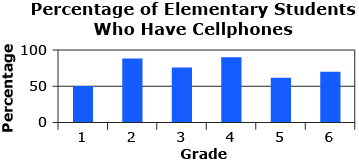
Answer - Use the data from the graph.
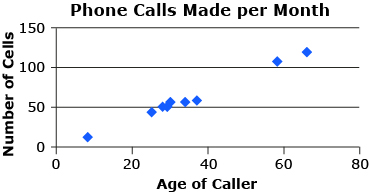
Answer
Try This 2
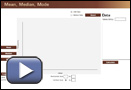
Use the Mean, Median, Mode activity to explore the effect of outliers on mean, median, and mode.

Use this table of data sets to answer the following questions.
Data Set 1 |
20, 22, 22, 25, 26 |
Data Set 2 |
20, 22, 22, 25, 26, 40 |
Data Set 3 |
20, 22, 22, 25, 26, 100 |
- Find the mean, median, and mode for each data set using the Mean, Median, Mode interactive. Record your solutions in a table similar to the following.
Central Tendency Measure
Mean
Median
Mode
Data Set 1
Data Set 2
Data Set 3
- Rank mean, median, and mode from the least to most affected by adding one outlier to Data Set 1.
![]() Save your responses in your course folder.
Save your responses in your course folder.
Share 1
With a partner or in a group, share your answers to Try This 2. If you have answers that differ, share strategies and try to make corrections. If you can’t agree on an answer, consult your teacher.
![]() If required, place a summary of your discussion in your course folder.
If required, place a summary of your discussion in your course folder.
1.4. Explore 3
Module 4: Statistics

Comstock/Thinkstock
In Try This 2 you saw that the mode did not change with the addition of outliers. This will be the case with most data you work with. The median, however, may change slightly when one outlier is added.
The mean is most affected by outliers. In Try This 2 you saw that the mean was above most of the data points. This is because the outlier is in a sense “pulling” the mean towards it, which causes the data to be skewed upward. That would be the same for the salaries of movie stars. The salaries of the most popular or famous movie stars would skew the average upward.
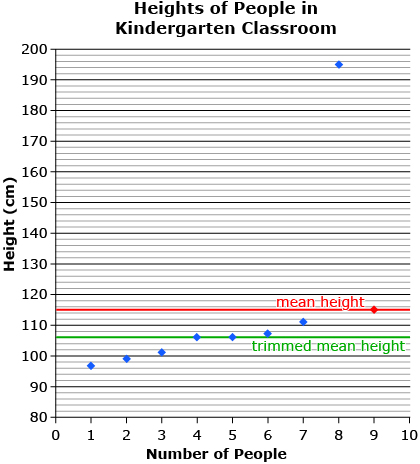
Leaving all data points in the calculation of mean may result in a value that is not representative of the data set. For example, suppose you were to measure the heights of all people in a kindergarten class, including the teacher. The mean calculated from this data set will likely be larger than all the students, yet smaller than the teacher. Therefore, the calculated mean would not accurately represent the average height of the kindergarten class.
trimmed mean: the mean calculated by disregarding an equal number of data points from both ends of the range
Source: MathWorks 12 Student Book/Teacher Guide. (Vancouver:Pacific Educational Press, 2011.)
A trimmed mean is the mean calculated by ignoring an equal number of data points from either end of the range. For example, calculating the trimmed mean for the height of people in the kindergarten class would require removing the tallest and the smallest heights from the data. When calculating mean in any given circumstance, you must consider the context of the question and give reasons for why you decide to trim or not to trim your data.
Here is an example that shows when outlying data may be included in your calculations.
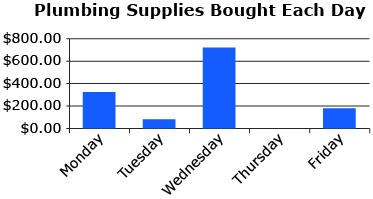
Suppose Alberta, a plumber, wants to estimate her weekly cost for supplies. She records and graphs her purchase totals each day for a week. Notice that Alberta’s total purchases on Wednesdayresult in a distinct outlier. If Alberta excluded this data point from her estimate, the result would be an estimate that is not really reflective of the average weekly costs. In this example, it is important that all data points be used in calculating the mean, which results in a better estimate of weekly costs.
Try This 3
Find the mean and trimmed mean for each data set using the Mean, Median, Mode interactive.
Use this table of data sets to answer the following questions.
Data Set 1 |
20, 22, 22, 25, 26 |
Data Set 2 |
20, 22, 22, 25, 26, 40 |
Data Set 3 |
20, 22, 22, 25, 26, 100 |
Record your solutions in a table similar to the following.
Central Tendency Measure |
Mean |
Trimmed Mean with Two Omitted Points |
Data Set 1 |
|
|
Data Set 2 |
|
|
Data Set 3 |
|
|
- Which data set has the biggest difference between mean and trimmed mean?
- Does the mean or the trimmed mean best represent the data set?
Share 2
Consider your findings and share your answers with a partner.
![]() If required, place a summary of your discussion in your course folder.
If required, place a summary of your discussion in your course folder.
1.5. Explore 4
Module 4: Statistics
Self-Check 3
Go to pages 130 to 131 of your textbook and answer “Build Your Skills” questions 1 and 2. Go to page 132 and answer “Extend Your Thinking” question 10. Show each step in your calculations. Answers
Add the following terms to your copy of Glossary Terms:
- outlier (if not added in Module 3)
- trimmed mean
1.6. Connect
Module 4: Statistics
Complete the Lesson 2 Assignment that you saved in your course folder at the beginning of the lesson. Show work to support your answers.
![]() Save your responses in your course folder.
Save your responses in your course folder.
Project Connection
You are now ready to apply your understanding of outliers and trimmed mean to Module 4 Project: Recycling Used Beverage Containers. Go to the Module 4 Project and complete Part 3: Outliers and Trimmed Mean.
![]() Save your responses in the Student Project Document in your course folder.
Save your responses in the Student Project Document in your course folder.
1.7. Lesson 2 Summary
Module 4: Statistics
Lesson 2 Summary

Stockbyte/Thinkstock
In this lesson you investigated the following questions:
- Why might outlying values exist in a data set, and when should they be removed?
- How do outlying values impact the central tendency of a data set?
- How can data that contains outlying values be interpreted?
Through Discover and Explore activities, you learned that if outliers exist in a data set, they can have a significant effect on the mean but little effect on the median and mode. If the outlying point is significantly higher than the rest of the data, then the mean is skewed upward. If the outlying point is significantly lower than the rest of the data points, then the mean is skewed downward. In either case, the outlying data can lead to misinterpretation of data.
Be careful when deciding to remove or trim data when calculating the mean. By removing the outliers, you are influencing the purity of the data. Trimming the data should only be done for a good reason. If you trim data, you should always be able to explain what you are doing and why it makes sense to do so.