Lesson 3
| Site: | MoodleHUB.ca 🍁 |
| Course: | Math 30-3 SS |
| Book: | Lesson 3 |
| Printed by: | Guest user |
| Date: | Monday, 15 September 2025, 11:58 AM |
Description
Created by IMSreader
1. Lesson 3
Module 4: Statistics
Lesson 3: Weighted Means
Focus

iStockphoto/Thinkstock
In July 2011, Alberta was the leading beef producing province in Canada with 40% of all cattle. Before cattle are sold, they are graded using Canadian Beef Grading Standards to ensure consistency and high quality of the beef for eating and retail appearance.
What characteristics of cattle do you think a buyer would find important? Are all of the characteristics equally important? How can a scoring system account for some qualities being more important than others?
Lesson Outcomes
At the end of this lesson you will be able to
- calculate the mean of a set of numbers after allowing the data to have different weightings
- explain why some data in a set would be given greater weighting in determining the mean
- solve problems that involve weighted mean
Lesson Questions
You will investigate the following questions:
- When is a weighted mean used?
- When are some data values worth more than others?
- How do you determine a weighted mean?
Assessment
Your assessment may be based on a combination of the following tasks:
- completion of the Lesson 3 Assignment (Download the Lesson 3 Assignment and save it in your course folder now.)
- course folder submissions from Try This and Share activities
- additions to Glossary Terms
- work under Project Connection
Materials and Equipment
You will need
- calculator
1.1. Launch
Module 4: Statistics
Launch
Do you have the background knowledge and skills you need to complete this lesson successfully? Launch will help you find out.
Before beginning this lesson you should be able to calculate the percentage of a number.
1.2. Are You Ready?
Module 4: Statistics
Are You Ready?
Complete these questions. If you experience difficulty and need help, visit Refresher or contact your teacher.
- Determine the following percentages.
- If you spend 7 hours of each day working, what percentage of the day do you work? Answer
- If you spend $125.00 from your paycheque of $613.00, what percentage of your cheque do you spend? Answer
If you answered the Are You Ready? questions without difficulty, move to Discover.
If you found the Are You Ready? questions difficult, complete Refresher.
1.3. Refresher
Module 4: Statistics
Refresher
If you do not know the answers to the Are You Ready? questions or require more information, review Percent in the LearnAlberta Mathematics Glossary.
Go back to the Are You Ready? section and try the questions again. If you are still having difficulty, contact your teacher.
1.4. Discover
Module 4: Statistics

© Robert Kneschke/35609701/Fotolia
Discover
You have discovered that it is often useful to reduce a set of data to a single representative value, such as the mean (arithmetic or trimmed), median, or mode. As noted in Focus, beef cattle are graded on aspects such as appearance, tenderness, and fat content to give them a grade (A, AA, AAA, or prime beef). Similarly, in a classroom, various assessments may be used to give a student a final mark. Consider the following scenarios:
Scenario A
Logan, in Mr. Flynn’s class, has an average mark of 50% on his assignments, 30% on his quizzes, and 80% on his exams. His teacher has given him an overall mark of 59%.
How might the teacher have obtained this mark?

Stockbyte/Thinkstock
Scenario B
Chloe, a student in Mrs. Rand’s class, is calculating her average mark and she knows that her assignments have a weight of 20%, quizzes 20%, and exams 60%. Chloe has a mark of 70% for assignments, 80% for quizzes, and 90% for exams. Her overall mark is 84%.
How did the teacher obtain this mark?
Scenario C
Owen, a student in Mr. Grant’s class, is calculating his average mark and he knows that his assignments have a weight of 30%, quizzes 10%, and projects 60%. Owen has a mark of 50% for assignments, 80% for quizzes, and 70% for projects.
What is Owen’s overall mark?
Share 1
With a classmate, discuss the three scenarios and respond to the following questions.
- Did you and your classmate have similar responses to the scenarios?
- Did you find that the strategies you used to find the answers were similar or different from your classmate's?
![]() If required, place a summary of your discussion in your course folder.
If required, place a summary of your discussion in your course folder.
1.5. Discover 2
Module 4: Statistics
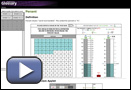
Use the Weighted Mean table to check your responses to Scenarios 1, 2, and 3. It is suggested that you start with Scenario 3, followed by Scenario 2, and then Scenario 1.
Does the table match your earlier responses?
1.6. Explore
Module 4: Statistics
Explore
In Discover you looked at calculating a final mark when the scoring categories were assigned different percent values. To calculate the overall final mark, you needed to multiply each weighting, expressed as a decimal, by the percentage score in that category. When you add the weighted scores for each category, it results in the weighted mean.
Go to Weighted Mean: Example to see a detailed example of calculating a course final mark.
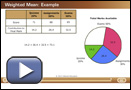
In Lesson 1 you learned about the arithmetic mean. Recall that the arithmetic mean is the sum of all data values divided by the number of data items.
For a refresher of arithmetic mean, you may want to review Lesson 1.
Share 2
With a partner or in a group, compare how arithmetic and weighted means are calculated.
- How are they the same? How do they differ?
- When would you use weighted mean instead of arithmetic mean?
![]() Save your responses in your course folder.
Save your responses in your course folder.
1.7. Explore 2
Module 4: Statistics

iStockphoto/Thinkstock
Self-Check 1
Three candidates were interviewed for a junior apprentice position with Kapoor Enterprises. They were evaluated on the following criteria: work experience (50%), education (20%), and ability to work with others (30%).
- Complete the Overall Score column of the table using weighted means. The first row has been completed for you.
AnswerCandidate
Experience (50%)
Education (20%)
Ability to Work with Others (30%)
Overall Score
(weighted mean)Jacob
10
5
2
6.6
Carter
5
5
5
Sophia
3
8
10
Based on the table, who do you believe would be the most suitable candidate? Support your decision.
- When would Jacob be the most suitable candidate? Answer
- When would Carter be the most suitable candidate? Answer
- When would Sophia be the most suitable candidate? Answer
Share 3
With a partner or in a group, share your responses to the questions in Self-Check 1 and discuss the following additional questions.
- Does the highest overall score (weighted mean) always represent the best candidate?
- When would you choose a candidate with a lower score?
![]() Save your responses in your course folder.
Save your responses in your course folder.
1.8. Explore 3
Module 4: Statistics

iStockphoto/Thinkstock
Weighted means can be used to solve problems that do not involve scores. Try to solve the following problem using weighted means. Can you think of another way to solve the problem?
Self-Check 2
- Control valves are used to regulate the flow of various fluids in industries. The company A1 Controls exports control valves to the United States, Russia, and Saudi Arabia. They ship 150 valves to the United States at $250/valve, 85 valves to Russia at $325/valve, and 210 valves to Saudi Arabia at $415/valve. What is the mean cost of shipping a valve to one of these three countries?
 Answer
Did You Know?
The First Nations began playing lacrosse more than 500 years ago. Today the sport not only remains an integral part of native culture, but is played by thousands of people across Canada. From its origin as “The Creator's Game” to the popularity of the Toronto Rock team and the modern game, lacrosse has survived the test of time after treading down a long, controversial path that led it to become recognized as Canada's official national sport.
|
Hemera/Thinkstock |

Lacrosse teams may have up to 25 players. Ten of these players can be core players. Core players have more than three years of experience and make $500/game; first-year players make $200/game; second-year players make $250/game; and third-year players make $300/game.
- A lacrosse team has 8 core players, 5 first-year players, 9 second-year players, and 3 third-year players. Calculate the weighted mean for player payment per game. Answer
- Analyze the information provided in the table. Justify why one average salary is correct and the other is not.
Department Salary Number of Employees Administration $55 000 50 Marketing $65 000 100 Engineering $75 000 4000 Senior Management $120 000 15 Top Management $1 200 000 5
Average Salary (Wrong) $303 000 Average Salary (Correct) $76 031
Answer
![]()
- Answer “Build Your Skills” questions 3 to 8 from textbook pages 131 and 132. Answer
1.9. Connect
Module 4: Statistics
Complete the Lesson 3 Assignment that you saved in your course folder at the beginning of the lesson. Show work to support your answers.
![]() Save your responses in your course folder.
Save your responses in your course folder.
Project Connection
You are now ready to apply your understanding of weighted mean to Module 4 Project: Recycling Used Beverage Containers. Go to the Module 4 Project and complete Part 4: Weighted Mean.
![]() Save your responses in the Student Project Document in your course folder.
Save your responses in the Student Project Document in your course folder.
1.10. Lesson 3 Summary
Module 4: Statistics
Lesson 3 Summary
In this lesson you investigated the following questions:
- When is a weighted mean used?
- When are some data values worth more than others?
- How do you determine a weighted mean?
Weighted means play a part in evaluation, whether it is in the classroom or workplace. Understanding the mathematics behind weighted means can also help you make decisions about costs in the workplace.