Lesson 4
| Site: | MoodleHUB.ca 🍁 |
| Course: | Math 30-3 SS |
| Book: | Lesson 4 |
| Printed by: | Guest user |
| Date: | Friday, 19 December 2025, 6:09 PM |
Description
Created by IMSreader
1. Lesson 4
Module 4: Statistics

Brand X Pictures/Thinkstock
Go to page 133 of the textbook and read “Healthy Weight and Measures of Central Tendency.” This reading will introduce you to a way of determining “average” or “healthy” weight for a person 18 years of age or older.
While reading, keep in mind the following questions:
- Why is there a need to determine the average or healthy weight for a person?
- Which measure of central tendency is closely related to the body mass index (BMI)?
What is your BMI?
Calculate your BMI using either the method in the textbook or the BMI Nomogram.
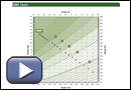
CREDIT: Health Canada. Body Mass Index Nomogram
Calculating BMI is an example of average that is slightly different from the other measures of central tendency. In this lesson you will be looking at what measures work best for any given set of data.
Lesson Outcomes
At the end of this lesson you will be able to
- explain the advantages and disadvantages of each measure of central tendency
- explain how measures of central tendency and outliers are used to provide different interpretations of data
Lesson Question
You will investigate the following question:
- Which measure of central tendency is the best for a given set of data?
Assessment
Your assessment may be based on a combination of the following tasks:
- completion of the Lesson 4 Assignment (Download the Lesson 4 Assignment and save it in your course folder now.)
- course folder submissions from Try This and Share activities
Materials and Equipment
You will need
- calculator
1.1. Discover
Module 4: Statistics

Photodisc/Thinkstock
Discover
In Focus you found your BMI. How could that number mislead someone to think that they are healthy or unhealthy? When considering the health of a person, many factors have to be considered—cholesterol levels, blood pressure, and hereditary patterns are just a few. Choosing just one number may give misconceptions of what is actually the case.
The following is a case in which it’s difficult to describe a situation with a single number.
Month |
Average Depth of Snow on Ground (in cm) |
January |
19 |
February |
21 |
March |
16 |
April |
3 |
May |
0 |
June |
0 |
July |
0 |
August |
0 |
September |
0 |
October |
1 |
November |
5 |
December |
12 |
Source: http://www.livingin-canada.com/climate-edmonton.html
Try This 1
Look at the set of data showing the monthly average depth of snow in Edmonton. Answer the following questions.
- Which measure of central tendency (mean, median, or mode) would make it appear that Edmonton often has snow on the ground?
- Which measure would make it seem like Edmonton rarely has snow on the ground?
- Would any of the central tendencies you have learned provide you with a clear picture of how much snow fall there really is in Edmonton?
![]() Save your responses in your course folder.
Save your responses in your course folder.
1.2. Explore
Module 4: Statistics
Explore

iStockphoto/Thinkstock
So far in this module you have looked at a variety of measures of central tendency, including mean, median, mode, and trimmed and weighted mean. When data is collected it is often summarized using one or more of these measures of central tendency. Although all of these measures represent an average, you have learned that each of them communicates slightly different information about a data set.
How do you know which measure of central tendency to use to best represent or describe the distribution of data?
The measure(s) of central tendency you would use requires careful consideration. Your choice is dependent on the data you have and what you want to communicate about it. Sometimes you may come across a set of data where all, or none, of the measures of central tendency are appropriate.
One of the first things you need to ask yourself when looking at a data set and deciding on which measure(s) of central tendency to use is whether there are any outliers. If so, then this may greatly influence the mean and may not be the best choice of measure. Also, if there are outliers, does it make sense to include them in the calculations? Remember that this will depend on what you are trying to communicate about the data.
Self-Check 1
Which measure(s) of central tendency would be the most appropriate for each of the following scenarios? Explain your selection.
- You plan to buy a new bat for your softball team. What length of bat should you buy? Answer
- You would like to determine the typical income for people in your town. Answer
- You would like to know the typical height of students in a Grade 12 classroom. Answer
- A restaurant sells three sizes of ice-cream cones. How much does the store make per cone? Answer
- Using your previous knowledge, give an example of a scenario where the following measure of central tendency would be used. Explain the reason for each of your selections.
- arithmetic mean
- median
- mode
Answer
- Under what conditions would a trimmed or weighted mean be more appropriate than an arithmetic mean? Answer
1.3. Explore 2
Module 4: Statistics

Brand X Pictures/Thinkstock
In Self-Check 1 you looked at different situations and tried to decide which measure of central tendency is the most appropriate to use. In the next Self-Check you will think about how different measures of central tendency can be helpful to different people, depending on the focus the person has. If you choose a measure of central tendency that favours a particular viewpoint, then the results can be misleading to some people.
Self-Check 2
Revisit the 2011 Washington Capitals’ salaries table from Lesson 1. Use this table to answer questions 1 to 5.
2011 Salaries of Washington Capitals |
|
Alexander Ovechkin |
$9 000 000 |
Alexander Semin |
$6 700 000 |
Brooks Laich |
$6 500 000 |
Nicklas Backstrom |
$6 000 000 |
Mike Green |
$5 000 000 |
Dennis Wideman |
$4 500 000 |
Roman Hamrlik |
$3 500 000 |
Joel Ward |
$3 000 000 |
Tom Poti |
$3 000 000 |
Jeff Schultz |
$2 500 000 |
Troy Brouwer |
$2 350 000 |
Eric Fehr |
$2 200 000 |
Mike Knuble |
$2 000 000 |
Jason Chimera |
$1 875 000 |
John Erskine |
$1 500 000 |
Tomas Vokoun |
$1 500 000 |
Michal Neuvirth |
$1 150 000 |
Marcus Johansson |
$900 000 |
Matt Hendricks |
$850 000 |
Jeff Halpern |
$825 000 |
John Carlson |
$787 000 |
D. J. King |
$650 000 |
Braden Holtby |
$550 000 |
Jay Beagle |
$525 000 |
Keith Aucoin |
$525 000 |
Patrick McNeill |
$525 000 |
Ryan Potulny |
$525 000 |
- Would other sports teams have a similar set of data? Explain why or why not. Answer
- Calculate the mean, median, and mode for earnings. Answer
- If you were the general manager of this team and had to report the average salary of your players to the following audiences, which measure would you use and why?
- ticket holders
- potential players
- your accountant
Answer - Calculate two different trimmed means for this data. Answer
- Does one of the trimmed means from question 5 better represent the central tendency of this data? If so, explain why. Answer
- Give situations where one of the measures of central tendency is more useful than the others. Answer
- What is another data set that would have very different values for the three measures of central tendency? Answer
1.4. Explore 3
Module 4: Statistics
Share 1
Share your results from Self-Checks 1 and 2 with a partner. Focus your discussion on the following questions.
- Which measure of central tendency is an appropriate representation of the situation being explored?
- Are there outliers present that would skew the mean?
![]() Place a summary of your discussion in your course folder.
Place a summary of your discussion in your course folder.
Self-Check 3
Go to your textbook and answer “Practise Your New Skills” questions 3 to 7, 10, and 11 from pages 144 and 145. Answers
1.5. Connect
Module 4: Statistics
Complete the Lesson 4 Assignment that you saved in your course folder at the beginning of the lesson. Show work to support your answers.
![]() Save your responses in your course folder.
Save your responses in your course folder.
Project Connection
There is no Project Connection in this lesson.
1.6. Lesson 4 Summary
Module 4: Statistics
Lesson 4 Summary
In this lesson you investigated the following question:
- Which measure of central tendency is the best for a given set of data?
Different sets of data can be interpreted using arithmetic mean, median, mode, weighted mean, and trimmed mean.
Which one do you use to best represent the data? Review “Average or Central Tendency: Arithmetic Mean, Median, and Mode.”
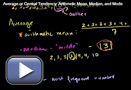
Source: Khan Academy (CC BY-NC-SA 3.0)
Based on your knowledge of these terms and carefully considering the data, your choices of how to interpret will result in a measure of central tendency that will best represent the data.