Lesson 5
| Site: | MoodleHUB.ca 🍁 |
| Course: | Math 30-3 SS |
| Book: | Lesson 5 |
| Printed by: | Guest user |
| Date: | Friday, 19 December 2025, 6:09 PM |
Description
Created by IMSreader
1. Lesson 5
Module 4: Statistics
Lesson 5: Percentile
Focus

© Dmitry Vereshchagin/25345207/Fotolia
The Hybrid III 50th Percentile Male Crash Test Dummy is the most widely used crash test dummy in the world. This dummy is used for the evaluation of automotive safety restraint systems in frontal crash testing. There are also two other versions of the crash test dummy—the Hybrid III 5th Percentile Female and the 95th Percentile Male. The assembly weights are listed in the table.
Dummy |
Approximate Assembly Weight (lbs) |
50th Percentile Male |
171 |
5th Percentile Female |
108 |
95th Percentile Male |
223 |
Source: Humanetics Innovative Solutions (www.humaneticsatd.com)
These crash test dummies are used to model real people. Where would you fit in this group? Can you think of how the percentile is related to the assembly weight?
Lesson Outcomes
At the end of this lesson you will be able to
- describe and analyze percentile ranks
- explain decisions based on a given percentile rank
- explain the difference between percent and percentile rank
- explain the relationship between median and percentile
- solve problems involving percentiles
Lesson Questions
You will investigate the following questions:
- How can percentiles be used to help guide decisions?
- What is the difference between percent and percentile rank?
Assessment
Your assessment may be based on a combination of the following tasks:
- completion of the Lesson 5 Assignment (Download the Lesson 5 Assignment and save it in your course folder now.)
- course folder submissions from Try This and Share activities
- additions to Glossary Terms and Formula Sheet
- work under Project Connection
Materials and Equipment
You will need
- calculator
1.1. Launch
Module 4: Statistics
Launch
Do you have the background knowledge and skills you need to complete this lesson successfully? Launch will help you find out.
Before beginning this lesson you should be able to manipulate a formula and solve for the unknown variable.
1.2. Are You Ready?
Module 4: Statistics
Are You Ready?
Complete these questions. If you experience difficulty and need help, visit Refresher or contact your teacher.
- Solve for each unknown variable by manipulating the formula.
- You should be familiar with the term percent and how to calculate percent. If you need help with calculating percent, work through “Meaning of Percent.”

If you answered the Are You Ready? questions without difficulty, move to Discover.
If you found the Are You Ready? questions difficult, complete Refresher.
1.3. Refresher
Module 4: Statistics
Refresher
Go to “Solving Formulas for any Variable” if you need extra practice or instruction.

Screenshot reprinted with
permission of ExploreLearning
Go back to the Are You Ready? section and try the questions again. If you are still having difficulty, contact your teacher.
1.4. Discover
Module 4: Statistics
Discover

iStockphoto/Thinkstock
How can you describe where you rank in something? When looking at the height of someone, you can say that he or she is the tallest person in the family, but would he or she be the tallest person in the class at school? In Try This 1 you will explore how you are able to rank cellphone use.
Try This 1
Two students in a rural high school math class have gathered data on the number of text messages sent by their classmates in the month of June. Use the information in the table to answer the questions.
Classmate |
Number of Text Messages Sent in June |
Alex |
488 |
Billy |
4055 |
Courtney |
2957 |
Duke |
1763 |
Elone |
0 |
Frank |
2431 |
Gillian |
2490 |
Hillary |
127 |
Ingrid |
7998 |
- Rank the data from lowest to highest.
- Assuming that you have a cellphone with the ability to text, estimate how many text messages you would send.
- Where in the table of data would you fit?
![]() Save your responses in your course folder.
Save your responses in your course folder.
Share 1
With a partner or in a group, discuss your responses to Try This 1 and answer the following questions.
- Suppose you wanted to know where you rank compared to the other students. How would you describe your position of rank?
- Presume a cellphone company has collected these statistics to help it determine a text messaging plan for teenagers. The company wants to design a plan that includes enough free text messages that approximately three-quarters of its customers do not need to pay for messages that exceed their plan allowance. Assuming the data in the table is typical of teens, what number do you suggest the company use and why?
1.5. Explore
Module 4: Statistics

Hemera/Thinkstock
Explore
In Discover you were asked to rank your text messaging data to a list of others. You probably determined that a ranking system was needed in order to understand your position in relation to the others. What was your rank? Does your rank have any meaning? If so, what does it mean?
When describing the relative position or rank of a data point in relation to other data, it is common to describe the number of data points above or below the given data point. This is simple when there is a small, finite number of data, such as the sample of student text messages given in Try This 1. However, when there are large numbers of data, it is often easier to describe the rank of position using percentages.
Return to the text messaging table for Try This 1 and insert your personal text messaging data into the table. Think about the answers to the following questions:
- How many students had fewer text messages per month than you?
- What percentage does this translate to?
Source: MathWorks 12 Student Book/Teacher Guide. (Vancouver: Pacific Educational Press, 2011.)
Calculating the percentage of students with fewer text messages than you is the same as calculating your percentile rank in relation to text messages among this group of students.
1.6. Explore 2
Module 4: Statistics
Self-Check 1
Use Percentile Explorer to investigate how percentile rank works.

Use Percentile Explorer to answer the questions and complete the table.
Total Number of People |
Number of People Hugo Is Taller Than |
Hugo's Percentile Rank |
20 |
8 |
|
40 |
8 |
|
65 |
8 |
|
50 |
|
90 |
27 |
|
63 |
|
12 |
34 |
- In a classroom of 20 students, Hugo is taller than 8 people. What is Hugo's percentile rank? Answer
- Does changing the class size to 40 students change his percentile rank? What is his percentile rank if he is still taller than 8 students in a class of 40? Complete the rest of the table. Answer
Percentile Explorer gave you insight on how percentages and population sizes are related to percentile rank. Carry on to understand percentile rank better.
1.7. Explore 3
Module 4: Statistics

Brand X Pictures/Thinkstock
In Self-Check 1 you used Percentile Explorer to determine the percentile rank of Hugo, depending on the total number of people and how many people Hugo is taller than. In Self-Check 2 you will look at how a percentile rank is different than an independent percent score.
Self-Check 2
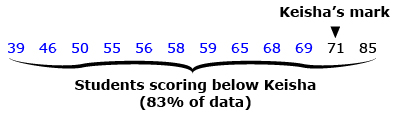
Mr. Kaupp has a student, Keisha, in his automotives class who currently has a grade of 71%. He calculates that she has a percentile rank of 83. What do these two numbers mean and why are they different?
Both numbers given in this scenario are measured out of 100. However, they have very different meanings when you consider what data and information they are being compared to. Let’s investigate this further.
Keisha’s mark of 71% in the course means that for every 100 marks, she has earned 71 of them, resulting in ![]() This percentage is based on and compared to her performance on the test and how many questions out of 100 she answered correctly.
This percentage is based on and compared to her performance on the test and how many questions out of 100 she answered correctly.
Since percentile rank represents the percent of data points below a given value, Kiesha’s percentile rank of 83 means that 83% of her classmates scored lower than her. The percentile rank is based on and compared to her performance as well as the number of students who scored below her.
Her percentile rank of 83 is dependent on the scores of her classmates, whereas her grade of 71% is solely dependent on her performance.
- What would Keisha’s percentile rank be if there were 18 students in her class and 13 of her classmates scored below her? Answer
- What would Keisha’s percentile rank be if there were 33 students in her class and 11 of her classmates scored above her? Answer
- As a student, would you prefer having your percentile rank or your independent percent score reflected on your progress report? Provide an explanation for your choice. Answer
In Self-Check 2 you may have found that a percentile rank may be better to use on your progress report when you are doing better than the other students in your class. If your independent mark is not better than many students in your class, you may prefer to have your independent mark on the progress report. In the next Self-Check you will look at how percentile rank can be used in health care.
Self-Check 3
In the first year of life, the height and weight of babies are tracked very closely by health professionals. To compare one child to the average Canadian range, a health professional will use growth charts that use percentile rank.
- Richard takes his two-month-old son to be measured at the doctor’s office. His son measures 59 cm long. What percentile rank does Richard’s son fit into at two months of age? Answer
- At six months of age Richard’s son measures 66 cm. What percentile rank is his son in now? Answer
- The doctor notes that the child’s percentile ranking has changed. What does this mean? Answer
When you were growing up, you may have noticed that many of the girls were taller than the boys. Looking at the growth charts, did you notice that girls reach their maximum height faster than boys?
1.8. Explore 4
Module 4: Statistics
In Self-Check 3 you saw how percentile rank can help health-care workers determine if a child is growing at a healthy rate based on his or her percentile rank of height at different ages. In the next Try This you will determine the percentile rank for your height at birth and then at today's date.
Try This 2
|
Average Height Range |
Median Height |
Newborn Boy |
45–55 cm |
50 cm |
Newborn Girl |
45–54 cm |
49 cm |
Investigate your birth height and determine your percentile rank in the Canadian population. If you are unsure of your height at birth, you may use this table of data that was extracted from the National Center for Health Statistics.
Measure your height today and determine your percentile rank using the growth charts.
![]() Save your responses in your course folder.
Save your responses in your course folder.
Share 2
With a partner or in a group, discuss Try This 2 and answer these questions.
- How have you changed in your percentile ranking from birth to today?
- Have you grown faster or slower than your peers?
![]() Place a summary of your discussion in your course folder.
Place a summary of your discussion in your course folder.
In the previous activities you may have noticed that you used the same process to calculate percentile rank.
Percentile rank (PR) can be calculated using the formula ![]() , where b is the number of values below the one being considered and n is the total number of values in the data set.
, where b is the number of values below the one being considered and n is the total number of values in the data set.
Source: MathWorks 12 Student Book/Teacher Guide. (Vancouver:Pacific Educational Press, 2011.)
Use the formula for calculating percentile rank to answer the questions in the following Self-Check.
Self-Check 4
Go to page 137 of your textbook and complete “Example 1.” When you are finished, check your solutions with the textbook answers on pages 137 and 138.
How does percentile rank relate to mean, median, or mode?
In the next Self-Check you will look at how the median is related to percentile rank.
1.9. Explore 5
Module 4: Statistics
Self-Check 5
The only measure of central tendency that is directly related to a percentile rank is the median. Think back to the definition of median. Can you predict what percentile rank or score would represent the median? Answer

© .shock/31482267/Fotolia
You have seen how percentile rank can be used to rank a student's learning in class or the student's rank in height. There are other situations where percentile rank can be used. In the next Try This you will explore how percentile rank can be helpful when hiring an employee.
Try This 3
The supervisor of a manufacturing shop needs to hire an employee to help with production. The supervisor contacted the résumé references of three potential candidates who have completed their education. The following tables contain information compiled about the skills possessed by each candidate.
Olivia
| Skill | Percentile Rank |
Number of Students |
Welding |
75 |
12 |
Machining |
56 |
16 |
Pipe Fitting |
91 |
11 |
Owen
| Skill | Percentile Rank |
Number of Students |
Welding |
75 |
20 |
Machining |
75 |
16 |
Pipe Fitting |
70 |
10 |
Liam
| Skill | Percentile Rank |
Number of Students |
Welding |
75 |
24 |
Machining |
88 |
16 |
Pipe Fitting |
20 |
15 |
- Which person is the best at welding? Why?
- Which person is the best at machining? Why?
- Which person is the best at pipe fitting? Why?
![]() Save your responses in your course folder.
Save your responses in your course folder.
Share 3
With a partner or in a group, discuss Try This 3 and answer these questions.
- After analyzing the data and the question responses, which person would you hire?
- What factors would you consider to be important?
![]() Place a summary of your discussion in your course folder.
Place a summary of your discussion in your course folder.
1.10. Explore 6
Module 4: Statistics
In Try This 3 you may have found that only knowing a person’s percentile rank may not be enough. Also knowing how many students are being ranked may be important.
Many programs at technical institutes and colleges are oversubscribed and students are ranked to determine who will gain entrance into the program. In the next Self-Check you will see an example of how percentile rank can be used in admission requirements at post-secondary institutions.
Self-Check 6

Zoonar/Thinkstock
Joan wants to enter the veterinary assistant program at her local technical institute. When reading the admission requirements, she notes that the minimum requirement is a 75% average out of high school. However, Joan knows they only take the top 20% of applicants, so she must be at or above the 80th percentile of all the applicants.
- Joan knows that 150 people have applied for admission to the veterinary assistant program. If she meets the minimum academic requirement and 25 people are ranked ahead of her, will Joan be admitted to the program? Explain your reasoning. Answer
- Another institute only has 25 spaces available in the veterinary assistant program. If there are 150 applicants and Joan is ranked in the 80th percentile, will she be admitted? Explain your reasoning. Answer
In Self-Check 6 you may have found that knowing a percentile rank can help you answer other questions. For admission to a post-secondary institute, a percentile rank could help determine how many people are ranked ahead of a person and if she or he would be admitted to a program. In the next Self-Check you will practise how to determine percentile ranks and how percentile ranks can be interpreted.
Self-Check 7
Add percentile rank to your copy of Glossary Terms.
Add the formula ![]() to your copy of Formula Sheet.
to your copy of Formula Sheet.
1.11. Connect
Module 4: Statistics
Complete the Lesson 5 Assignment that you saved in your course folder at the beginning of the lesson. Show work to support your answers.
![]() Save your responses in your course folder.
Save your responses in your course folder.
Project Connection
You are now ready to complete the rest of the Module 4 Project: Recycling Used Beverage Containers. Go to the Module 4 Project and complete Part 5: Percentile Rank, as well as the Project Conclusion.
![]() Save your responses in the Student Project Document in your course folder.
Save your responses in the Student Project Document in your course folder.
When you have finished the project, submit the completed Student Project Document to your teacher for assessment.
Going Beyond
Quartiles
In this lesson you learned that the 50th percentile divides a data set into two halves. Half the data is lower and half the data is higher at this value point, which also represents the median. Data sets can also be broken into multiple sections. A common method used by statisticians, researchers, and any person who wants to gauge and compare data to the rest is to divide the data into four equal partitions called quartiles.
Can you guess what percentile the first quartile represents? How about the second? The third? Draw a diagram that clearly indicates the meaning of quartiles.
![]() Save your responses in your course folder.
Save your responses in your course folder.
1.12. Lesson 5 Summary
Module 4: Statistics
Lesson 5 Summary
In this lesson you investigated the following questions:
- How can percentiles be used to help guide decisions?
- What is the difference between percent and percentile rank?
It is often useful to know how a value compares to others in a data set. This can be done through percentile rank scoring. Calculating percentile rank also allows you to compare sets of data of varying sizes more easily. In the case of the crash test dummies, now you understand that the 50th percentile male is an average sized male, the 5th percentile female is a small female, and the 95th percentile male is a large male.
The 50th percentile is also known as the median because 50% of the data lies below the median.
Percentile rank is calculated as shown, where b is the number of values below the one being considered and n is the total number of values in the data set.
![]()