Lesson 2
| Site: | MoodleHUB.ca 🍁 |
| Course: | Math 30-2 SS |
| Book: | Lesson 2 |
| Printed by: | Guest user |
| Date: | Wednesday, 24 December 2025, 4:25 AM |
Description
Created by IMSreader
1. Lesson 2
Module 1: Logic and Set Theory
Lesson 2: Introduction to Sets
Focus
Analiese is thinking about enrolling in either medicine or veterinary medicine after she graduates from high school.

Dean Golja/Digital Vision/Thinkstock
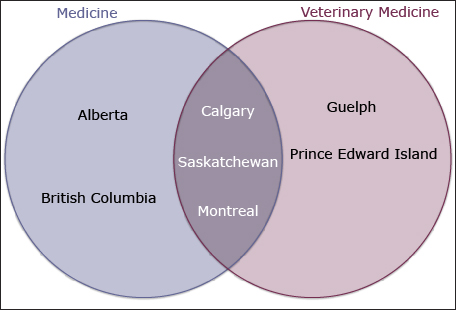
In order to help visualize Analiese’s choices, the following Venn diagram has been created for her choices.

From the Venn diagram, you might be asked to describe which statements best represent the information in the diagram.
- The universities that offer medicine are British Columbia, Alberta, and Saskatchewan.
- The universities that offer veterinary medicine are Guelph, Prince Edward Island, and Saskatchewan.
- The universities that offer medicine and veterinary medicine are Calgary, Saskatchewan, and Montreal.
- The universities that offer medicine and veterinary medicine are Alberta, British Columbia, Guelph, Prince Edward Island, and Saskatchewan.
- The universities that offer medicine or veterinary medicine are Alberta, British Columbia, Calgary, Montreal, Guelph, Prince Edward Island, and Saskatchewan.
The correct response would be statements C and E best represent the information in the diagram. Based on this Venn diagram, you might then suggest that Analiese’s best option would be to choose either Calgary, Saskatchewan, or Montreal since all three universities offer both medicine and veterinary medicine.
Mathematicians would describe the preceding example in terms of sets: sets of universities that offer medicine, sets of universities that offer veterinary medicine, and sets of universities that offer both.
This lesson will introduce the basics of set theory. Sets of objects (such as universities) and sets of numbers will be discussed.
Lesson Outcomes
At the end of this lesson, you will be able to describe sets of
- objects or numbers using Venn diagrams and set terminology
- numbers using set notation
Lesson Questions
In this lesson you will investigate the following questions:
- How can large sets of numbers be described using set notation?
- When is it appropriate to use set notation to describe groups of numbers and their relationships?
- How does an understanding of set terminology and the use of Venn diagrams help analyze data?
Assessment
Your assessment may be based on a combination of the following tasks:
- completion of the Lesson 2 Assignment (Download the Lesson 2 Assignment and save it in your course folder now.)
- course folder submissions from Try This and Share activities
- additions to Glossary Terms
- work under Project Connection
1.1. Launch
Module 1: Logic and Set Theory
Launch
Do you have the background knowledge and skills you need to complete this lesson successfully? Launch will help you find out.
Before beginning this lesson, you should be able to interpret the different regions of Venn diagrams.
1.2. Are You Ready?
Module 1: Logic and Set Theory
Are You Ready?
Complete these questions. If you experience difficulty and need help, visit Refresher or contact your teacher.
- Use the following Venn diagram to answer question 1.
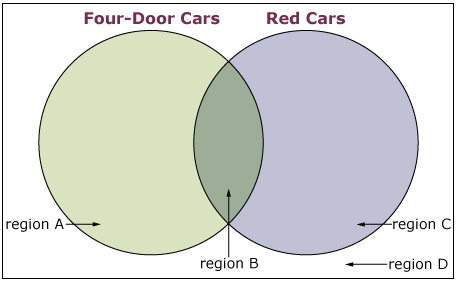
State the region in the Venn diagram where the following vehicles belong.

Jupiterimages/Comstock/
Thinkstock
-

Paulus Rusyanto/Hemera/
Thinkstock

Pekka Jaakkola/Hemera/Thinkstock

Anatoliy Meshkov/Hemera/Thinkstock

Zedcor Wholly Owned/PhotoObjects.net/Thinkstock
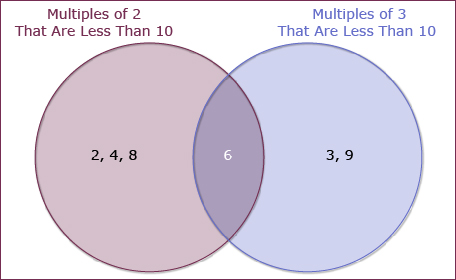
- For each of the following Venn diagrams, state whether the elements are in the correct regions. If not, explain.
-

If you answered the Are You Ready? questions without difficulty, move to Discover.
If you found the Are You Ready? questions difficult, complete Refresher.
1.3. Refresher
Module 1: Logic and Set Theory
Refresher
If you would like to take a closer look at Venn diagrams and review a definition, go to Venn Diagram at the Mathematics Glossary website.
Image © Petr Vaclavek/
23581614/Fotolia
To review how to construct a Venn diagram, watch the video Animals.
Go back to the Are You Ready? section and try the questions again. If you are still having difficulty, contact your teacher.
1.4. Discover
Module 1: Logic and Set Theory
Discover
Stockbyte/Thinkstock
Sets of numbers can be described in a variety of ways: with words, with mathematical symbols, or pictorially. As with any set of items, numbers may be organized and sorted into sets using some characteristics of them.
You will be observing how these sets are similar and how a number may or may not belong to one or more sets. Remember, you are looking at the characteristics of numbers in relation to other numbers. Some examples of characteristics you will experience are prime numbers, even numbers, and multiples.
Try This 1
- Describe each of the sets of numbers with words and with mathematical symbols.
- 1, 3, 5, 7, …
- 3, 6, 9, 12, …
- …, –9, –6, –3, 0, 3, 6, 9, …
-
What does the “…” shown in the three sets for question 1 represent?
![]() Save your responses in your course folder.
Save your responses in your course folder.
Share 1
Share your responses from Try This 1 with a partner or in a group.
- How do your descriptions of the sequences compare with others?
- What words or symbols did you have in common?
1.5. Explore
Module 1: Logic and Set Theory
Explore
Source: Francis, H.T. In Memoriam John Venn.
Cambridge, 1923. Cambridge University Library.
Venn diagrams were invented by a guy named John Venn (no kidding!) as a way of showing relationships between different groups or sets of things. Venn also enjoyed building machines and made a device that bowled balls for cricket, which was so effective the top players could not make contact with the ball.
Set theory involves the study of sets, which are collections of elements. These elements may be universities (as in the example in Focus), vehicles (as in the Are You Ready? questions), or numbers (as in the Try This 1 activity).
As shown in Focus, Venn diagrams are often useful for visualizing elements of sets.
Formal set terminology can be used to describe these universities:
- The universal set is the set of all universities in Canada—not just the universities that offer medicine and veterinary medicine programs.
- Alberta, Saskatchewan, British Columbia, Calgary, and Montreal are the elements of the set of universities that offer medicine.
- The set of universities that offer medicine is a subset of the set of all universities in Canada.
Another term, complement, requires a bit more explanation. The complement of a set contains all elements from the universal set not in that set. The following examples may help:
| Universal Set | Set A | Complement of A |
| all trucks in Canada | red trucks |
all trucks in Canada that are not red |
| all cats and dogs in Rocky Mountain House | short-haired cats |
long-haired cats and all dogs in Rocky Mountain House |
| {1, 2, 3, 4, 5, 6, 7, 8, 9, 10} | {2, 4, 6, 8, 10} |
{1, 3, 5, 7, 9} |
You may want to read the definitions in the margins of pages 6 and 7 in your textbook.
1.6. Explore 2
Module 1: Logic and Set Theory
To practise your knowledge of set terminology, complete the following interactive activity.
Self-Check 1
Marc Villick is a salesman at the car dealership in his town. He only sells new vehicles from his company manufacturer.
In the month of August, he sold 20 vehicles. The vehicles sold were two compact cars, four mid-sized cars, three vans, eight SUVs, and three 4 × 4 crew-cab trucks.
Here are the colour selections the customers chose.
| Vehicle Type | Colour |
| 2 compact cars | 1 red and 1 white |
| 4 mid-sized cars | 1 yellow, 2 white, and 1 tan |
| 3 vans | 1 white and 2 red |
| 8 SUVs | 4 tan, 2 white, and 2 blue |
| 3, 4 × 4 crew-cab trucks | 2 white and 1 black |
Go to Venn Vehicles and complete the drag-and-drop activity.
You may have noticed in your textbook and from previous courses that sets are often given a single letter name and described by listing the elements between the symbols { and }. This is the formal notation (i.e., symbols) that mathematicians use when describing sets. The following are examples of sets using this notation.
Adapted from base map © Map Resources
| Word Description | Set Notation |
universities Analiese is considering for medicine programs |
M = {Alberta, Saskatchewan, British Columbia, Calgary, Montreal} |
even numbers |
E = {2, 4, 6, 8, …} |
multiples of 6 less than 20 |
S = {6, 12, 18} |
provinces west of Ontario |
P = {British Columbia, Alberta, Saskatchewan, Manitoba} |
western provinces with mountain ranges |
W = {British Columbia, Alberta} |
There are two more symbols used by mathematicians when describing sets.
- subset: ⊂
For example, W (western provinces with mountain ranges) is a subset of P (provinces west of Ontario). The symbolic way to write this is W ⊂ P.
- complement: A′
The letter A is the name of the set, and the prime symbol ′ indicates complement.
Try This 2
The following sets of numbers are described using standard set notation. Using words, describe what numbers are contained in each set. List the elements. Note: You can scroll your mouse over different highlighted areas of the set descriptions for questions 2 and 3 to read hints.
- A = {1, 2, 3, …, 20}
- B = {x | 1 ≤ x ≤ 20, x ∈ N}
- C = {c | c = 2x, 0 ≤ x ≤ 20, x ∈ W}
![]() Save your responses in your course folder.
Save your responses in your course folder.
Share 2
What words or symbols used in Try This 1 are similar to those discussed in Try This 2?
This is shorthand for saying x takes on all values from 0 to 20, inclusive.
This is shorthand for saying x takes on all values from 1 to 20 inclusive.
1.7. Explore 3
Module 1: Logic and Set Theory
In Try This 2 you explored set notation. For a further understanding of set notation, read “Example 1” on page 8 of your textbook. Pay particular attention to the way F′ (that is, the complement of F) is represented in the Venn diagram at the bottom of the page.
Self-Check 2
- Complete “Check Your Understanding” questions 2.a. and 2.c. on page 15 of your textbook. Answer
- Complete “Practising” questions 6 and 15 on pages 16 and 17 of your textbook. Answer
Throughout this course, you will encounter new mathematics terms that will be useful to keep track of as you move through the lessons. Use the document titled Glossary Terms. Save this document in your course folder. You will update Glossary Terms throughout the course.
Add the following terms to your copy of Glossary Terms:
- set
- element
- universal set
- subset
- complement
1.8. Connect
Module 1: Logic and Set Theory
Connect
Lesson 2 Assignment
Complete the Lesson 2 Assignment that you saved in your course folder at the beginning of this lesson. Show work to support your answers.
Project Connection
Go to the Module 1 Project and complete Part 2 of the project.
1.9. Lesson 2 Summary
Module 1: Logic and Set Theory
Lesson 2 Summary
Venn diagrams and set notation are two different ways of organizing data to make it more manageable. Venn diagrams can be used to pictorially represent sets and show the relationships between sets. Set notation is used when writing sets of numbers in a more compact way.
Both methods are useful. At times, however, one method may be easier to use or preferred.
Consider the multiples of 4 in the set of all whole numbers between 0 and 20. This can be described in set notation as {y|y = 4x, 0 ≤ x ≤ 5, x ∈ W}.
Using a Venn diagram, it would look like this:
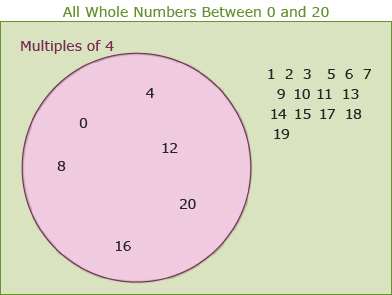
Both methods are useful and simple to create in this example.
However, if asked to consider the multiples of 4 in the set of all natural numbers between 0 and 1 000 000, set notation again would be fairly simple to create:
{y|y = 4x, 0 ≤ x ≤ 250 000, x ∈ W}
In this case, a Venn diagram would take a very long time to create if you had to represent all the numbers from 1 to 1 000 000. A Venn diagram would not be a good option for this question.
In summary, Venn diagrams can be useful to represent sets of objects easier than set notation, while set notation can be used to represent sets of numbers easier than Venn diagrams. Essentially, they both show the same thing; however, the situations you encounter will determine what better describes the sets you are given.
In the next lesson you will continue to build on set notation and Venn diagrams by applying them to contextual problems.