Lesson 1
| Site: | MoodleHUB.ca 🍁 |
| Course: | Math 30-2 SS |
| Book: | Lesson 1 |
| Printed by: | Guest user |
| Date: | Wednesday, 24 December 2025, 4:26 AM |
Description
Created by IMSreader
1. Lesson 1
Module 7: Exponents and Logarithms
Lesson 1: Characteristics of Exponential Functions
Focus

© anamorphicfilms/35312533/Fotolia
How can you describe the growth of certain populations or the decay of radioactive elements? It may be possible to describe some of these growths or decays with terms such as doubling, tripling, or halving. You may have heard about half-lives in science or exponential growth in finance, or you may have dealt with compound interest in the past. These are some examples of exponential functions in the world around you.
Do you enjoy energy drinks, coffee or tea, or pop? All of these drinks contain caffeine that is removed from the body over time. The time it takes to leave the body depends on the amount of caffeine consumed. Typically, the amount of caffeine in the body decreases by about half for each hour that passes. An example of a quantity that keeps decreasing by the same rate over a specific time is the mass of caffeine in a person’s body. The amount of caffeine decreases by about half each hour.
In this lesson you will examine quantities that are increasing or decreasing by the same rate over time. What would the graph of the mass of caffeine in a person’s body look like over time? Is there a type of function that can be used to describe this relationship?
Lesson Outcomes
At the end of this lesson you will be able to
- describe the characteristics of exponential functions by analyzing graphs
- describe the characteristics of exponential functions by analyzing equations
Lesson Question
You will investigate the following question: How can the characteristics of exponential functions be described using graphs and equations?
Assessment
Your assessment may be based on a combination of the following tasks:
- completion of the Lesson 1 Assignment (Download the Lesson 1 Assignment and save it in your course folder now.)
- course folder submissions from Try This and Share activities
- additions to Glossary Terms and Formula Sheet
- work under Project Connection
Self-Check activities are for your own use. You can compare your answers to suggested answers to see if you are on track. If you are having difficulty with concepts or calculations, contact your teacher.
Remember that the questions and activities you will encounter provide you with the practice and feedback that you need to successfully complete this course. You should complete all questions and place your responses in your course folder. Your teacher may wish to view your work to check on your progress and to see if you need help.
Time
Each lesson in Mathematics 30-2 Learn EveryWare is designed to be completed in approximately two hours. You may find that you require more or less time to complete individual lessons. It is important that you progress at your own pace, based on your individual learning requirements.
This time estimation does not include time required to complete Going Beyond activities or the Module Project.
1.1. Launch
Module 7: Exponents and Logarithms
Launch
Do you have the background knowledge and skills you need to complete this lesson successfully? Launch will help you find out.
Before beginning this lesson, you should be able to
- identify powers
- evaluate exponential expressions
1.2. Are You Ready?
Module 7: Exponents and Logarithms
Are You Ready?
Complete these questions. If you experience difficulty and need help, visit Refresher or contact your teacher.
- Identify the coefficient, base, exponent, and power of the following expressions.
- 2x5
- −3x−4
- −x3
Answer - Evaluate the following expressions.
- −24
- (−3)3

- 4−3
- x0
Answer
If you answered the Are You Ready? questions without difficulty, move to Discover.
If you found the Are You Ready? questions difficult, complete Refresher.
1.3. Refresher
Module 7: Exponents and Logarithms
Refresher

Go to Power to read a definition and a review of evaluating powers.

Source: Khan Academy
(![]() BY-NC-SA 3.0)
BY-NC-SA 3.0)
Watch “Negative Exponent Intuition” to review negative exponents.
Go back to the Are You Ready? section and try the questions again. If you are still having difficulty, contact your teacher.
1.4. Discover
Module 7: Exponents and Logarithms
Discover
Dorling Kindersley RF/Thinkstock
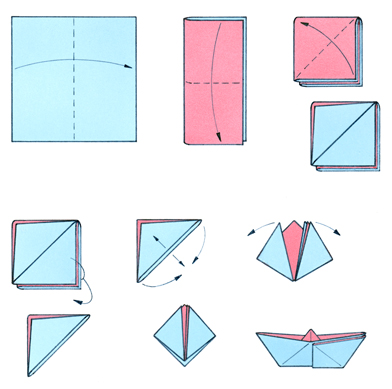
Origami is a traditional Japanese art form that is created by folding paper into various shapes. An example of origami is shown in the diagram, which includes the steps required to create a boat.
In Try This 1 you will fold paper and look at the number of layers of paper that you have after each fold.
Try This 1
Use a piece of paper to determine the number of layers after each fold. Complete a chart like the following.
Number of Folds |
Number of Layers Created | Number of Layers Created as a Power of 2 |
| 0 | 1 | 20 |
| 1 | 2 | 21 |
| 2 | 4 | 22 |
| 3 | 8 | 23 |
| 4 | ||
| 5 |
- Fill in the rest of the chart. Sketch a graph of the number of layers created as a function of the number of folds. Describe the shape of the graph.
- How could you determine the number of layers created for any number of folds?
- How many layers would be created after eight folds?
![]() Save your responses in your course folder.
Save your responses in your course folder.
Share 1
With a partner or group, discuss the following questions.
- Mathematically, what would happen to the number of layers if you kept folding forever? In real life, would it be possible to continue physically folding the paper forever?
- What type of relationship exists between the number of folds of paper and the number of layers of paper created?
![]() If required, place a summary of your discussion in your course folder.
If required, place a summary of your discussion in your course folder.

iStockphoto/Thinkstock
The common belief is that a single sheet of paper cannot be folded more than seven times. This is because the number of layers doubles with each fold but the size of the paper is reduced by half with each fold. However, claims have been made that it is possible to fold paper more than seven times. An American student, Britney Gallivan, is said to hold the record for folding paper at 12 times.
1.5. Explore
Module 7: Exponents and Logarithms
Explore

Hemera/Thinkstock
In Try This 1 you worked with an example of exponential growth. You may have determined that after folding a piece of paper in half eight times, 256 layers of paper were created. The relationship L = 2f describes the number of layers created, L, as a function of the number of folds, f. You will notice that the variable f is an exponent; therefore, L = 2f is considered an exponential function.
The formal mathematical notation of an exponential function is written as y = a(b)x, where a ≠ 0, b > 0, and b ≠ 1.
In Try This 2 you will explore the characteristics of the graphs of exponential functions.
Try This 2
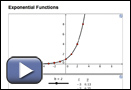
Open the Exponential Functions activity.
- Complete a table like the following using the Exponential Functions activity.
Value of b
2 4
0.7 0.5 Function (y = bx) y = 2x Sketch 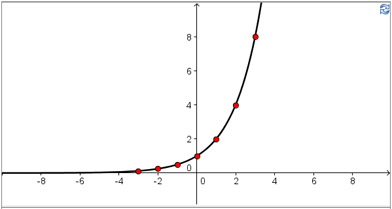
x-intercepts none y-intercepts 1 End Behaviour 
curve extends from quadrant II to quadrant I Behaviour from Quadrant II
to Quadrant I
(Increasing or Decreasing)increasing Domain {x|x ∈ R} Range {y|y > 0, y ∈ R} - How do the x- and y-intercepts for each of the exponential functions compare?
- Compare the end behaviour and whether the graph is increasing or decreasing from quadrant II to quadrant I for exponential functions of the form y = bx when b > 1 and when 0 < b < 1.
- Compare the domain and range for all four exponential functions.
![]() Save your responses in your course folder.
Save your responses in your course folder.
Share 2
With a partner or group, discuss the following question based on your graphs created in Try This 2. Describe any patterns you noticed in the graphs or table of values for the function y = bx, b > 0, b ≠ 1, when the b-value is changed.
1.6. Explore 2
Module 7: Exponents and Logarithms
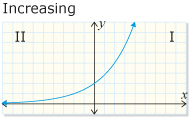
In Try This 2 you may have noticed that when b is greater than 1 in the formula y = bx, the graph increases from quadrant II to quadrant I. This graph describes exponential growth.

From PRINCIPLES OF MATHEMATICS 12 by Canavan-McGrath et al. Copyright Nelson Education Ltd. Reprinted with permission.
This graph shows y = bx, b > 1.
When b is greater than 0 but less than 1, the graph decreases from quadrant II to quadrant I. This graph describes exponential decay.
From PRINCIPLES OF MATHEMATICS 12 by Canavan-McGrath et al. Copyright Nelson Education Ltd. Reprinted with permission.
This graph shows y = bx, 0 < b < 1.
The characteristics of all exponential functions of the form y = bx, b > 0, b ≠ 1 are as follows:
- The domain is {x|x ∈ R}.
- The range is {y|y > 0, y ∈ R}.
- There is no x-intercept.
- The y-intercept is 1.
- The end behaviour is that the graph goes from quadrant II to quadrant I.
Self-Check 1
Complete questions 1 and 2 on page 337 of your textbook. Answer
1.7. Explore 3
Module 7: Exponents and Logarithms
In Try This 3 you will explore how the graph of an exponential function is changed when the parameters of y = a(b)x (where a > 0, b > 0, and b ≠ 1) are altered.
Try This 3
Open the “Exponential Functions—Activity A” tool.
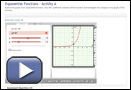
Screenshot reprinted with permission of ExploreLearning.
- Use the sliders and change the a- and b-values to produce the graphs of different exponential functions. Complete a table like the following.
Value of a
1 3
2 4 Value of b 2 2 0.7 0.5 Function (y = bx) y = 2x Sketch 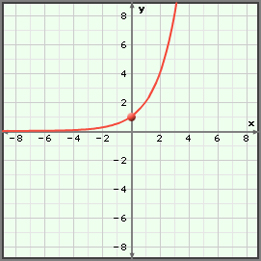
Screenshot reprinted with permission of ExploreLearning.
x-intercepts none y-intercepts 1 End Behaviour curve extends from quadrant II to quadrant I Behaviour from Quadrant II
to Quadrant I
(Increasing or Decreasing)increasing Domain {x|x ∈ R} Range {y|y > 0, y ∈ R} - Given the equation of an exponential function in the form y = a(b)x where a > 0, b > 0, and b ≠ 1, explain how you can determine
- the y-intercept
- if the function is increasing or decreasing
![]() Save your responses in your course folder.
Save your responses in your course folder.
1.8. Explore 4
Module 7: Exponents and Logarithms
In Try This 3 you may have found the relationships between the a and b parameters of the function and the corresponding graph of exponential functions in the form y = a(b)x, where a > 0, b > 0, and b ≠ 1. These relationships are shown in the following table.
Parameter |
Effect on Graph |
| a | equal to y-intercept |
| b | If b > 1, the function is increasing. If 0 < b < 1, the function is decreasing. |
Consider the function y = 2(5)x, where a = 2 and b = 5. You know this will be an increasing function because b > 1.
Confirm that there is no x-intercept:
- Let y = 0; therefore, 0 = 2(5)x. From this, determine an x-value that will result in the function becoming 0.
- There is no value of x that results in the function becoming 0; therefore, there is no x-intercept.
The y-intercept is the a-value; confirm that this is the case:
- Let x = 0; therefore,

- The y-intercept is 2, which is the a-value.
Because the b-value is greater than 1, this function’s end behaviour is increasing from quadrant II to quadrant I.
The domain of this function is {x|x ∈ R}, which means that any value of x can be used. This makes sense as the graph goes from quadrant II to quadrant I, which encompasses all of the x-axis.
The range of this function is {y > 0, y ∈ R}, which means that only positive values of y can be used. This makes sense as the function is above the x-axis and does not touch the x-axis.
You can verify these characteristics by graphing the exponential function y = 2(5)x.
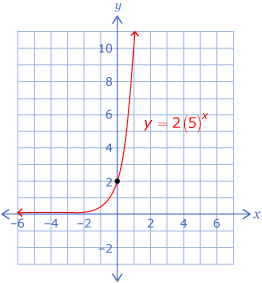
From the graph, note the following:
- The graph never touches the x-axis; therefore, there is no x-intercept.
- The y-intercept is 2.
- The end behaviour is from quadrant II to quadrant I; the graph is increasing.
- The domain is {x|x ∈ R}.
- The range is {y|y > 0, y ∈ R}.
1.9. Explore 5
Module 7: Exponents and Logarithms
Read “Example 2” on pages 341 and 342 of your textbook to find out how the characteristics of a graph can be determined from the exponential equation.
Exponential equations can be used to represent data from a real-life context. In Self-Check 2 you will look at the characteristics of an exponential graph that relates to the context from Try This 1.
Self-Check 2
- In Try This 1 you examined the relationship between the number of folds in a piece of paper, f, and how many layers of paper are created, L. The equation that describes the relationship is L = 2f. This can be rewritten as y = 2x. Use this equation to determine the y-intercept and x-intercept and whether the graph is increasing or decreasing. Explain how you determined your answers. Answer
- Complete question 4 on page 347 of your textbook. Answer
- Complete questions 8.a., 8.b., 8.c., and 8.d. on page 348 of your textbook. Answer
1.10. Explore 6
Module 7: Exponents and Logarithms
You have examined characteristics of exponential functions and how these relate to the form y = a(b)x. In Try This 4 you will use your knowledge to explore matching exponential equations to the corresponding graph.
Try This 4
Open the Matching Exponential Equations and Graphs activity and match each equation with the correct corresponding graph.

1.11. Explore 7
Module 7: Exponents and Logarithms
In Try This 3 you may have noticed that when exponential equations are in the form y = a(b)x, you can determine the y-intercept and whether the graph is increasing or decreasing. Knowing this information, you can match the graph based on these characteristics.
For another example of matching exponential equations and graphs, read “Example 3” on pages 343 to 345 of your textbook.
At the beginning of this lesson, the idea that the amount of caffeine in a person’s body decreases over time was introduced. The relationship between amounts of caffeine in a person’s body over time is an exponential function. In the next Self-Check you will look at a problem involving the exponential decrease of the amount of caffeine in a person’s body.

iStockphoto/Thinkstock
Self-Check 3
-
Complete question 13 on page 349 of your textbook. Answer
-
Complete question 14 on page 350 of your textbook. Answer
-
Complete questions 18.a., 18.d., and 18.e. on page 350 of your textbook. Answer
Add the following terms to your copy of Glossary Terms:
- exponential function
- exponential growth
- exponential decay
Add the following to your copy of Formula Sheet:
- y = a(b)x
1.12. Connect
Module 7: Exponents and Logarithms
Complete the Lesson 1 Assignment that you saved in your course folder at the beginning of this lesson. Show work to support your answers.
![]() Save your responses in your course folder.
Save your responses in your course folder.
Project Connection
At this time you are not to complete any pieces of the project. Go to the Module 7 Project: At the Movies and read over all project requirements to become familiar with what you will be doing and how you will be assessed. You will begin to do work for the project in Lesson 2.
1.13. Lesson 1 Summary
Module 7: Exponents and Logarithms
Lesson 1 Summary
In this lesson you explored exponential functions and how they can be used to describe the growth or decay of quantities.
The characteristics of all exponential functions of the form y = a(b)x, b > 0, b ≠ 1 are as follows:
- When b > 1, the graph increases from quadrant II to quadrant I.
From PRINCIPLES OF MATHEMATICS 12 by Canavan-McGrath et al. Copyright Nelson Education Ltd. Reprinted with permission.
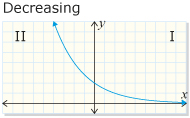
- When 0 < b < 1, the graph decreases from quadrant II to quadrant I.

From PRINCIPLES OF MATHEMATICS 12 by Canavan-McGrath et al. Copyright Nelson Education Ltd. Reprinted with permission.
- The domain is {x|x ∈ R}.
- The range is {y|y > 0, y ∈ R}.
- There is no x-intercept.
- The y-intercept is equal to the a-value.