Lesson 4
| Site: | MoodleHUB.ca 🍁 |
| Course: | Math 30-2 SS |
| Book: | Lesson 4 |
| Printed by: | Guest user |
| Date: | Wednesday, 24 December 2025, 4:31 AM |
Description
Created by IMSreader
1. Lesson 4
Module 7: Exponents and Logarithms
Lesson 4: Characteristics of Logarithmic Functions
Focus

Medioimages/Photodisc/Thinkstock
Researchers have discovered that the population of butterflies is dependent on the number of flower species that butterflies feed on. The relationship is a logarithmic function. As the number of flower species increase, so does the number of butterfly observations, but at a slower rate.
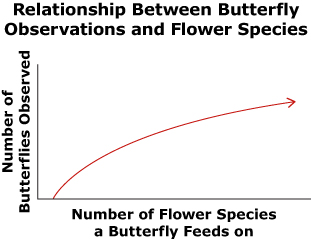
In this lesson you will learn the characteristics of logarithmic functions and their graphs, similar to the graph that shows the relationship between butterfly observations and number of flower species a butterfly feeds on.
Lesson Outcomes
At the end of this lesson, you will be able to
- describe the characteristics of logarithmic functions by analyzing their graphs
- describe the characteristics of logarithmic functions by analyzing their equations
Lesson Question
You will investigate the following question: How can the characteristics of logarithmic functions be described using graphs and equations?
Assessment
Your assessment may be based on a combination of the following tasks:
- completion of the Lesson 4 Assignment (Download the Lesson 4 Assignment and save it in your course folder now.)
- course folder submissions from Try This and Share activities
- work under Project Connection
1.1. Discover
Module 7: Exponents and Logarithms
Discover
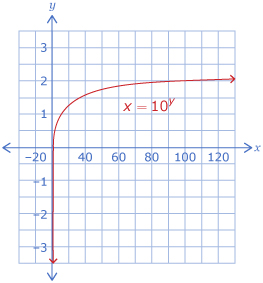
Recall from Lesson 3 that y = log10x is equivalent to x = 10y. You used that knowledge to convert between exponential and logarithmic expressions. You will now explore how the graph of y = 10x compares to the graph of x = 10y.
Try This 1
-
Complete tables of values like the following.
y = 10x x y −2 −1 0 1
x = 10y x y −2 −1 0 1 -
How are the values of x and y related in the two functions?
- Draw the graph of y = x. On the same Cartesian plane, draw the graphs of y = 10x and x = 10y using your tables of values from question 1.
- Describe a possible method for sketching the graph of x = 10y from the graph of y = 10x.
- Identify the following characteristics of your graphs of y = 10x and x = 10y.
Characteristics y = 10x x = 10y Domain Range x-intercept y-intercept End Behaviour
![]() Save your responses in your course folder.
Save your responses in your course folder.
Share 1
With a partner or group, discuss the following based on your graphs created in Try This 1: What is the relationship between the characteristics of the function y = 10x and the characteristics of the function x = 10y?
![]() If required, place a summary of your discussion in your course folder.
If required, place a summary of your discussion in your course folder.
1.2. Explore
Module 7: Exponents and Logarithms
Explore
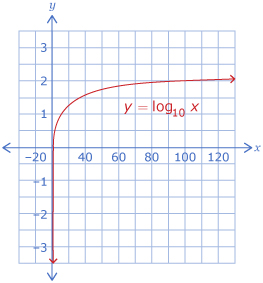
In Try This 1 you compared two exponential relations: y = 10x and x = 10y. In Lesson 3 you learned that y = log10 x is equivalent to x = 10y. In Try This 2 you will explore the characteristics of the graph of y = log10 x and compare them to the characteristics of the graph of x = 10y.
Try This 2
Open the “Logarithmic Functions—Activity A” applet.
Screenshot reprinted with permission of ExploreLearning.
- Change the a-value to 10 and complete the following chart. Note: You can change the zoom of the graph in “Logarithmic Functions—Activity A” using the buttons on the right of the applet.
Characteristics y = log10 x Domain Range x-intercept y-intercept End Behaviour - How does the graph of y = log10 x compare to the graph of x = 10y you saw in Try This 1?
1.3. Explore 2
Module 7: Exponents and Logarithms
In Try This 2 you noticed that the graph of y = log10 x is identical to the graph of x = 10y; therefore, the characteristics of the two graphs are the same.
| Characteristics | y = log10 x |
| Domain | x > 0 |
| Range | y ∈ R |
| x-intercept | The x-intercept value is 1. |
| y-intercept | none |
| End behaviour | from quadrant IV to quadrant I |
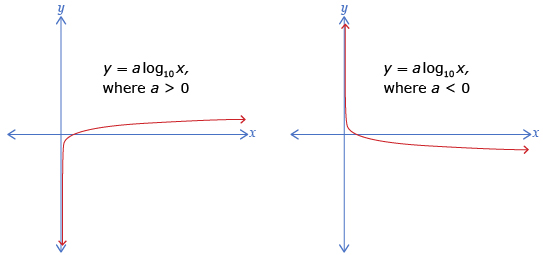
Now that you are familiar with the characteristics of the graph of y = log10 x, you will examine how a change to the parameter a affects the graph of y = a log10 x, where a is a real number.
Try This 3
Open the Logarithmic Functions applet.
- Investigate the effects of a on the graph of y = a log10 x by moving the slider. Record your results in a table similar to the following.
Characteristics a < 0 a > 0 Value of x-intercept Value of y-intercept Domain Range End Behaviour -
- How could knowing the a-value help you predict the characteristics of the graph of y = a log10 x?
- Based on your answer to 2.a., predict what the graph of y = −8 log10 x will look like. Check your prediction using the Logarithmic Functions applet.
1.4. Explore 3
Module 7: Exponents and Logarithms
In Try This 3 you may have determined that the a-value affected the end behaviour. When a is positive, the graph is increasing. The graph starts in quadrant IV and ends in quadrant I. When a is negative, the graph is decreasing. The graph starts in quadrant I and ends in quadrant IV.
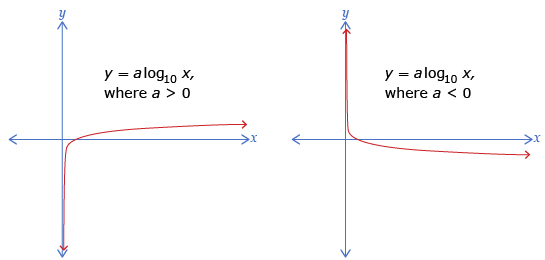
The other characteristics of the graph do not depend on the sign of a, as shown in the following table:
| Characteristics | a < 0 | a > 0 |
| Value of x-intercept | 1 | 1 |
| Value of y-intercept | none | none |
| Domain | x > 0 | x > 0 |
| Range | y ∈ R | y ∈ R |
| End Behaviour | from quadrant IV to quadrant I | from quadrant I to quadrant IV |
Self-Check 1
![]()
1.5. Explore 4
Module 7: Exponents and Logarithms
In Lesson 3 you worked with the pH formula to find the hydrogen ion concentration and the pH value. In Try This 4 you will use a graph of the pH and hydrogen ion concentration to solve problems.
Try This 4
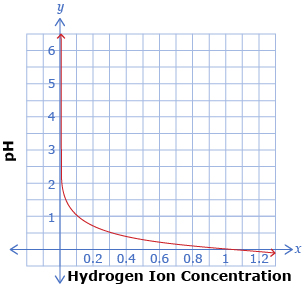
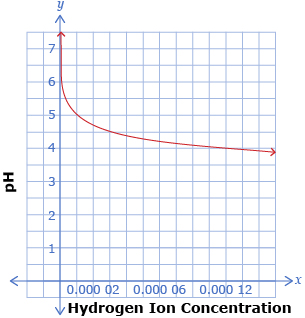
The following two graphs show the relationship pH = −log x, where x is the hydrogen ion concentration of a solution. The two graphs show the same function, but with different x-axis scales.
-
Use the graphs to determine the pH when the hydrogen ion concentration is

iStockphoto/Thinkstock
- 0.4
- 0.000 04
-
- For what hydrogen ion concentrations is each graph useful?
- For what pH range is each graph useful?
-
- Describe an advantage and a disadvantage to using a graph to represent a logarithmic function such as the pH graphs shown.
- Describe an advantage and a disadvantage to using an equation such as pH = −log x to represent a logarithmic function.
![]() Save your responses in your course folder.
Save your responses in your course folder.
1.6. Explore 5
Module 7: Exponents and Logarithms
When graphing a logarithmic function, such as the pH of a solution, care needs to be taken when deciding what scale to use. As with other functions, a graph gives a nice visual representation, but can only be used to approximate values.
Self-Check 2
Complete question 11 on page 423 of your textbook. Answer
1.7. Connect
Module 7: Exponents and Logarithms
Complete the Lesson 4 Assignment that you saved in your course folder at the beginning of this lesson. Show work to support your answers.
![]() Save your responses in your course folder.
Save your responses in your course folder.
Project Connection
You are now ready to apply your understanding of the characteristics of logarithmic functions. Go to Part 1 of the Module 7 Project: At the Movies. Complete Activity 2: Cumulative Revenue.
1.8. Lesson 4 Summary
Module 7: Exponents and Logarithms
Lesson 4 Summary
Like the other functions you have seen, logarithmic functions can be graphed. The graph of a logarithmic function in the form y = a log x has the following characteristics:
| x-intercept | 1 |
| Number of y-intercepts | 0 |
| End Behaviour | The curve extends from quadrant IV to quadrant I when a > 0 and from quadrant I to quadrant IV when a < 0. |
| Domain | x > 0 |
| Range | y ∈ R |
Adapted from PRINCIPLES OF MATHEMATICS 12 by Canavan-McGrath et al. Copyright Nelson Education Ltd. Reprinted with permission.
In the next lesson you will explore how logarithmic expressions can be manipulated using the laws of logarithms.