Lesson 1
| Site: | MoodleHUB.ca 🍁 |
| Course: | Math 30-1 SS |
| Book: | Lesson 1 |
| Printed by: | Guest user |
| Date: | Tuesday, 9 December 2025, 10:34 PM |
Description
Created by IMSreader
1. Lesson 1
Module 1: Function Transformations
Lesson 1: Horizontal and Vertical Translations
adapted from: iStockphoto/Thinkstock
Focus
A tile puzzle can be solved by sliding the tiles. In the puzzle shown, the goal is to rearrange the tiles to complete a picture of a horse. Imagine giving instructions to a friend who was playing the game. How would you describe what moves the friend should make? Suppose you put the tile puzzle onto a grid. Would you describe how a tile moves differently? Learning about transformations will give you a method to mathematically describe these movements.
Try your hand at Image Shuffle. After you launch the puzzle, you will need to right-click on the image and then select “Play.”
In this lesson you will learn how to translate the graph of a function of the form y − k = f(x − h). You will also learn how to determine the equation of the form y − k = f(x − h) from a graph.
Lesson Outcomes
At the end of this lesson you will be able to
- compare graphs of the form y − k = f(x − h) to the graph of y = f(x) and generalize a rule about h and k
- sketch a graph of a function of the form y − k = f(x − h) given the graph of y = f(x) and the values of h and k
Lesson Questions
You will investigate the following questions:
- How are the graphs of the functions y = f(x) and y − k = f(x − h) related?
- How can you graph the function y − k = f(x − h) given y = f(x)?
Assessment
Your assessment may be based on a combination of the following tasks:
- completion of the Lesson 1 Assignment (Download the Lesson 1 Assignment and save it in your course folder now.)
- course folder submissions from Try This and Share activities
- additions to Glossary Terms and Formula Sheet
- work under Project Connection
Self-Check activities are for your own use. You can compare your answers to suggested answers to see if you are on track. If you are having difficulty with concepts or calculations, contact your teacher.
Remember that these questions and activities provide you with the practice and feedback that you need to successfully complete this course. You should complete all the questions and place your responses in your course folder. Your teacher may wish to view your work to check on your progress and to see if you need help.
Materials and Equipment
- graph paper
Time
Each lesson in Mathematics 30-1 Learn EveryWare is designed to be completed in approximately two hours. You may find that you require more or less time to complete individual lessons. It is important that you progress at your own pace, based on your individual learning requirements.
This time estimation does not include time required to complete Going Beyond activities or the Module Project.
1.1. Launch
Module 1: Function Transformations
Launch
Do you have the background knowledge and skills you need to complete this lesson successfully? Launch will help you find out.
Before beginning this lesson you should be able to
- graph a function given an equation of that function
- interpret and use function notation
- work with absolute values
- state the domain and range
1.2. Are You Ready?
Module 1: Function Transformations
Are You Ready?
Complete these questions. If you experience difficulty and need help, visit Refresher or contact your teacher.
- Graph the function y = 3x2 − 2 using a table of values. State the domain and range of the function. Answer
- Given f(x) = 3x + 1, determine the following values.
If you answered the Are You Ready? questions without difficulty, move to Discover.
If you found the Are You Ready? questions difficult, complete Refresher.
1.3. Refresher
Module 1: Function Transformations
Refresher
Khan Academy
(CC BY-NC-SA 3.0)
Review graphing a function given the equation in “Algebra: Graphing Lines 1.”
Use Graph to review how to complete a data table of values and draw a graph for a given function.
Review how to determine domain and range of a relation. Work through Concept Development Domain and Range, which offers information, practice questions, and feedback. To access this activity, choose Domain and Range from the first menu, and then select Domain and Range again from the second menu (on the orange screen).
Khan Academy
(CC BY-NC-SA 3.0)
To review function notation, watch “Functions Part 2.”
Go back to the Are You Ready? section and try the questions again. If you are still having difficulty, contact your teacher.
1.4. Discover
Module 1: Function Transformations
Discover
Try This 1
Open Transformations of a Polygon and complete the steps that follow.
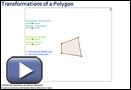
- Use the sliders on the side of the program to complete a table like the one that follows.
*Rotations are not part of this course, but they are interesting.Transformation How the Polygon Is Affected Horizontal Translation Vertical Translation Horizontal Stretch Vertical Stretch Horizontal Reflection Vertical Reflection Rotation About a Point* - Which transformations changed the size of the polygon?
- Which transformations changed the location of the polygon?
![]() Save your responses in your course folder.
Save your responses in your course folder.
Remember that it is important to place your completed Try This activities in your course folder. Your teacher may ask to see your completed Try This activities at any time. For more information on Try This activities, refer to the Course Introduction.
Share 1
After a discussion with your teacher, you will decide how to connect with other students for Share activities. Follow your teacher’s instructions to complete this Share activity. When exchanging ideas, make sure to include support for your response. Support could be in the form of words, graphs, and/or calculations. You should reply to other students’ responses and build on their ideas to come to a deeper understanding of the topic. Place a summary of your Share discussion in your course folder. For more information on Share discussions, refer to the Course Introduction.
With a partner or group, discuss the following questions based on the table from Try This 1.
- Compare your descriptions of how the polygon is affected. What are the similarities and differences?
- Do you think your results would change if you used a different shape? Why or why not?
![]() If required, place a summary of your discussion in your course folder.
If required, place a summary of your discussion in your course folder.
1.5. Explore
Module 1: Function Transformations
Explore
In Try This 1 you investigated four different types of transformations. A transformation of a relation is a change made to the relation such that the graph of the relation is shifted or changed in shape. In this lesson you will learn more about translations, a specific type of transformation. A translation of a relation is a shift in the position of the graph without changing the graph’s shape or orientation.
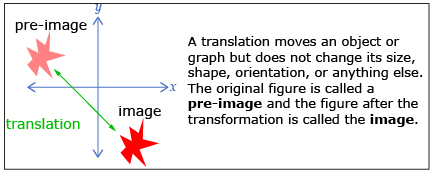
Just as transformations can be applied to figures, such as the polygon from Try This 1 or the star in the diagram shown, transformations can also be performed on the graph of a function. In Try This 2 you will explore the transformation of the function f(x) = |x|.
Try This 2
The textbook for this course is Pre-Calculus 12. For more information on the textbook, refer to the Course Introduction or contact your teacher.
- Complete questions 1 to 6 on pages 6 to 7 of the textbook. Use Try This 2 Organizing Template to organize your information. Include the value of h or k for each equation.
- Complete questions 7 to 9 on page 7 of the textbook.
![]() Save your responses in your course folder.
Save your responses in your course folder.
1.6. Explore 2
Module 1: Function Transformations
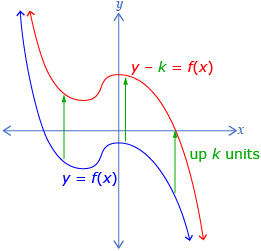
In Try This 2 you may have noticed that the graph y = |x| + k is the graph y = |x| translated up k units. Similarly you may have seen that y = |x − h| is the graph of y = |x| translated h units to the right. These results can be generalized to any function f(x).
The graph of y = f(x) + k is the graph of y = f(x) translated up k units and the graph of y = f(x − h) is the graph of y = f(x) translated to the right h units. Often y = f(x) + k is written as y − k = f(x) to emphasize that the k-value causes a change in the y direction.
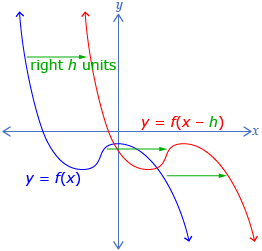
Be careful determining an h-value for an equation of the form y = |x − h|. In the equation y = |x + 3|, the h-value is negative and the equation can be thought of as y = |x − (−3)|. Similar care must be taken when determining k.
Read part a of “Example 1” and its solution on page 8 of the textbook. You will see that translations can be applied to other functions in a way similar to that seen in Try This 2.
Self-Check 1
Complete questions 1.a., 1.b., 1.c., 2.b., and 2.d. on page 12 of your textbook. Answer
In question 2.d. of Self-Check 1, you probably translated the points A, B, C, D, and E down 2 units each to plot the image. This relationship between pre-image points and image points is called a mapping. Mapping notation can be used to describe what happens to each point.
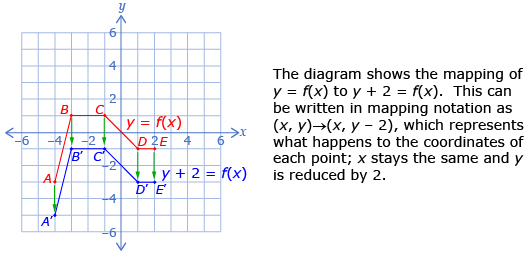
Read part b of “Example 1” and its solution on pages 8 to 9 to see how mapping notation is used to describe a translation.
Self-Check 2
Complete questions 3.a. and 3.b. on page 13 of the textbook. Answer
1.7. Explore 3
Module 1: Function Transformations
So far you have looked at the effects of h and k on functions of the form y − k = f(x) and y = f(x − h). Next you will look at combining these ideas to predict the effects of h and k on functions of the form y − k = f(x − h). Often this equation is rearranged to isolate y, giving y = f(x − h) + k. How do you think this function will respond to changing h and k?
Try This 3
Open Translations [y = f(x − h) + k].
![This play button opens Translations [y = f(x – h) + k].](https://moodlehub.ca/pluginfile.php/85966/mod_book/chapter/24145/m30_1_m1/images/m1/m30_1_m1_008.jpg)
Step 1: Select a cubic function using the button.
Step 2: Use the applet to complete a table like the one that follows. The equation of the graph is shown above the graph.
Function in Form y = f(x − h) + k |
Value of h | Value of k | Effect on Graph | Diagram |
| y = x3 |
||||
| y = (x − 2)3 + 1 | ||||
| y = (x + 3)3 − 4 |
Step 3: Push the SET FCN button at the bottom right of the diagram and select the absolute-value function  .
.
Step 4: Use this function to complete a table like the one that follows.
Function in Form y = f|x − h| + k |
Value of h | Value of k | Effect on Graph | Diagram |
| y = |x| | ||||
| y = |x + 2| + 3 | ||||
| y = |x − 2| − 4 |
- What effects do h and k have on a function that contains both h and k?
- How do the effects of changing h and k compare for the cubic function? The absolute-value function?
![]() Save your responses in your course folder.
Save your responses in your course folder.
1.8. Explore 4
Module 1: Function Transformations
Functions of the form y = f(x − h) + k can be graphed quickly from y = f(x) using what you have learned so far about h and k. Watch Graphing with h and k to see an example of how to graph such a function.
Self-Check 3
- Complete “Your Turn” from “Example 2” on page 9 of the textbook. Answer
- Complete questions 1.e., 3.c., 4.b., 15, and C1 on pages 12 to 15 of the textbook. Answer
You have explored how to determine characteristics of a graph from an equation; however, it is also possible to reverse this process and determine the equation of a graph if the graph of a similar function is known.
Read “Example 3” on pages 10 to 11 of the textbook to see this process.
Self-Check 4
Complete questions 5.c., 5.d., 6, 9, 11.b., and 12 on pages 13 and 14 of your textbook. Answer
Throughout this course you will add new terms to the document Glossary Terms. Save this file in your course folder now. For more information about how to complete Glossary Terms, refer to the document.
Add the following terms to your copy of Glossary Terms:
- transformation
- translation
- pre-image
- image
- mapping
You will also add new formulas to Formula Sheet. Save this file in your course folder now. For more information about how to complete Formula Sheet, refer to the document.
Add the formula y − k = f(x − h) to your copy of Formula Sheet.
Your copies of Glossary Terms and Formula Sheet will be great resources for you as you respond to activities and prepare for tests.
1.9. Connect
Module 1: Function Transformations
Complete the Lesson 1 Assignment that you saved in your course folder at the beginning of the lesson. Show work to support your answers.
![]() Save your responses in your course folder.
Save your responses in your course folder.
Project Connection
Go to Module 1 Project: Designing with Transformations. Review what is expected. Begin to think of a design that you will use for this project once you finish the module lessons. The project will require all the transformations you will learn in this module, so you may want to delay starting the project until you are more familiar with these transformations.
![]() Remember to save all of your notes in your course folder.
Remember to save all of your notes in your course folder.
Going Beyond

iStockphoto/Thinkstock
Tessellation is a combination of mathematics and artistic ability. A tessellation is a pattern of plane figures that fills the plane with no overlaps and no gaps. They frequently appeared in the art of M. C. Escher. Enter his name into a search engine to see some of his work.
Escher was inspired by the Moorish use of symmetry in the Alhambra tiles (illustrated here). If you were to start with the green star in the top left-hand corner of the visual, can you describe the translation to get to the blue star? If you started with the same green star, describe the translation to the rust-coloured star that is below the green star.
1.10. Lesson 1 Summary
Module 1: Function Transformations
Lesson 1 Summary
A transformation is a change in the shape or position of a figure or relation. A translation is a type of transformation that causes a “slide” in the graph. The new graph is the same size, shape, and orientation as the original but in a different position.
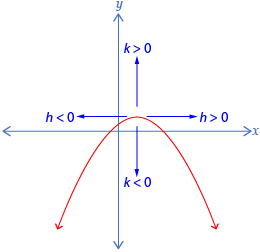
In a graph of the form y − k = f(x − h), k is the vertical translation from y = f(x). If k > 0, the translation is upwards. If k < 0, the translation is downwards.
In a graph of the form y − k = f(x − h), h is the horizontal translation from y = f(x). If h > 0, the translation is to the right. If h < 0, the translation is to the left.
You may find it useful to keep a summary of the different transformations you learn in this module using a table similar to the following.
| Parameter | Type of Transformation | Effect on Graph |
In the next lesson you will begin to look at reflections of a function.