Lesson 1
| Site: | MoodleHUB.ca 🍁 |
| Course: | Math 30-1 SS |
| Book: | Lesson 1 |
| Printed by: | Guest user |
| Date: | Tuesday, 9 December 2025, 11:13 PM |
Description
Created by IMSreader
1. Lesson 1
Module 5: Trigonometry Applications and Identities
Lesson 1: The Tangent Function
Focus

iStockphoto/Thinkstock
In a drag race, speeding automobiles are driven down a straight track in an attempt to cross the finish line first. Imagine sitting trackside during a race. Think of how your head twists as a car races past. What is the furthest your head will ever have to turn to see the car? Where will the car be when your head is turning the fastest? The slowest? Will your line of sight ever be parallel to the car's path?

iStockphoto/Thinkstock
In this lesson you will explore the tangent function. This function can be used to model some problems where an object moving in a straight line is observed. Sine, cosine, and tangent are the three primary trigonometric ratios and are often studied together; however, the tangent function behaves much differently than the other two.
Lesson Outcomes
At the end of this lesson you will be able to
- relate the tangent function to its graph
- solve problems using the tangent function
Lesson Questions
In this lesson you will investigate the following questions:
- How can the tangent function be represented graphically?
- How can the tangent function be used to solve problems?
Assessment
Your assessment may be based on a combination of the following tasks:
- completion of the Lesson 1 Assignment (Download the Lesson 1 Assignment and save it in your course folder now.)
- course folder submissions from Try This and Share activities
- additions to Glossary Terms and Formula Sheet
- work under Project Connection
Self-Check activities are for your own use. You can compare your answers to suggested answers to see if you are on track. If you have difficulty with concepts or calculations, contact your teacher.
Remember that the questions and activities you will encounter provide you with the practice and feedback you need to successfully complete this course. You should complete all questions and place your responses in your course folder. Your teacher may wish to view your work to check on your progress and to see if you need help.
Time
Each lesson in Mathematics 30-1 Learn EveryWare is designed to be completed in approximately two hours. You may find that you require more or less time to complete individual lessons. It is important that you progress at your own pace, based on your individual learning requirements.
This time estimation does not include time required to complete Going Beyond activities or the Module Project.
1.1. Launch
Module 5: Trigonometry Applications and Identities
Launch
Do you have the background knowledge and skills you need to complete this lesson successfully? Launch will help you find out.
Before beginning this lesson you should be able to
- give a geometric definition of a tangent
- define asymptote
1.2. Are You Ready?
Module 5: Trigonometry Applications and Identities
Are You Ready?
Complete these questions. If you experience difficulty and need help, visit Refresher or contact your teacher.
- Explain what a line tangent to a circle is. Answer
- What is an asymptote? Answer
- Determine an exact value for each of the following:

- tan 30°

- Describe the characteristics of the graph of
 . Answer
If you answered the Are You Ready? questions without difficulty, move to Discover.
If you found the Are You Ready? questions difficult, complete Refresher.
1.3. Refresher
Module 5: Trigonometry Applications and Identities
Refresher
Source: Khan Academy
(CC BY-NC-SA 3.0)
“Language and Notation of the Circle” will help you review circle terminology as well as the definition of the tangent.
Module 4 Lesson 4 describes the six common trigonometric ratios and how to calculate the values of each.
Module 4 Lesson 6 describes how to graph and interpret the functions y = a sin (bx) and y = a cos (bx).
Module 4 Lesson 7 describes how to graph and interpret the functions ![]() and
and ![]()
Go back to the Are You Ready? section and try the questions again. If you are still having difficulty, contact your teacher.
1.4. Discover
Module 5: Trigonometry Applications and Identities
Discover
Try This 1
Use Tangent Geogebra to complete the following questions.
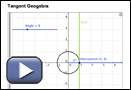
- Use Tangent Geogebra to help you complete the following table. You may not be able to fill in all the spaces. Arrow keys can be used to change the angle slider in small increments.
Terminal Arm Angle (°)
x-Coordinate of Intersection
y-Coordinate of Intersection
–90
–75
–60
–45
–30
0
30
45
60
75
90
135
180
225
270
315
360
390
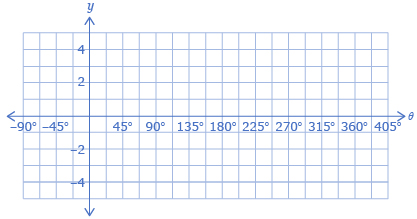
- Graph the y-coordinate of the intersection versus the terminal arm, θ, on the following coordinate plane.
- Sketch what you think the graphs will look like for θ < −90° and θ > 390°.
![]() Save your answers in your course folder.
Save your answers in your course folder.
Share 1
With a partner or group, discuss the following questions based on your graph created in Try This 1.
- What happens to your graph when the terminal arm in Tangent Geogebra is vertical (such as −90°, 90°, or 270°)?
- How is this graph similar to the sine graph you drew in Module 4? How is it different?
![]() If required, save a record of your discussion in your course folder.
If required, save a record of your discussion in your course folder.
1.5. Explore
Module 5: Trigonometry Applications and Identities
Explore
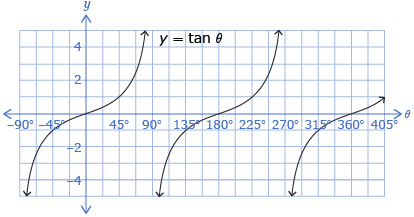
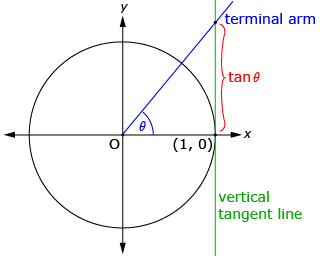
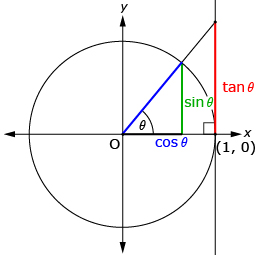
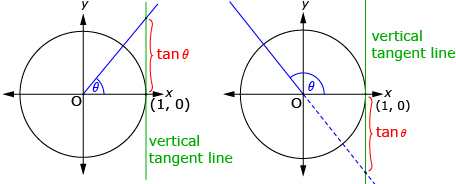
In Try This 1 you plotted the graph of a tangent function that should have looked like the first diagram that follows. The tangent function can be defined as the y-coordinate of the intersection of the terminal arm and a vertical line tangent to the right side of the unit circle as shown in the second and third diagrams.
When the terminal arm is in quadrant 1 or quadrant 4, the intersection of the terminal arm and the vertical tangent is used to find y. |
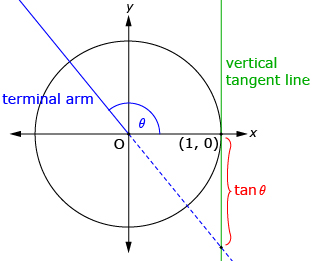
When the terminal arm is in quadrant 2 or quadrant 3, an extension of the terminal arm is used to find the intersection with the vertical tangent. |
In Try This 2 you will explore some characteristics of the tangent function.
Try This 2
- Using technology, graph the function y = tan x over the domain −4π< x < 4π.
- Sketch the graph of y = tan x. Draw in the vertical asymptotes.
-
- Determine when tan x = 0.
- Write a general equation to represent all the real values of x that make tan x = 0.

- The graph of y = tan x is not defined for all x values and includes vertical asymptotes.
- At what x values do asymptotes occur?
- Write a general equation to represent all the asymptotes of y = tan x over the real numbers.
- Determine the period of y = tan x. How does this compare to the period of y = sin x or y = cos x?
- Determine the domain and range of y = tan x. How do these sets of values compare to the domain and range of y = sin x or y = cos x?
- Determine the amplitude of tan x. What problem do you notice when attempting to determine this amplitude?
![]() Save your answers in your course folder.
Save your answers in your course folder.
1.6. Explore 2
Module 5: Trigonometry Applications and Identities
In Try This 2 you may have noticed that although there are some similarities between y = tan x and y = sin x or y = cos x, they are very different functions. The following example summarizes some of the characteristics of y = tan x. You may want to compare these characteristics to the ones you found in Try This 2.
Read “Example 1” on pages 259 and 260 of your textbook.
Self-Check 1
Complete questions 1.a., 1.b., 2.a., 2.b., 2.c., 4, and 8 on pages 262 to 264 of the textbook. Answer
So far you have seen some characteristics of the tangent function. In Try This 3 you will explore the relationship between the tangent function and the slope of the terminal arm.
Try This 3
Complete “B: Connect the Tangent Function to the Slope of the Terminal Arm” questions 8 to 12 and 14 on pages 257 and 258 of the textbook.
1.7. Explore 3
Module 5: Trigonometry Applications and Identities
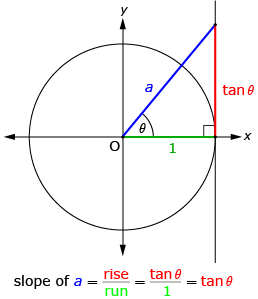
In Try This 3 you may have seen that the slope of the terminal arm in standard position at angle θ is equal to tan θ.
In Try This 4 you will explore a relationship between sine, cosine, and tangent.
Try This 4
Recall from Module 4 that cos θ and sin θ can be defined as the x- and y-coordinates of the unit circle, respectively. Look at the following diagram.
- Use the diagram and your knowledge of similar triangles to determine a relationship between sin θ, cos θ, and tan θ.

- Consider the following graph that shows y = sin x, y = cos x, and y = tan x.
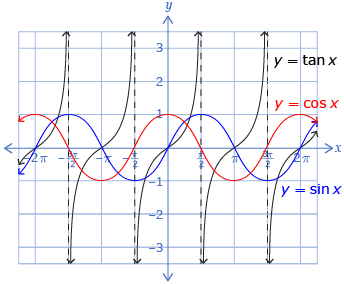
- What is the value of tan θ when sin θ = 0?
- What is the value of tan θ when cos θ = 0?
![]() Save your responses in your course folder.
Save your responses in your course folder.
Share 2
With a partner or group, discuss the following question based on the relationship you determined in Try This 4.
In terms of the graph in question 2 of Try This 4, how can you explain the relationship you determined in question 1?
![]() If required, save a record of your discussion in your course folder.
If required, save a record of your discussion in your course folder.
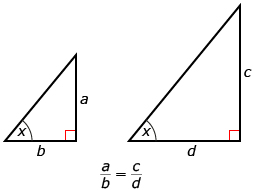
Recall that the following relationship is true for similar triangles.
1.8. Explore 4
Module 5: Trigonometry Applications and Identities
In Try This 4 you may have seen that ![]() A geometric representation of this is shown.
A geometric representation of this is shown.
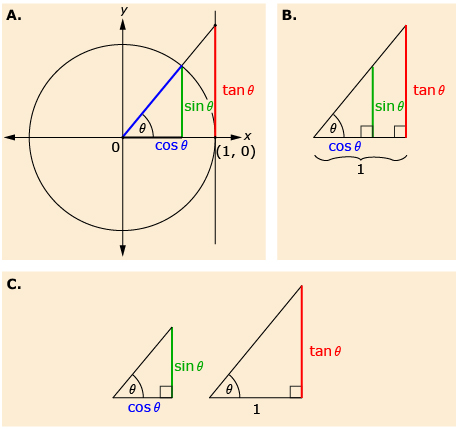
A. sin θ, cos θ, and tan θ are represented together on a unit circle.
B. Removing the unit circle leaves two similar triangles.
C. By using the fact that the ratio of corresponding sides of similar triangles
are equal, it can be seen that ![]()
Self-Check 2
Complete questions 6, 7, and C2 on pages 263 and 265 of the textbook. Answer
1.9. Explore 5
Module 5: Trigonometry Applications and Identities
You have explored various properties of the tangent function. Next, you will look at how some problems can be solved using the tangent function.
Try This 5
Open Airplane Exploration. The applet shows a plane flying in a straight line at a height of 6000 m over an observer on the ground. (Each unit represents 1000 m in the applet.)
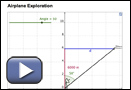
- At the observer, an angle is formed between a vertical line and the plane. Determine a relationship between this angle and the horizontal distance, d.
- Copy and complete the following table of values.
Angle
50°
45°
25°
10°
0°
−10°
−25°
−45°
−50°
Horizontal Distance (d) from Observer
- Extend the table of values from question 2 to include values from –90° to 90°.
- Use your table of values to sketch the graph of this relationship.
![]() Save your answers in your course folder.
Save your answers in your course folder.
Share 3
With a partner or group, discuss the following questions based on the relationship you determined in Try This 5.
- Where are the asymptotes on your graph? What do the asymptotes represent in the scenario?
- What happens when the angle is equal to 0°? What does an angle of 0° represent in the scenario?
![]() If required, save a record of your discussion in your course folder.
If required, save a record of your discussion in your course folder.
1.10. Explore 6
Module 5: Trigonometry Applications and Identities
In Try This 5 you determined a relationship between the horizontal distance a plane was from an observer and the angle between a vertical line and the plane. The textbook explains the problem in detail in “Example 2.” Check how your answers compare to those in the textbook.
Read “Example 2” on pages 260 and 261 of the textbook.
Self-Check 3
Complete questions 9, 10, and 12 on pages 264 and 265 of the textbook. Answer
Add tangent function to your copy of Glossary Terms.
Add the following formula to your Formula Sheet:
- y = tan θ
1.11. Connect
Module 5: Trigonometry Applications and Identities
Open your copy of Lesson 1 Assignment, which you saved in your course folder at the beginning of this lesson. Complete the assignment. Show work to support your answers.
Project Connection
You are ready to start working on Module 5 Project: Pushing the Limits of Vehicle Performance. Go to the Module 5 Project and read over all project requirements to become familiar with what you will be doing and how you will be assessed. Complete Activity 1: Part 1.
1.12. Lesson 1 Summary
Module 5: Trigonometry Applications and Identities
Lesson 1 Summary
In this lesson you explored the tangent function. The tangent function can be defined as the y-coordinate of the intersection of the terminal arm and a vertical line tangent to the right side of the unit circle as shown in the diagram.
When the terminal arm is in quadrant 1 or quadrant 4, the intersection of the terminal
arm is used. When the terminal arm is in quadrant 2 or quadrant 3, an extension of
the terminal arm is used.
Although y = tan x is periodic, it is very different from y = sin x or y = cos x. The function y = tan x is not defined for all x values, and its graph contains vertical asymptotes and has no minimum or maximum value.

sin θ, cos θ, and tan θ are related by the equation ![]() and the slope of the terminal arm in standard position at angle θ is equal to tan θ.
and the slope of the terminal arm in standard position at angle θ is equal to tan θ.
In Lesson 2 you will examine how a problem can be solved using a trigonometric model.