Lesson 1
| Site: | MoodleHUB.ca 🍁 |
| Course: | Math 30-1 SS |
| Book: | Lesson 1 |
| Printed by: | Guest user |
| Date: | Saturday, 27 December 2025, 2:15 AM |
Description
Created by IMSreader
1. Lesson 1
Module 7: Rational Functions and Function Operations
Lesson 1: Exploring Rational Functions
Focus

wagon: Photos.com/Thinkstock; vintage truck: iStockphoto/Thinkstock: semi: iStockphoto/Thinkstock
Two main categories of transport on roads are the transportation of goods and the transportation of people. Early methods of road transport were horses or oxen-drawn carts over dirt tracks that may have been animal trails. In 1905, when Alberta became a province, a revolution in travel was taking place with the motor car and truck becoming a common sight in Western Canada.
The choice for road transportation of goods depends on the weight and volume of the shipment, the distance, and the nature of the goods. For short distances and light, small shipments, a van or pick-up truck may be used. On the other hand, for long distances and heavy loads, the commercial semitrailer truck is the preferred choice. These choices affect rates such as speed, fuel consumption, and cost of transportation.
Analyzing the transportation of goods or people can be a complex process. Rates that involve time, distance, money, and fuel can be used to help make decisions about transportation. How can you mathematically describe rates?
In this lesson you will begin to explore the graphs of rational functions. You will use transformations as a tool to help you draw and interpret these graphs.
Lesson Outcomes
At the end of this lesson you will be able to
- graph and interpret a rational function
- use transformations to graph a rational function
Lesson Question
You will investigate the following question:
- How can rational functions be graphed and interpreted?
Assessment
Your assessment may be based on a combination of the following tasks:
- completion of the Lesson 1 Assignment (Download the Lesson 1 Assignment and save it in your course folder now.)
- course folder submissions from Try This and Share activities
- additions to Glossary Terms
- work under Project Connection
Self-Check activities are for your own use. You can compare your answers to suggested answers to see if you are on track. If you have difficulty with concepts or calculations, contact your teacher.
Remember that the questions and activities you will encounter provide you with the practice and feedback you need to successfully complete this course. You should complete all questions and place your responses in your course folder. Your teacher may wish to view your work to check on your progress and to see if you need help.
Time
Each lesson in Mathematics 30-1 Learn EveryWare is designed to be completed in approximately two hours. You may find that you require more or less time to complete individual lessons. It is important that you progress at your own pace, based on your individual learning requirements.
This time estimation does not include time required to complete Going Beyond activities or the Module Project.
1.1. Launch
Module 7: Rational Functions and Function Operations
Launch
Do you have the background knowledge and skills you need to complete this lesson successfully? Launch will help you find out.
Before beginning this lesson you should be able to
- determine the asymptotes of the graph
- find the non-permissible values for rational expressions
1.2. Are You Ready?
Module 7: Rational Functions and Function Operations
Are You Ready?
Complete the following questions. If you experience difficulty and need help, visit Refresher or contact your teacher.
- What is an asymptote? Answer
- What are the vertical asymptotes for y = tan θ, where 0 < θ < 360°? Answer
- Find the horizontal asymptote for y = 3(2)x. Answer
- Give the non-permissible values for the equation
 Give reasons for your answer. Answer
If you answered the Are You Ready? questions without difficulty, move to Discover.
If you found the Are You Ready? questions difficult, complete Refresher.
1.3. Refresher
Module 7: Rational Functions and Function Operations
Refresher
Source: Khan Academy
(![]() BY-NC-SA 3.0)
BY-NC-SA 3.0)
Watch “Rational Equations” to review non-permissible or excluded values of rational equations.
Go back to the Are You Ready? section and try the questions again. If you are still having difficulty, contact your teacher.
1.4. Discover
Module 7: Rational Functions and Function Operations
Discover

iStockphoto/Thinkstock
Try This 1
You are planning to install sod in your yard. You calculated that the installation will require 240 rolls and you have placed an order. Unfortunately, the delivery person read the address incorrectly and dropped off the sod at a house a block away. The delivery truck came from out of town and will not be able to return to help you move the sod. You begin to contemplate the effort it would take to move the sod, and you consider various means of transportation. Each piece weighs about 12 kg, so you make the following estimates.
Transportation Method |
Number of Rolls Moved at a Time |
| Neighbour’s Cat | 0.2 |
| 7-year-old Next Door | 0.5 |
| 12-year-old Next Door | 1 |
| Yourself | 2 |
| You and a Friend | 4 |
| Wheelbarrow | 5 |
| Wagon | 8 |
| Car Trunk (This will be messy.) | 15 |
| Pick-up Truck | 40 |
- Copy and complete the following table of values:
Transportation Method
Number of Rolls Moved at a Time (r)
Number of Trips Required (T) Neighbour’s Cat 0.2
7-year-old Next Door 0.5
12-year-old Next Door 1
Yourself 2
You and a Friend 4
Wheelbarrow 5
Wagon 8
Car Trunk (This will be messy.) 15
Pick-up Truck 40
-
- Based on the data in the table, determine an equation that relates T to r.
- Plot T as a function of r.

-
- Plot the data from the table on the same coordinate plane as question 2.b.
- How are the graphs for questions 2.b. and 3.a. related?
-
- What happens to your graph of T as a function of r as r gets larger?
- What happens to T as r decreases to 0?
- Can r be 0? Can T be 0?
- Determine a domain and range for this scenario.
![]() Save your responses in your course folder.
Save your responses in your course folder.
Share 1
With a partner or group, discuss the following questions based on your graph created in Try This 1.
- Explain how your graph would look different if
- you needed to haul 480 rolls
- you needed to haul 240 rolls but had to add 4 extra trips to carry the wooden pallets the sod arrived on
- What would the graph of the equation you wrote look like if you included negative r-values? (This situation would not make sense in terms of rolls of sod.)
![]() If required, save a record of your discussion in your course folder.
If required, save a record of your discussion in your course folder.
1.5. Explore
Module 7: Rational Functions and Function Operations
Explore
In Try This 1 you began to explore a simple rational function. A rational function f(x) is a function that can be written as ![]() , where g(x) and h(x) are polynomial functions and h(x) ≠ 0.
, where g(x) and h(x) are polynomial functions and h(x) ≠ 0.
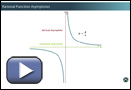
The rational function from Try This 1 can be written as ![]() and has the same typical shape as a function of the form
and has the same typical shape as a function of the form ![]() . This function has a vertical asymptote at x = 0 and a horizontal asymptote at y = 0. This is because, if you rewrite the function as x × y = a, you realize that neither x nor y can equal zero if a is a non-zero number. Watch Rational Function Asymptotes to explore the asymptotes.
. This function has a vertical asymptote at x = 0 and a horizontal asymptote at y = 0. This is because, if you rewrite the function as x × y = a, you realize that neither x nor y can equal zero if a is a non-zero number. Watch Rational Function Asymptotes to explore the asymptotes.
It is possible to transform rational functions just like other functions? Try This 2 explores this idea.
Try This 2
- In Module 1 you used the general formula y = af[b(x − h)] + k to help graph functions similar to y = f(x) using transformations. Explain how
 can be thought of as a variation of y = af(x − h) + k.
 - Predict the effects of changing a, h, and k in
 .
. - Open Transforming a Rational Function and check your solutions to question 2.
- The function
 is shown.
Describe how can be used to graph the following functions using transformations:
- Use Transforming a Rational Function, if needed, to help answer the following questions.
- Predict where asymptotes will occur in
 in terms of a, h, and k.
 - Explain how you can determine the domain and range of
 in terms of a, h, and k.
- Predict where asymptotes will occur in
![]() Save your responses in your course folder.
Save your responses in your course folder.
1.6. Explore 2
Module 7: Rational Functions and Function Operations
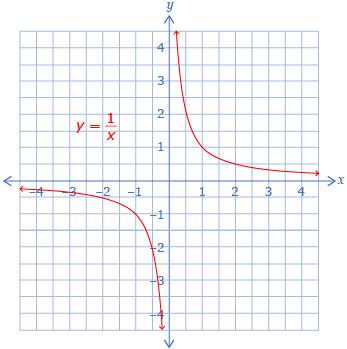
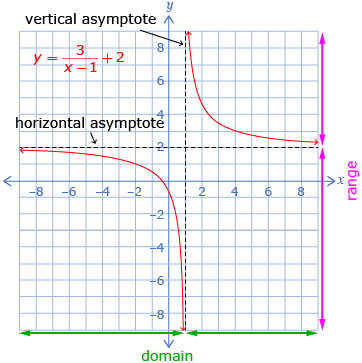
In Try This 2 you may have noticed that the rules of transformations apply to rational functions the same way they apply to the other functions you have worked with in this course. As an example, you explored a rational function of the form ![]() because it allows you to work with transformations relatively easily. Some characteristics of the graph of a function of the form
because it allows you to work with transformations relatively easily. Some characteristics of the graph of a function of the form ![]() are listed in the chart shown.
are listed in the chart shown.
Rational Functions of the Form |
|
| Vertical Stretch | There is a vertical stretch by a factor of a. |
| Horizontal Asymptote | The horizontal asymptote is translated k units up or down from the original location of y = 0. The horizontal asymptote is y = k. |
| Vertical Asymptote | The vertical asymptote is translated h units right or left from the original location of x = 0. The vertical asymptote is x = h. |
| Domain | The domain is any real number, except h. This restriction is because x = h (the vertical asymptote) will result in an undefined value. |
| Range | The range is any real number, except k. This restriction is because the horizontal asymptote is y = k. |
An example of a graph of a rational function ![]() follows.
follows.
1.7. Explore 3
Module 7: Rational Functions and Function Operations
Read “Example 2” on pages 434 to 435 to see an example of how a rational function can be graphed using transformations. As you read, pay attention to the important characteristics of the graph that are identified. Notice how the location of the asymptotes are also translated from their original location in ![]() .
.
Self-Check 1
- Complete Assessment Questions 1 to 4 in “Rational Functions.”
Screenshot reprinted with permission of ExploreLearning
- Complete questions 1, 3.c., 7.a., 7.c., and 8 on pages 442 and 443 of the textbook. Answer
1.8. Explore 4
Module 7: Rational Functions and Function Operations
So far, you have experimented with rational functions of the forms ![]() and
and ![]() In Try This 3 you will investigate graphing slightly more complex rational functions using transformations.
In Try This 3 you will investigate graphing slightly more complex rational functions using transformations.
Try This 3
- Carolina is planning on graphing the function
 by hand using transformations. She completes the following steps:
Explain why Carolina changed the format. - Although Carolina’s method is correct, the method will typically only work with rational functions that include a linear polynomial in the numerator and denominator. Describe two other methods you could use to graph the function

- Explain whether the methods you described in question 2 will allow you to graph the following rational functions:
-
- Graph the functions from question 3 using technology; then use your graphs to complete a table like the following.
Function

Non-permissible Value(s) Vertical Asymptote(s) Horizontal Asymptote(s) x-intercept(s) y-intercept(s) Domain Range End Behaviour
- Describe any similarities and/or patterns you notice between the graphs of the three functions.
- Graph the functions from question 3 using technology; then use your graphs to complete a table like the following.
Share 2
With a partner or group, discuss the following questions based on your graphs created in Try This 3.
- Describe why a graphing strategy that uses transformations may be more difficult to use for rational functions than some of the other functions used in this course.
- Compare the patterns you saw in question 4. Do you expect these patterns will hold for all rational functions? Explain.
![]() If required, save a record of your discussion in your course folder.
If required, save a record of your discussion in your course folder.
1.9. Explore 5
Module 7: Rational Functions and Function Operations
In Try This 3 you may have noticed that it is possible to graph a rational function in a variety of ways, just as you could with other functions. In general, it is a bit harder to use transformations to graph or interpret a rational function because there are so many different forms the function can take. For example, ![]() and
and ![]() are both rational functions, but neither can be written in the form
are both rational functions, but neither can be written in the form ![]() where a, h, and k are constants.
where a, h, and k are constants.
Technology or a table of values are typically good ways to accurately graph a rational function. If you are interested in only an approximation of the graph, you can make predictions about the graph’s characteristics and use these predictions to sketch the function. This idea will be explored further in Lesson 3.
Read “Example 3” on pages 435 to 437 of the textbook to see another example of how a rational function can be graphed. Keep in mind that the method of converting the function to the form ![]() cannot be used for most rational functions—you should consider this a special case.
cannot be used for most rational functions—you should consider this a special case.
Self-Check 2
1.10. Explore 6
Module 7: Rational Functions and Function Operations
In Try This 4 you will begin to explore how rational functions can be used to model real-life phenomena.
Try This 4

Photodisc/Thinkstock
Claire is planning a trip to Wood Buffalo National Park with her friend Ahmed. They decide to meet in Fort Chipewyan and enter the park from there. Claire lives in Calgary and Ahmed lives in North Battleford; both will have to travel 1000 km to reach Fort Chipewyan.
-
- Write the time it will take Claire to travel as a function of her speed.

- Claire estimates that she will stop for 4 h for breaks, fuel, food, and so on. Revise your function from question a. to incorporate this new data.
- Claire knows that Ahmed likes to move quickly. She expects that his average speed will be 10 km/h faster than hers and that he will stop for only 2 h. Write the time it will take Ahmed to travel as a function of Claire’s average speed, and explain what each part of the function represents. Explain how this function was determined.
- Write the time it will take Claire to travel as a function of her speed.
-
- What is a reasonable domain and range for each of these functions? Explain.
- Are there any non-permissible values for either the time or average speed? Explain.
-
- Graph the functions from questions 1.b. and 1.c.
- Explain how the characteristics of each graph are related to the driving plan for Claire and Ahmed.
![]() Save your responses in your course folder.
Save your responses in your course folder.
1.11. Explore 7
Module 7: Rational Functions and Function Operations
In Try This 4 you may have determined the original function ![]() The function that described Claire’s trip was
The function that described Claire’s trip was ![]() , and the function that described Ahmed’s trip was
, and the function that described Ahmed’s trip was ![]() . The functions for Claire’s and Ahmed’s trips could be graphed to help you see how much less time it would take for Ahmed to complete his trip compared to the time it would take for Claire to complete her trip.
. The functions for Claire’s and Ahmed’s trips could be graphed to help you see how much less time it would take for Ahmed to complete his trip compared to the time it would take for Claire to complete her trip.

Hemera/Thinkstock
Deciding between texting and talk plans for cellphones can be confusing. Read “Example 5” on page 439 of the textbook. Notice how the rational functions are determined for each texting plan to help you compare the average cost per text. Part of the solution is to graph the functions representing the texting plans; note how these graphs give a nice visual representation of the problem.
Self-Check 3
Add the term rational function to your copy of Glossary Terms.
1.12. Connect
Module 7: Rational Functions and Function Operations
Complete the Lesson 1 Assignment that you saved in your course folder at the beginning of this lesson. Show work to support your answers.
![]() Save your responses in your course folder.
Save your responses in your course folder.
Project Connection
Go to Module 7 Project: Shipping Wars, and read over all project requirements. Become familiar with what you will be doing and how you will be assessed.
Part 1 of the project will require all of the knowledge of rational expressions you will learn in this module. You may want to delay starting the project until you are more familiar with rational functions.
1.13. Lesson 1 Summary
Module 7: Rational Functions and Function Operations
Lesson 1 Summary
In this lesson you began to explore the graphs of rational functions. Making a table of values, using technology, or using transformations can be good strategies for graphing rational functions. Be careful when using transformations, as some rational functions are hard to interpret this way.
Many rational functions have non-permissible values. Sometimes these will show up as asymptotes on graphs. In the next lesson you will explore when asymptotes and holes, another type of discontinuity, occur in rational graphs.