Lesson 6
| Site: | MoodleHUB.ca 🍁 |
| Course: | Math 30-1 SS |
| Book: | Lesson 6 |
| Printed by: | Guest user |
| Date: | Saturday, 27 December 2025, 2:09 AM |
Description
Created by IMSreader
1. Lesson 6
Module 7: Rational Functions and Function Operations
Lesson 6: Composition of Functions
Focus
iStockphoto/Thinkstock |
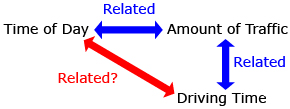 |

In a large city, suppose that a delivery truck regularly drives between a furniture store and a warehouse. The length of time required to make the trip depends on the amount of traffic on the streets. The amount of traffic depends on the time of day.
Clearly, there is a relationship between the length of driving time and the time of day. How can the relationship between driving time and amount of traffic and the relationship between amount of traffic and time of day be used to describe the relationship between driving time and time of day?
In this lesson you will explore how one function can be used as the input for another function. This process is called a composition of functions.
Lesson Outcomes
At the end of this lesson you will be able to
- determine the composition of two functions
- determine the equation of a composite function
- sketch the graph of a composite function
Lesson Question
You will investigate the following question:
- How can the composition of functions be used to simplify problems?
Assessment
Your assessment may be based on a combination of the following tasks:
- completion of the Lesson 6 Assignment (Download the Lesson 6 Assignment and save it in your course folder now.)
- course folder submissions from Try This and Share activities
- additions to Glossary Terms and Formula Sheet
- work under Project Connection
1.1. Discover
Module 7: Rational Functions and Function Operations
Discover
Try This 1

dog: iStockphoto/Thinkstock; alpaca: Ingram Publishing/Thinkstock;
cat: iStockphoto/Thinkstock; gerbil:iStockphoto/Thinkstock
The following table defines the function P(s), which outlines what pets are owned by students.
The student ______ |
owns a pet ______. |
| Dennis | gerbil |
| Faustine | cat |
| Hyunji | llama |
| Maia | dog |
| Norwood | bird |
| Teresa | dog |
| Ronaldo | horse |
This table defines the function F(p), which gives the food eaten by different pets.
A pet ______ |
likes to eat _____. |
| gerbil | seeds |
| cat | cat kibble |
| llama | hay |
| dog | dog kibble |
| bird | seeds |
| horse | hay |
-
- Give a function, B(s), that shows the type of pet food each student should buy.
- Draw a diagram to show the relationship between P(s), F(p), and B(s).
- What type of input and output would you expect for each of P(s), F(p), and B(s)? The following table may help organize your thinking.
Function
Input Type
Output Type P(s) student
F(p) B(s)
- Describe why B(s) can be thought of as F(P(s)).
- Determine the domain and range for P(s), F(p), and B(s).

![]() Save your responses in your course folder.
Save your responses in your course folder.
Share 1
With a partner or group, discuss the following question based on the information from Try This 1:
The function F(P(s)) represents the food a student should buy. Explain what the function P(F(p)) represents and why it has no meaning in this context. ![]()
![]() If required, save a record of your discussion in your course folder.
If required, save a record of your discussion in your course folder.
1.2. Explore
Module 7: Rational Functions and Function Operations
Explore
In Try This 1 you combined P(s), a function that gave you a pet type given a student, and F(p), a function that gave you a food given a pet type. This combination gave the composite function, B(s), a function that gave the type of food to buy given a student. Combining functions this way is called a composition of functions. A composition of functions can be thought of as using the output of one function as the input of another function. In Try This 1 the output “pet” was used as an input to determine the food type. The following diagram shows how the functions from Try This 1 are related:
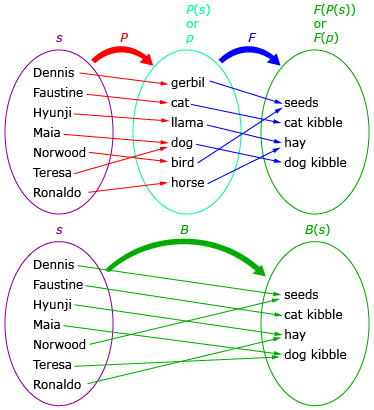
Three separate functions are shown, P, F, and B. These functions represent relationships between students, pets, and pet food. The s represents students; P(s) and p are both representations of pets, where P(s) is the type of pet determined from the student. F(P(s)), F(p), and B(s) all represent types of pet food, where F(P(s)) and B(s) are the type of pet food determined from a student, and F(p) is the type of food determined from the pet. Notice that F(P(s)) and B(s) have an equivalent meaning.
The most important thing to notice in the previous diagram is that F(P(s)) and B(s) are equivalent. Both F(P(s)) and B(s) represent the type of food to buy given the student. F(P(s)) is a composition of F(p) and P(s), so the output of P(s) (a pet type) is an input for F(p).
It is important to pay attention to the type of input for a function. For example, F(s) is not meaningful because F requires an input of a pet type and s is a student.
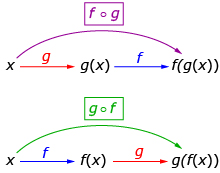
Sometimes a composition f(g(x)) is written ![]() This can be read as “f composed with g at x” or “f at g at x” or “f circle g at x.” In Try This 2 you will compose functions that are equations. Notice that the input and output for both functions are real numbers.
This can be read as “f composed with g at x” or “f at g at x” or “f circle g at x.” In Try This 2 you will compose functions that are equations. Notice that the input and output for both functions are real numbers.
The composition ![]() is different than the multiplication (f • g)(x):
is different than the multiplication (f • g)(x):
![]() and (f • g)(x) = f(x)g(x)
and (f • g)(x) = f(x)g(x)
Try This 2
Consider the functions f(x) = 3x + 1 and ![]()
- Determine the following:
- g(16)
- f(4)
- f(g(16))

- g(f(16))
- f(g(x))
- g(f(x))
- Explain what f(f(3)) represents. Determine f(f(3)).
-
- Determine the domain and range of f(x) and g(x).
- Explain what you expect the domain of f(g(x)) to be.
- Explain what you expect the range of f(g(x)) to be.
-
- Graph f(x), g(x), and f(g(x)).
- Does the graph you produced in question 4.a. match the domain and range you predicted in question 3?
![]() Save your responses in your course folder.
Save your responses in your course folder.
Share 2
With a partner or group, discuss the following question based on the information in Try This 2:
Compare and contrast ![]() and
and ![]() . Are they equivalent?
. Are they equivalent?
![]() If required, save a record of your discussion in your course folder.
If required, save a record of your discussion in your course folder.
1.3. Explore 2
Module 7: Rational Functions and Function Operations
In Try This 2 you may have noticed a composition of functions that are equations can be determined using substitution. For the functions f(x) = 3x + 1 and ![]()
and
You may have also noticed that (f(g(x)) is not the same as (g(f(x)). Watch Composition of Functions to see the difference.
Read “Example 1” on pages 501 and 502 of the textbook. Pay attention to the two methods used to evaluate a composite function.
Self-Check 1
1.4. Explore 3
Module 7: Rational Functions and Function Operations
When determining the domain and range of a composition of functions, you need to pay attention to what happens at each step.
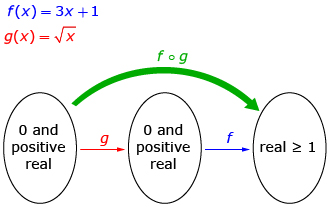
The function ![]() can use only an input of 0 or positive real numbers and can give only an output of 0 or positive real numbers, so its domain is x ≥ 0 and its range is g(x) ≥0. Using 0 or positive real numbers, the function f(x) = 3x + 1 can give only an output of real numbers greater than or equal to 1. Thus, the domain of (f o g)(x) is x ≥ 0 and the range is (f o g)(x) ≥1.
can use only an input of 0 or positive real numbers and can give only an output of 0 or positive real numbers, so its domain is x ≥ 0 and its range is g(x) ≥0. Using 0 or positive real numbers, the function f(x) = 3x + 1 can give only an output of real numbers greater than or equal to 1. Thus, the domain of (f o g)(x) is x ≥ 0 and the range is (f o g)(x) ≥1.
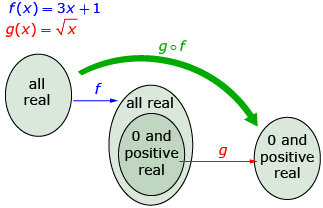
The function f(x) = 3x + 1 has a domain of any real number and a range of any real number. However, the function ![]() can use only 0 and positive real numbers as an input and will give only 0 and positive real numbers as an output. Thus, the domain of
can use only 0 and positive real numbers as an input and will give only 0 and positive real numbers as an output. Thus, the domain of ![]() is limited to x-values that will give f(x) ≥ 0 and is
is limited to x-values that will give f(x) ≥ 0 and is ![]() The range of
The range of![]() is
is ![]()
Read “Example 2” on pages 502 and 503 of the textbook to see another example of how the domain and range can be determined for a composition of functions. Note how any domain restrictions on the inner function as well as the outer function must be taken into consideration and combined to get the domain of the composite function.
Self-Check 2
1.5. Explore 4
Module 7: Rational Functions and Function Operations
In Try This 3 you will explore how a composite function can be used to solve a problem.
Try This 3
Recall the scenario from the beginning of the lesson where a delivery truck regularly travels across a large city from its store to its warehouse. Suppose that someone tries to model this scenario and produces the following three graphs:
This is Graph 1.
This is Graph 2.
This is Graph 3.
-
- Describe the information Graph 1 contains. How does its shape relate to the scenario?
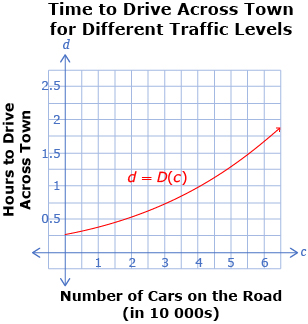
- Describe the information Graph 2 contains. How does its shape relate to the scenario?
- Use Graphs 1 and 2 to determine the time taken to drive across town at the following times:
- 2 h after midnight

- 8 h after midnight
- 24 h after midnight
- 2 h after midnight
- Use Graphs 1 and 2 to determine a time after midnight when it would take 1 h to travel across town.
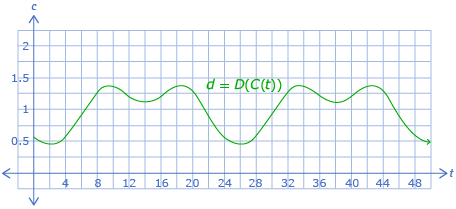
- Graph 3 shows the composition of the function in Graph 2 with the function in Graph 1.
- What information does Graph 3 contain? How does its shape relate to the scenario?
- Give Graph 3 an appropriate title and label the horizontal and vertical axes.
-
- Explain how Graph 3 can be used to determine the times from question 2.
- Explain how Graph 3 can be used to determine the time from question 3.
- Explain how Graph 3 could be drawn using Graphs 1 and 2.
![]() Save your responses in your course folder.
Save your responses in your course folder.
Share 3
With a partner or group, discuss the following questions based on the information in Try This 3.
- Describe any advantages or disadvantages of using a composition of functions to model the scenario in Try This 3.
- Explain how realistic you feel the model in Try This 3 is. Describe any problems you see with the model.
![]() If required, save a record of your discussion in your course folder.
If required, save a record of your discussion in your course folder.
1.6. Explore 5
Module 7: Rational Functions and Function Operations

Goodshoot/Thinkstock
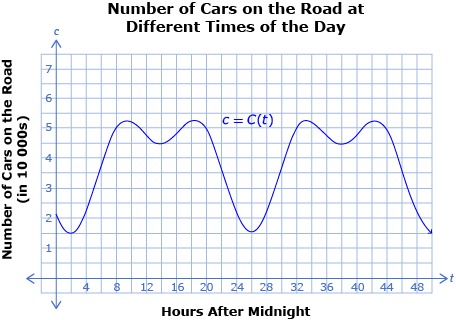
In Try This 3 you may have noticed that it is possible to use the graphs of functions to interpret a composition of those functions. One method of using graphs of functions to interpret the composite function is to work through each function separately.
For example, to find the driving time d, first determine the congestion C (which is number of cars on the road) at a specific time t (which is the number of hours after midnight). Then use the value of congestion to determine the driving time. Using function notation, the function d = D(C(t)) can be found by starting at a t-value and using c = C(t) to determine a c-value. The c-value is then used to determine the d-value using d = D(c).
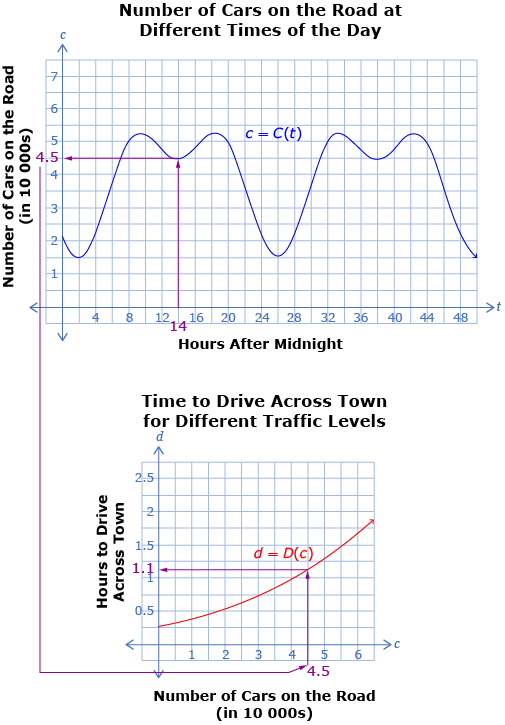
Here, a t-value of 14 h after midnight is used to determine a c-value of 4.5 number of cars.
This c-value is then used to determine a d-value of 1.1 h to drive across town.
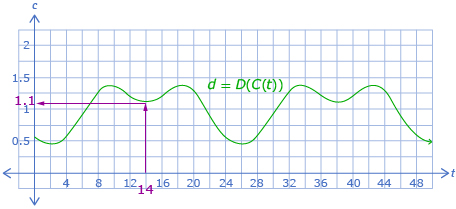
If a graph of the composite function is available, it is possible to determine the information from the previous graph in one step.
This relationship can be used to determine the graph of f(g(x)) using the graphs of f(x) and g(x) by determining the points one at a time. However, an easier way to determine a graph is to use equations if they are available. The equations of f(x) and g(x) can then be used to determine an equation for f(g(x)), which can then be plotted, as you did earlier in the lesson.
If you would like to see another example that uses the graphs of functions and their composition, read “Example 3” on pages 503 and 504 of the textbook.
To look at another example of how a problem can be solved using a composition of functions, read “Example 5” on pages 505 and 506 of the textbook. Note how the two formulas are composed before the value of V is substituted in to be solved in one step instead of two.
1.7. Explore 6
Module 7: Rational Functions and Function Operations
Self-Check 3
Add the following terms to your copy of Glossary Terms:
- composition of functions
- composite function
Add the following formula to your copy of Formula Sheet:
1.8. Connect
Module 7: Rational Functions and Function Operations
Complete the Lesson 6 Assignment that you saved in your course folder at the beginning of this lesson. Show work to support your answers.
![]() Save your responses in your course folder.
Save your responses in your course folder.
Project Connection
You are now ready to apply your understanding of function operations. Go to Module 7 Project: Shipping Wars, and complete Part 2 and the Conclusion.
![]() Save your responses in your course folder.
Save your responses in your course folder.
You will submit your assignment from the Module 7 Project to your teacher once you have completed the project.
1.9. Lesson 6 Summary
Module 7: Rational Functions and Function Operations
Lesson 6 Summary
Functions can be combined using a composition of functions. The composite function f(g(x)) can be thought of as g(x) being used as an input for f(x). The notation (f o g)(x) is often used instead of f(g(x)). Care needs to be taken when composing functions to make sure the output of the first function is a valid input into the second function.