Lesson 6
| Site: | MoodleHUB.ca 🍁 |
| Course: | Math 30-1 SS |
| Book: | Lesson 6 |
| Printed by: | Guest user |
| Date: | Tuesday, 9 December 2025, 11:17 PM |
Description
Created by IMSreader
1. Lesson 6
Module 4: Foundations of Trigonometry
Lesson 6: Graphing and Transforming Sine and Cosine Functions 1
Focus

iStockphoto/Thinkstock

iStockphoto/Thinkstock
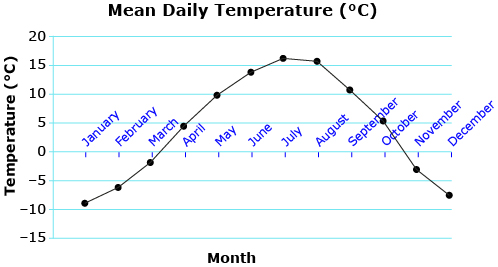
Many natural phenomena are cyclical; they repeat the same pattern over and over. Consider the mean daily temperature in Calgary. You expect warmer temperatures in the summer and then cooler temperatures in the winter, and the cycle repeats. Temperature versus time can be plotted for many years. How would you describe the shape of the graph that follows? What are the domain and range of the graph, and what do the domain and range represent?
|
 |
||||||||||||||||||||||||||||
In this lesson you will learn the general shape of a sine and cosine function and how these functions are related to the unit circle. You will also discover the relationship between the equation of a sine or cosine function and the period and amplitude of each function.
Lesson Outcomes
At the end of this lesson you will be able to
- sketch the graph of functions of the form y = a sin(bx) and y = a cos(bx)
- determine the amplitude, period, domain, and range of a sine or cosine function
- explain how the values of a and b affect the graphs of y = a sin(bx) and y = a cos(bx)
- determine the values of a and b given the graph of a function of the form y = a sin(bx) and y = a cos(bx)
Lesson Questions
You will investigate the following questions:
- How can the functions y = sin x and y = cos x be represented graphically?
- How do the parameters a and b of a trigonometric function affect the shape of the corresponding graph?
Assessment
Your assessment may be based on a combination of the following tasks:
- completion of the Lesson 6 Assignment (Download the Lesson 6 Assignment and save it in your course folder now.)
- course folder submissions from Try This and Share activities
- additions to Glossary Terms and Formula Sheet
1.1. Discover
Module 4: Foundations of Trigonometry
Discover
Try This 1
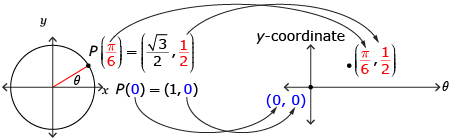
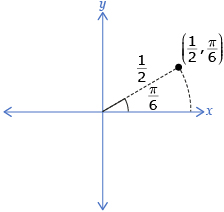
Take out the unit circle you made in Lesson 3: Try This 4. You were able to use this diagram to visualize angles and determine some trigonometric ratios. Another way to visualize some of the same information is to plot a graph of the y-coordinate of the intersection of the terminal arm and the unit circle, P(x, y), versus the angle θ of the terminal arm. Consider these examples:
- When θ = 0, the y-coordinate of P is 0, so the point (0, 0) is plotted. (shown as blue in diagram)
- When
 the y-coordinate of P is
  so the point
  is plotted. (shown as red in diagram)
Open Table and Graph Template.
- Complete the table for all angles on the unit circle you produced in Lesson 3: Try This 4.
- Graph the angle θ against the y-coordinate using the labelled axis provided.
![]() Save your completed copy of Table and Graph Template in your course folder.
Save your completed copy of Table and Graph Template in your course folder.
Share 1
With a partner or group, discuss the following questions based on your graph created in Try This 1.
- What is the shape of the graph you produced?
- Could you extend this pattern for angles larger than 2π? If so, predict the shape of the graph.
- Could you extend this pattern for angles less than 0? If so, predict the shape of the graph.
![]() If required, place a record of your discussion in your course folder.
If required, place a record of your discussion in your course folder.
1.2. Explore
Module 4: Foundations of Trigonometry
Explore
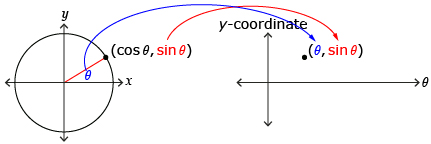
In Discover you plotted the points (θ, y-coordinate of P(x, y)) where P is the intersection of the terminal arm and the unit circle. You may recall from Lesson 4 that the y-coordinate of P(x, y) corresponds to sin θ if P is on the unit circle. This means the points you plotted in Discover are (θ, sin θ) or the function y = sin θ. A similar process can be used to produce a graph of y = cos θ. As in previous modules, y = sin θ and y = cos θ can also be represented using function notation as f(x) = sin θ and f(x) = cos θ.
Try This 2
Use Cosine Table and Graph Template to respond to the following questions.
- Fill in Cosine Table and Graph Template for y = cos θ.
- Graph y = cos θ using the labelled axis provided.
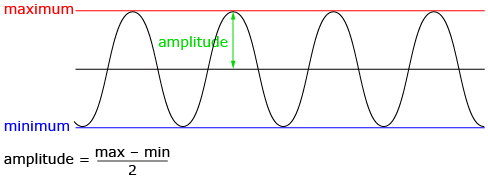
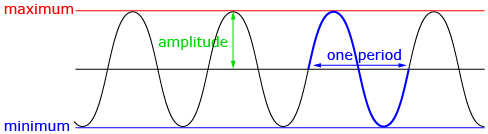
- What are the maximum and minimum values?
- Half the distance between the maximum and minimum value is called the amplitude. What is the amplitude for y = cos θ?

-
Label the y-intercept.
-
What is the range of the graph?
![]() Save your copy of Cosine Table and Graph Template in your course folder.
Save your copy of Cosine Table and Graph Template in your course folder.
Share 2
With a partner or group, discuss the following questions based on the graph you created in Try This 2.
- How is the graph of y = cos θ that you produced similar to the graph of y = sin θ from Discover? How are the graphs different?
- What is the amplitude of y = sin θ from Try This 1?
![]() If required, place a record of your discussion in your course folder.
If required, place a record of your discussion in your course folder.
1.3. Explore 2
Module 4: Foundations of Trigonometry
When sketching a graph, be sure to remember these steps:
- Label your axes.
- Show a scale on both the x- and y-axes.
- Plot some points, and then use those points to sketch a smooth curve.
- Try to fill up most of the space available.
- Show at least one full cycle.
Self-Check 1
- Determine the amplitude of the following graph. Answer
- Draw a cosine graph with an amplitude of 5. Answer

iStockphoto/Thinkstock
In Try This 2 you looked at the general shape of a cosine function and focused on some of the cosine’s vertical characteristics. You will next look at some of the horizontal characteristics of the graphs of sine and cosine functions.
Try This 3
- Use Unit Circle to Graph to plot the sine and cosine function.
- How do your graphs from Try This 1 and Try This 2 compare to these graphs?
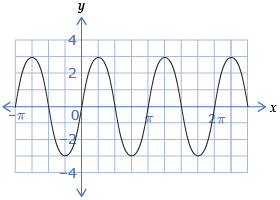
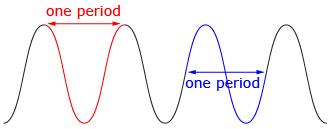
- Turn on only the sine function. As the value of θ increases, the graph begins to repeat itself in a regular manner. A function that repeats itself in this way is called a periodic function. The period of a function is the horizontal length of one cycle on a periodic graph. What is the period of the graph y = sin θ in radians and degrees?
- What are the θ-intercepts, or zeros, of y = sin θ?
- What is the period of the graph y = cos θ in radians and degrees?
- What are the θ-intercepts, or zeros, of y = cos θ?
![]() Save your responses in your course folder.
Save your responses in your course folder.
1.4. Explore 3
Module 4: Foundations of Trigonometry
You may have noticed that both y = sin θ and y = cos θ have a period of 2π, or 360°, and both have regular θ-intercepts that are ![]() apart. This pattern continues infinitely for both positive and negative values of θ.
apart. This pattern continues infinitely for both positive and negative values of θ.
Self-Check 2
- Estimate the period and amplitude of the graph Mean Daily Temperature (°C).

Answer
![]()
-
Complete questions 10.a., 10.c., and 14 on pages 234 and 235 of the textbook. Answer
You have begun to see how the graphs of y = sin x and y = cos x are related. Now you will look at transforming these functions.
Try This 4
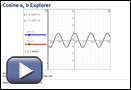
A family of functions similar to y = sin x can be represented by the equation y = a sin (bx), where a and b are constants. Use Sine a, b Explorer and Cosine a, b Explorer to investigate how changing these parameters will change the graph of y = sin x and to answer the questions that follow.
- Record your observations in a table like the one shown as you explore Sine a, b Explorer. Select the check boxes in Sine a, b Explorer to easily see amplitude, period, and the original y = sin x.
Value of a or b Changes to Graph Sketch Amplitude Period Increase a. Decrease a. Return a to 1. Increase b. Decrease b.
- Now use Cosine a, b Explorer to investigate how changing the parameters a and b changes the graph of y = a cos(bx). Record your observations in a table like the one shown.
Value of a or b Changes to Graph Sketch Amplitude Period Increase a. Decrease a. Return a to 1. Increase b. Decrease b.
- Find a numeric relationship between a and the amplitude.
- Use your rule to determine the amplitude if a = 27.
- Use your rule to determine a if the amplitude is
 .
. - Find a numeric relationship between b and the period.

- Use your rule to determine the period if b = π.
- Use your rule to determine b if the period is 60.
![]() Save your tables and responses in your course folder.
Save your tables and responses in your course folder.
Share 3
With a partner or in a group, discuss the following questions:
- How do the rules that you determined in Try This 4 compare?
- How are these rules related to the transformations you learned in Module 1?
![]() If required, save a record of your discussion in your course folder.
If required, save a record of your discussion in your course folder.
1.5. Explore 4
Module 4: Foundations of Trigonometry
In Try This 4 you explored the relationship between a and the amplitude of the function, and the relationship between b and the period of the function.
You may have found that |a| = amplitude of the function and ![]() This means that period
This means that period ![]() In this course, b-values will always be positive. However, the absolute-value signs are necessary for negative b-values. Think of why the absolute value is required.
In this course, b-values will always be positive. However, the absolute-value signs are necessary for negative b-values. Think of why the absolute value is required.
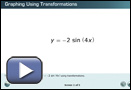
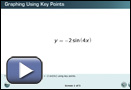
Graphing the functions y = a sin(bx) and y = a cos(bx) can be completed in many ways. In Try This 4 you saw a relationship between the parameters a and b and the dimensions of the graph. You can also use technology, such as a graphing calculator, like you did with other functions. You could also use transformations or key points to graph these functions. Watch examples of these methods in Graphing Using Transformations and Graphing Using Key Points.
Self-Check 3
Complete questions 1, 4.a., 4.b., 6.a., 6.b., 7.a., 7.c., 8.a., 8.c., and 18 on pages 233 to 236 of the textbook. Answer
Add the following terms to your copy of Glossary Terms:
- periodic function
- period
- amplitude
Add the following formulas to your copy of Formula Sheet:
y = a sin(bx)
y = a cos(bx)
![]()
![]()
1.6. Connect
Module 4: Foundations of Trigonometry
Complete the Lesson 6 Assignment that you saved in your course folder at the beginning of the lesson. Show work to support your answers.
![]() Save your work in your course folder.
Save your work in your course folder.
Project Connection
There is no Project Connection in this lesson.
Going Beyond
Polar Coordinates
If r is negative, the point reflects across the origin.
Source: Pre-Calculus 12. Whitby, ON: McGraw-Hill Ryerson, 2011.
Reproduced with permission.
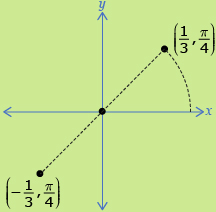
Another way of representing trigonometric functions is to use polar coordinates. In this system the coordinates (r, θ) represent a radius and an angle of rotation. In the first diagram, the radius of the terminal arm is ![]() and the angle is
and the angle is ![]() Use the table of values you created in Try This 2 to plot r = sin θ on a polar grid.
Use the table of values you created in Try This 2 to plot r = sin θ on a polar grid.
Use the following polar grid to create your graph of r = sin θ.
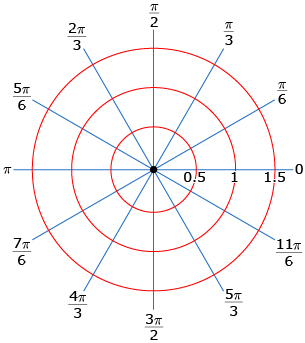
Use Polar Functions Explorer to check your graph.
1.7. Lesson 6 Summary
Module 4: Foundations of Trigonometry
Lesson 6 Summary
There are many ways to visually represent trigonometric functions. One of the most useful representations is a graph on a Cartesian plane. The sine and cosine functions have the same shape, and both can be transformed in the same manner as other functions.
The amplitude of a sinusoidal function is half the distance between the minimum and maximum value of the graph. The value of the amplitude is equal to the parameter a and can be found using ![]()
The period of a periodic function is the horizontal distance taken to complete one graph cycle. The period is related to the parameter b by the equation ![]() where P is the period.
where P is the period.
In Lesson 7 you will explore two other characteristics of a sinusoidal graph in addition to amplitude and period. In Module 5 you will begin to explore modelling cyclic behavior, such as the height of a mark on a bicycle tire over time. Think of the shape this graph will take.