Lesson 5
| Site: | MoodleHUB.ca 🍁 |
| Course: | Math 30-1 SS |
| Book: | Lesson 5 |
| Printed by: | Guest user |
| Date: | Saturday, 27 December 2025, 2:07 AM |
Description
Created by IMSreader
1. Lesson 5
Module 7: Rational Functions and Function Operations
Lesson 5: Multiplying and Dividing Functions
Focus
iStockphoto/Thinkstock
As a jet flies, the rate that the plane uses fuel changes. One of the main factors for the change is the amount of fuel carried. Fuel is used up as the jet flies, so the jet gets lighter and uses less fuel. Finding a way to determine the average rate that fuel is used from the beginning of a flight to a given point in the flight can be useful when comparing aircraft efficiency.
In this lesson you will explore how functions can be multiplied and divided and how this information can be used to solve problems.
Lesson Outcomes
At the end of this lesson you will be able to
- multiply and divide functions
- determine the domain and range of the product or quotient of functions
Lesson Question
You will investigate the following question:
- How can functions be multiplied or divided?
Assessment
Your assessment may be based on a combination of the following tasks:
- completion of the Lesson 5 Assignment (Download the Lesson 5 Assignment and save it in your course folder now.)
- course folder submissions from Try This and Share activities
- additions to Formula Sheet
1.1. Discover
Module 7: Rational Functions and Function Operations
Discover
Try This 1
Consider the functions f(x) = x + 1 and g(x) = −x + 3.
- Predict what the graph of p(x) = (fg)(x) will look like. Explain how you made this prediction.

- Predict what the graph of
 will look like. Explain how you made this prediction.
- Predict what the graph of p(x) = (fg)(x) will look like. Explain how you made this prediction.
-
- Use Multiply and Divide Functions to graph p(x) and q(x) and to check your predictions. Save screen captures of your two graphs.
- Explain how the graph of p(x) is related to the graphs of f(x) and g(x).
- Explain how the graph of q(x) is related to the graphs of f(x) and g(x).
- Use Multiply and Divide Functions to graph p(x) and q(x) and to check your predictions. Save screen captures of your two graphs.
-
- Use the equations of f(x) and g(x) to write an equation for p(x) and for q(x) in terms of x. Explain how you determined equations for p(x) and q(x).
- Are there any restrictions on x for p(x) or q(x)? Explain.
- Do the graphs of the equations you determined match the graphs from Multiply and Divide Functions? Should they?
- Can the domain of p(x) or q(x) be determined from f(x)and g(x)? If so, explain how.
![]() Save your responses in your course folder.
Save your responses in your course folder.
Share 1
With a partner or group, discuss the following questions based on the information in Try This 1.
- How are multiplying and dividing functions similar? How are they different?
- Compare multiplying and dividing functions to adding and subtracting functions. Describe both similarities and differences.
![]() If required, save a record of your discussion in your course folder.
If required, save a record of your discussion in your course folder.
1.2. Explore
Module 7: Rational Functions and Function Operations
Explore
Multiplying and dividing functions is a straightforward process that is similar to adding or subtracting functions. In Try This 1 you found p(x) = (fg)(x) and ![]() Your calculations and domain explanations may have been similar to what is shown.
Your calculations and domain explanations may have been similar to what is shown.
Domain →
Use the x-values where both f(x) and g(x) are defined.
|
where g(x) ≠ 0 and so x ≠ 3
Domain →
g(x) ≠ 0; use the x-values where both f(x) and g(x) are defined, less any value that makes g(x) = 0. |
Determining the range of p(x) = (fg)(x) or ![]() g(x) ≠ 0 can be more difficult. This can often be interpreted from the graph of the function.
g(x) ≠ 0 can be more difficult. This can often be interpreted from the graph of the function.
To see another example of how functions can be multiplied, review “Example 1” on pages 490 and 491 of the textbook. To review an example of dividing functions, read “Example 2” on pages 491 to 493. Note how non-permissible values are identified once the f(x) and g(x) functions have been substituted into h(x).
Self-Check 1
Complete questions 1.a., 1.c., 6.b., 6.c., 7.b., 7.c., 8.b., and 8.c. on page 496 of the textbook. Answer
1.3. Explore 2
Module 7: Rational Functions and Function Operations
Interpreting graphs when multiplying or dividing functions is similar to interpreting graphs when adding or subtracting functions. Try This 2 explores this idea further.
Try This 2
Open Lesson 5 Printable Template. Either make a sketch of the graph or print the graph to complete the following activity.
- Use the graph to sketch h(x) = (fg)(x). Explain the procedure you used.
- Predict where any vertical asymptotes for
 and
and  will occur. How are these asymptotes related to the non-permissible values of p(x) and q(x)?
- Sketch p(x) and q(x).
- What type of functions are h(x), p(x), and q(x)? Explain.
- State the domain for h(x), p(x), and q(x).
![]() Save your responses in your course folder.
Save your responses in your course folder.
1.4. Explore 3
Module 7: Rational Functions and Function Operations
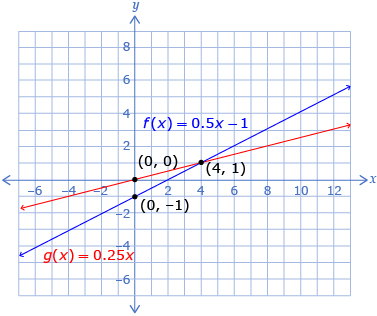
In Try This 2 you may have found that multiplying and dividing functions using their graphs follows a process similar to that of adding and subtracting functions using their graphs. Again, you can pick a point on each function with the same x-value and multiply or divide the y-values. Dividing Functions shows how to determine the graph of ![]() from Try This 2.
from Try This 2.
In Try This 2 you also saw that it is possible to predict the type of function produced by a multiplication or division of functions:
- h(x) is a quadratic polynomial function because it is the product of two linear functions.
- p(x) is a rational function because it is the quotient of two linear functions.
- q(x) is a rational function because it is the quotient of two linear functions.
If you would like to see another example of how functions can be divided, read “Example 2” on pages 491 to 493 of the textbook. Otherwise, try Self-Check 2.
Self-Check 2
Complete questions 2, 3, 4.a., 5.b., and 9 on page 496 of the textbook. Answer
1.5. Explore 4
Module 7: Rational Functions and Function Operations
In Try This 3 you will apply your understanding of multiplying and dividing functions to a problem that involves jet fuel.

F1online/Thinkstock
Try This 3
Suppose that the volume of fuel a jet has used from the time it reaches its cruising altitude to time t is given by the function f(t) = 15 500t − 250t2, where f(t) is measured in litres and t is in hours. The distance the plane has travelled t hours after reaching its cruising altitude is d(t) = 900t, where d(t) is measured in kilometres.
- Determine a function, r(t), that gives the average rate of fuel use per kilometre for the cruising portion of the trip after t hours.

- If the cruising portion of the trip is expected to take 15 h, determine the domain and range of f(t), d(t), and r(t).
-
- Determine the average rate of fuel use per kilometre after 3 h and after 12 h.
- Explain the difference seen in question a.
- At what time is the average rate of fuel use 15.4 L/km?
![]() Save your responses in your course folder.
Save your responses in your course folder.
Share 2
With a partner or group, discuss the following questions based on the information in Try This 3.
- Why is r(t) meaningless when t = 0 in terms of the scenario?
- Why would question 4 of Try This 3 have been difficult if you didn’t use the quotient function r(t)?
![]() If required, save a record of your discussion in your course folder.
If required, save a record of your discussion in your course folder.
1.6. Explore 5
Module 7: Rational Functions and Function Operations
Read “Example 3” on pages 493 to 495 of the textbook. How did the product and quotient functions used to solve this problem compare to your solutions from Try This 3?
Self-Check 3
- Complete “Your Turn” from “Example 3” on page 495 of the textbook. Answer
- Complete question 12 on page 497. Answer
Add the following formulas to your copy of Formula Sheet:
- (f • g)(x) = f(x)g(x)
1.7. Connect
Module 7: Rational Functions and Function Operations
Complete Lesson 5 Assignment that you saved in your course folder at the beginning of this lesson. Show work to support your answers.
![]() Save your responses in your course folder.
Save your responses in your course folder.
Project Connection
There is no Project Connection in this lesson.
Going Beyond

© Horst Schmidt/26802253/Fotolia
Mathematical modelling is a way to describe a real-life situation in a simplified way. Real-life systems are typically made up of many complex parts that often cannot be entirely accounted for in a mathematical model. Consider the braking distance equation d = kv2, where k is a constant representing friction and v represents the vehicle velocity. This model doesn’t account for a road that is not level, wind gusts, driving through mud or snow, or various other conditions that affect the stopping length.
Consider some of the models you have looked at in this course, such as the average fuel use of a jet in this lesson. What things do the models seem to account for, and what seems to be missing? Can you think of a way to improve any of the models you have viewed?
1.8. Lesson 5 Summary
Module 7: Rational Functions and Function Operations
Lesson 5 Summary
In this lesson you saw that it is possible to add and subtract functions. The notation h(x) = (fg)(x) is equivalent to h(x) = (fx)g(x), and ![]() is equivalent to
is equivalent to ![]() To multiply functions using their graphs, multiply the y-coordinates for any x-coordinate. Similarly, to divide functions using their graphs, divide the y-coordinates for any x-coordinate.
To multiply functions using their graphs, multiply the y-coordinates for any x-coordinate. Similarly, to divide functions using their graphs, divide the y-coordinates for any x-coordinate.
When dividing functions, remember that there is a restriction on the domain where the function in the denominator equals zero. The range of the combined function can be determined from the graph of the combined function.
So far, you have usually seen a number or variable as the input for a function. In Lesson 6 you will explore how a function can be the input for a function.