Lesson 3
| Site: | MoodleHUB.ca 🍁 |
| Course: | Math 30-1 SS |
| Book: | Lesson 3 |
| Printed by: | Guest user |
| Date: | Tuesday, 9 December 2025, 10:34 PM |
Description
Created by IMSreader
1. Lesson 3
Module 1: Function Transformations
Lesson 3: Stretches
Focus

iStockphoto/Thinkstock
Have you ever been to an amusement park with those crazy mirrors that make you look funny? When the mirror curves inward (is concave), it makes a person look elongated and thinner. The convex mirror bulges outward and results in a short and wide stature. Similar kinds of distortions can take place as you work with transformations.

iStockphoto/Thinkstock
Look at the photos. The lower right photo was distorted to produce the other two. What is similar about the three photos? How could you create either distortion without using a computer? When is it useful to distort a photo in these ways?
In this lesson you will learn to stretch a function horizontally and vertically. You will also learn to relate a graph to the corresponding equation of the form y = af(bx).
Lesson Outcomes
At the end of this lesson you will be able to
- compare graphs of the form y = af(bx) to the graph y = f(x) and generalize a rule about a and b
- sketch a graph of a function of the form y = af(bx) given the graph of y = f(x) and the values of a and b
Lesson Questions
You will investigate the following questions:
- How are the graphs of the functions y = f(x) and y = af(bx) related?
- How can you graph the function y = af(bx) given y = f(x)?
Assessment
Your assessment may be based on a combination of the following tasks:
- completion of the Lesson 3 Assignment (Download the Lesson 3 Assignment and save it in your course folder now.)
- course folder submissions from Try This and Share activities
- additions to Glossary Terms and Formula Sheet
Materials and Equipment
- graph paper
1.1. Discover
Module 1: Function Transformations
Discover
Try This 1
- On a piece of graph paper, plot the following function. You can use Grid Paper Template, available in the Toolkit, if you like.
- Use the original function from question 1 to draw each mapping from the following table. Use a different colour for each mapping or drawing to make your graph(s) easier to read.
Mapping
Image Points
Description of How the Graph Transformed
Diagram of Transformation
(x, y) → (3x, y)
(x, y) → (
 x, y)
x, y)(x, y) → (x, 4y)
(x, y) → (x,
 y)
y)(x, y) → (−2x, y)
(x, y) → (x, −3y)
-
- What effect does multiplying all x-coordinates by a positive constant have on the figure?
- What effect does multiplying all y-coordinates by a positive constant have on the figure?
- Repeat questions 1 and 2 by using the following function.
- Revisit question 3. Are your answers still the same?
![]() Save your work in your course folder.
Save your work in your course folder.
Share 1
With a partner or group, discuss the following questions based on the information from Try This 1.
- How does the graph change when the x-coordinate is multiplied by a value
- greater than 1?
- between 0 and 1?
- that is negative?
- How would your answers from question 1 change for a y-coordinate?
![]() If required, save a record of your discussion in your course folder.
If required, save a record of your discussion in your course folder.
1.2. Explore
Module 1: Function Transformations
Explore
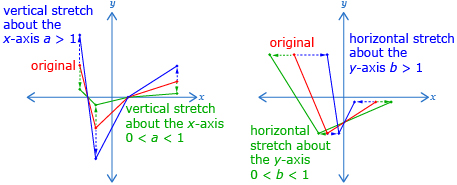
In Try This 1 you explored what happened to the shape of a graph when you multiplied all of the x-coordinates of a function by a constant or when you multiplied all of the y-coordinates by a constant. The change in shape seen is called a stretch. In this lesson you will focus on stretches about the x-axis or the y-axis. When you're stretching about an axis, it is useful to think of a function in terms of the equation y = af(bx). In Try This 2 you will explore the outcomes of changing a and b for a function of this form.
Try This 2
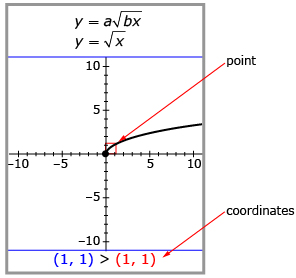
Open Stretching/Reflecting y = af(bx).
- Select the square root function button
 .
.
Notice the point highlighted on the function that follows. This highlighted point shows where a particular point moves as you adjust a and b. The original coordinates and transformed coordinates of this point are listed at the bottom of Stretching/Reflecting y = af(bx). Make sure you pay attention to this information during Try This 2.
- Drag the red point along the graph to (4, 2); then use the applet to complete a table like the one that follows.
Value of a
Value of b
Coordinates of Original Point
Coordinates of Transformed Point
Description/Diagram of How the Point Changed
Description/Diagram of How the Function Changed
1
1
(4, 2)
(4, 2)
no change
no change
3
1
0.7
1
−2
1
1
4
1
0.5
1
−2
Student Choice
Student Choice
- For positive a- and b-values, what effect does each of the following have on a function?
- increasing a
- decreasing a
- increasing b
- decreasing b
- Press the “SET FCN” button on the applet and experiment with a different function. Do you still agree with your responses from question 3?
![]() Save your work in your course folder.
Save your work in your course folder.
Share 2
With a partner or group, discuss the following questions based on the table you created in Try This 2.
- What effect does a negative a or b have on the function? Where have you seen this effect before?
-
- What mathematical relationship is there between a and how an individual point on the function y = af(bx) moves?
- What mathematical relationship is there between b and how an individual point on the function y = af(bx) moves?
- Where would you expect to find an invariant point for each type of stretch?
1.3. Explore 2
Module 1: Function Transformations
In Try This 2 you may have noticed that the function y = af(bx) is the function y = f(x) stretched about the y-axis by a factor of ![]() and stretched about the x-axis by a factor of a.
and stretched about the x-axis by a factor of a.
Increasing the value of a will make the graph seem taller; however, increasing the value of b will make the graph seem narrower, not wider.
Why is one of these factors a reciprocal while the other factor is not? Thinking of a stretch in terms of multiplying x and y in y = f(x) by constants r and s gives ry = f(sx). Isolating y results in the equation ![]() . When written in this form, the vertical stretch is by a factor of
. When written in this form, the vertical stretch is by a factor of ![]() and the horizontal stretch is by a factor of
and the horizontal stretch is by a factor of ![]() . Typically
. Typically ![]() is written as a and s is written as b to give the more familiar y = af(bx).
is written as a and s is written as b to give the more familiar y = af(bx).
“Example 2” on pages 21 and 22 of the textbook explains how a affects the graph of y = af(x). If you would like more explanation, read “Example 2.” If you are comfortable with the changes caused by a, try Self-Check 1.
Self-Check 1
Complete “Your Turn” from “Example 2” on page 22 of the textbook. Answer
“Example 3” on pages 23 and 24 of the textbook explains how b affects the graph of y = f(bx). If you would like more explanation, read “Example 3.” If you are comfortable with the changes caused by b, try Self-Check 2.
Self-Check 2
Complete “Your Turn” from “Example 3” on page 24 of the textbook. Answer
Now you have seen how to graph a function of the form y = af(x) and y = f(bx) given y = f(x). In the next example, a and b will be combined in a function in the form y = af(bx). Watch Graphing y = af(bx) to see how to graph y = af(bx) from y = f(x).
Self-Check 3
1.4. Explore 3
Module 1: Function Transformations
As in previous lessons, the process of using an equation of the form y = af(bx) to graph a function can be reversed to determine the equation of a function given a graph.
Try This 3
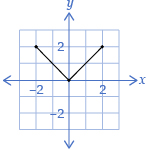
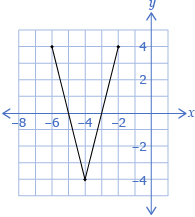
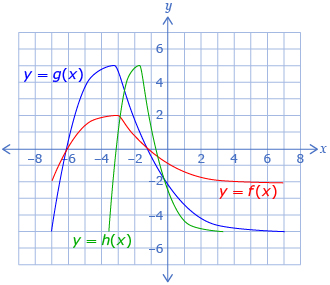
Janila is working on her transformation project and has drawn an original function, y = f(x), and transformed the function to produce y = g(x) and y = h(x). Determine an equation to represent g(x) and h(x) in terms of f(x).
![]() Save your work in your course folder.
Save your work in your course folder.
“Example 4” on page 25 of the textbook shows an example of how the equation of a function can be determined from a graph. If you felt comfortable completing Try This 3, move on to Self-Check 4. If you want to see another example, read “Example 4.”
Self-Check 4
Complete questions 7 and C3 and revisit C2 on pages 29 and 31 of the textbook. Answer
Add the following terms to your copy of Glossary Terms:
- stretch
Add the following formula to your copy of Formula Sheet:
- y = af(bx)
1.5. Connect
Module 1: Function Transformations
Complete the Lesson 2 Assignment that you saved in your course folder at the beginning of this lesson. Show work to support your answers.
![]() Save your responses in your course folder.
Save your responses in your course folder.
Project Connection
There is no Project Connection for this lesson.
Going Beyond
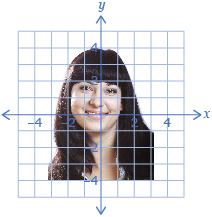
Adapted from iStockphoto/Thinkstock
A grid can be used to help keep proportions correct when you're drawing or painting the image seen in a photograph. This strategy is commonly used by artists. A stretch can be used to manipulate the picture just like a stretch can be used to manipulate a function.
- Use an overlaid grid to stretch a picture horizontally by a factor of
 . This will give you a distortion similar to one you saw in the Focus section of the lesson.
 - Stretch a picture vertically by a factor of
 . Where might you see this type of distortion?
 - Stretch the picture by a factor of 2 about the line x = 3. How is this scenario different than stretching the picture about the y-axis?
Here are some hints to use when drawing from a grid:
- Select a picture that is clear with everything in focus.
- Using a finer grid will make a more accurate final product.
- Make the grid for your drawing in very light pencil and erase the grid as you draw over it.
1.6. Lesson 3 Summary
Module 1: Function Transformations
Lesson 3 Summary
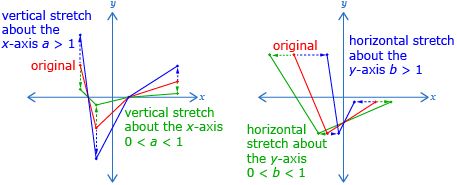
When you multiply all of the x-coordinates or y-coordinates of a function by a constant, the change in shape is called a stretch. When you're stretching about the x-axis or the y-axis, it is useful to think of a function in terms of the equation y = af(bx). When using an equation of this form, a corresponds to a vertical stretch about the x-axis by a factor of a. And b corresponds to a horizontal stretch about the y-axis by a factor of ![]() .
.
Now is a good time to update your summary table for the stretches you learned in this lesson. In Lesson 4 you will begin to combine the transformations learned so far.