Lesson 7
| Site: | MoodleHUB.ca 🍁 |
| Course: | Math 30-1 SS |
| Book: | Lesson 7 |
| Printed by: | Guest user |
| Date: | Tuesday, 9 December 2025, 11:28 PM |
Description
Created by IMSreader
1. Lesson 7
Module 4: Foundations of Trigonometry
Lesson 7: Graphing and Transforming Sine and Cosine Functions 2
Focus

rabbit: Photos.com/Thinkstock; lynx; iStockphoto/Thinkstock
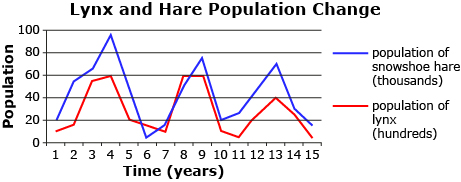
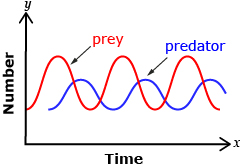
The Canadian lynx’s most important source of food is the snowshoe hare. When a predator has only one single significant source of food, the two populations follow a somewhat sinusoidal pattern as shown in the diagrams. Why does this cyclical pattern occur?
To model a relationship such as the one between the lynx and hare, you need to account for maximum and minimum populations and the length of a cycle. You learned how to work with these parameters in Lesson 6.
But there’s a problem. The graphs you used in Lesson 6 were centred about the x-axis and contained the point (0, 0) for a sine function or (0, amplitude) for a cosine function. Can you think of a strategy used earlier in the course to help you write a function that models these populations?
In this lesson you will discover how the equation of a sine or cosine function is related to phase shift and midline. You will then use this information, along with the period and amplitude, to graph and interpret the graphs of sine and cosine functions.
Lesson Outcomes
At the end of this lesson you will be able to
- sketch the graph of functions of the form
 and
and 
- relate the amplitude, period, phase shift, domain, and range to functions of the form
 and
and 
Lesson Questions
You will investigate the following questions:
- How can the functions and be represented graphically?
- How are the parameters a, b, c, and d of a sine or cosine function related to the transformations of the corresponding graph?
Assessment
Your assessment may be based on a combination of the following tasks:
- completion of the Lesson 7 Assignment (Download the Lesson 7 Assignment and save it in your course folder now.)
- course folder submissions from Try This and Share activities
- additions to Glossary Terms and Formula Sheet
- work under Project Connection
1.1. Discover
Module 4: Foundations of Trigonometry
Discover
Try This 1
- Predict how changing c affects the graph of
 and how changing d affects the graph of
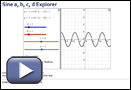
Use Sine a, b, c, d Explorer to answer the following questions. Create your own table to organize your observations.
-
How does changing c affect the graph?
-
How does changing d affect the graph?
-
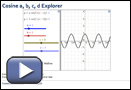
Repeat questions 1 to 3 for the graph of
 using Cosine a, b, c, d Explorer.
![]() Save a copy of your responses in your course folder.
Save a copy of your responses in your course folder.
Share 1
With a partner or in a group, discuss the following questions based on what you saw in Try This 1.
- How is the value of c related to the size of the translation? Explain.
- How is the value of d related to the size of the translation? Explain.
1.2. Explore
Module 4: Foundations of Trigonometry
Explore
Functions in the form ![]() and
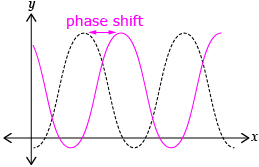
and ![]() are said to be in standard form. In Try This 1 you explored the effects c and d had on functions in standard form. You may have noticed that increasing c caused a horizontal translation to the right c units. A horizontal translation is often called a phase shift for a periodic function.
are said to be in standard form. In Try This 1 you explored the effects c and d had on functions in standard form. You may have noticed that increasing c caused a horizontal translation to the right c units. A horizontal translation is often called a phase shift for a periodic function.
Inserting a positive c-value into form ![]() or
or ![]() makes the c term appear negative. c = 5 gives
makes the c term appear negative. c = 5 gives ![]() and can be thought of as
and can be thought of as ![]() moved 5 units to the right.
moved 5 units to the right.
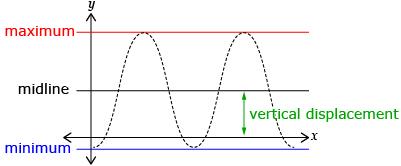
In Try This 1, increasing d caused a vertical translation up d units. A vertical translation is often called a vertical displacement for a periodic function.
Also, d gives the value of the midline, an imaginary line halfway between the maximum and minimum values. The midline can be determined using the formula ![]() where max and min are the maximum and minimum values reached by the graph.
where max and min are the maximum and minimum values reached by the graph.

iStockphoto/Thinkstock
Read “Example 1” on page 240 of the textbook to see how a graph of the form y = sin(x − c) + d can be graphed and interpreted.
Self-Check 1
- Complete the “Your Turn” portion of “Example 1” on page 240 of the textbook. Answer
- Complete questions 1.a., 1.c., 2.a., 2.c., and 5 on page 250 of the textbook. Answer
1.3. Explore 2
Module 4: Foundations of Trigonometry
You have looked at how the parameters c and d can be used to sketch the graph of a sine or cosine function. In Try This 2 you will see how this process can also be done in reverse by determining c and d from a given graph.
Try This 2
- Determine the value of the midline for the graph shown. Use this value to determine d in the equation y = sin(x − c) + d.
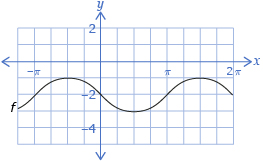
- Determine a value on the midline where the graph is increasing. Use this value to determine c in the equation y = sin(x − c) + d.
![]() Save a copy of your responses in your course folder.
Save a copy of your responses in your course folder.
Share 2
With a partner or in a group, discuss the following questions based on the graph from Try This 2.
- How many possible c-values are there for the graph? If there’s more than one value, give a second value and explain.
- How many possible d-values are there for the graph? If there’s more than one value, give a second value and explain.
- How would your method for determining c be different if this were a cosine graph?
![]() If required, save a record of your discussion in your course folder.
If required, save a record of your discussion in your course folder.
1.4. Explore 3
Module 4: Foundations of Trigonometry
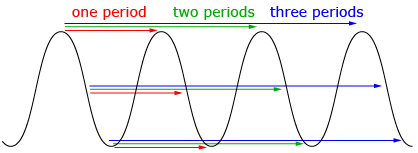
In Try This 2 you investigated how to determine the equation of a graph that includes a phase shift and a vertical translation. There is only one possibility for d, and it is the value of the midline. However, c can have an infinite number of values and still result in the same graph. In the previous example, the possible values of c are π + 2nπ, n ∈ I. These values are true because if you translate the graph horizontally by a multiple of the period, the same graph results.
You have seen how the parameters c and d affect the graph of a sine or cosine function. Next you’ll look at a few examples that use all four parameters a, b, c, and d.
Read “Example 4” on pages 244 to 246 of the textbook. This example shows how to determine an equation from a graph by finding a, b, c, and d. You will notice that the same graph can be written in either standard form, ![]() or
or ![]() Note which parameters are the same between the two and which parameters are different.
Note which parameters are the same between the two and which parameters are different.
Self-Check 2
Complete questions 6.a., 11.a., and 11.c. on pages 251 and 252 of the textbook. Answer
1.5. Explore 4
Module 4: Foundations of Trigonometry
Although these two methods were shown separately, it is common to use a blended approach with some characteristics from each method. Make sure to find a method that works well for you.
Watch Graphing a Cosine Curve Using Transformations and Graphing a Sine Function Using Key Points. These examples show two methods of graphing a sinusoidal function in standard form.

Make sure your function is written in the form ![]() Functions written in other forms, such as
Functions written in other forms, such as ![]() behave differently.
behave differently.
Self-Check 3
![]()
- Complete “Your Turn” from “Example 3” on page 244 of the textbook. Answer
- Complete “Your Turn” from “Example 4” on page 246 of the textbook. Answer
- Complete question 17 on page 253 of the textbook. Answer
- Complete question C1 on page 255 of the textbook. Answer
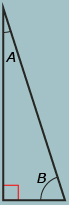
Angles A and B are complementary because A + B = 90°.
The word sine comes from the Latin word for curve or hollow. The word cosine comes from complementary and sine. The cosine of an angle is the sine of the complement of that angle.
Add the following terms to your copy of Glossary Terms:
- standard form
- phase shift
- midline
- vertical displacement
Add the following formulas to your copy of Formula Sheet:
1.6. Connect
Module 4: Foundations of Trigonometry
Complete the Lesson 7 Assignment that you saved in your course folder at the beginning of the lesson. Show work to support your answers.
![]() Save your responses in your course folder.
Save your responses in your course folder.
Project Connection
You are now ready to complete the rest of the Module 4 Project. Go to Module 4 Project: The Ferris Wheel, and complete Part 2.
![]() Save your work in your course folder. When you are finished, submit the entire project to your teacher.
Save your work in your course folder. When you are finished, submit the entire project to your teacher.
Going Beyond
It is always possible to give the equation in the form ![]() or
or ![]() for a sine or cosine function without using negative a or b.
for a sine or cosine function without using negative a or b.
- Graph the functions y = 3 sin x and y = −3 sin x.
How did you account for the negative sign?
Rewrite the function y = −3 sin x so the function doesn’t have a negative a coefficient. - Graph the functions y = cos(2x) and y = cos(−2x).
How did you account for the negative sign?
Rewrite the function y = cos(−2x) so the function doesn’t have a negative b coefficient. - When might it be an advantage to use a negative value for a or b?
1.7. Lesson 7 Summary
Module 4: Foundations of Trigonometry
Lesson 7 Summary
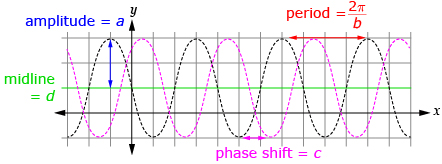
Although sine and cosine functions can be transformed in the same manner as other functions, the characteristics of their graphs are given the more specific names of amplitude, period, phase shift and vertical displacement. These names correspond to the parameters of a, b, c, and d for a sine or cosine function written in the form ![]() or
or ![]()
| Parameter | Characteristic of Graph |
| a | a = amplitude |
| b | |
| c | c = phase shift right if c is positive, left if c is negative |
| d | d = midline value |
In Module 5 you will begin to explore the graph of tangent functions and determine how to apply trigonometric functions to problems.