Lesson 2
| Site: | MoodleHUB.ca 🍁 |
| Course: | Math 30-1 SS |
| Book: | Lesson 2 |
| Printed by: | Guest user |
| Date: | Tuesday, 9 December 2025, 11:15 PM |
Description
Created by IMSreader
1. Lesson 2
Module 5: Trigonometry Applications and Identities
Lesson 2: Equations and Graphs of Trigonometric Functions
Focus
Hemera/Thinkstock
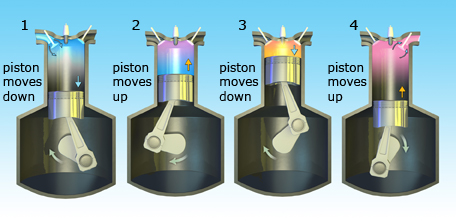
A four-stroke engine goes through a four-step cycle. 1. Fuel and air are added
to the cylinder as the piston moves down. 2. The piston moves up again,
compressing the fuel and air mixture. 3. The fuel and air are ignited, producing
hot gas and forcing the piston down. 4. As the piston rises, the spent fuel and
air are expelled.
Many internal combustion engines in vehicles follow the “four-stroke” process (shown in the diagram) to produce rotational motion. Think about what happens to a piston over time. How predictable is the motion? What information would you need to determine the position of a piston over time?
Lesson Outcomes
At the end of this lesson you will be able to use trigonometric equations and graphs to model and solve problems.
Lesson Questions
In this lesson you will investigate the following question:
- How can a problem be solved using a trigonometric model?
Assessment
Your assessment may be based on a combination of the following tasks:
- completion of the Lesson 2 Assignment (Download the Lesson 2 Assignment and save it in your course folder now.)
- course folder submissions from Try This and Share activities
- additions to Glossary Terms
- work under Project Connection
1.1. Launch
Module 5: Trigonometry Applications and Identities
Launch
Do you have the background knowledge and skills you need to complete this lesson successfully? Launch will help you find out.
Before beginning this lesson you should be able to solve a trigonometric equation and give the general solution.
1.2. Are You Ready?
Module 5: Trigonometry Applications and Identities
Are You Ready?
Complete this question. If you experience difficulty and need help, visit Refresher or contact your teacher.
Give the general solution to the equation sin2 x = 3 − 2 sin x. Answer
If you answered the Are You Ready? question without difficulty, move to Discover.
If you found the Are You Ready? question difficult, complete Refresher.
1.4. Discover
Module 5: Trigonometry Applications and Identities
Discover
Try This 1
Open Pistons. The applet shows parts of two different engines, each with a different type of connecting rod. The dimensions of the two mechanisms are the same. Drag the blue dot upward to see the pistons move.
- How is the motion of the two pistons similar? How is the motion different?

- Pay attention to the motion of the pistons. What causes the slight difference in height at some points?
- When are the two pistons the same height? When is the difference in their heights the greatest?
- Sketch piston height versus time for both pistons on the same graph. Your sketch does not need to include any numbers. Assume both crankshafts are rotating at a constant rate.
![]() Save your answers in your course folder.
Save your answers in your course folder.
Share 1
With a partner or group, discuss the following questions based on your graph created in Try This 1.
- How are the two graphs similar? How are they different?
- When the crankshafts are rotating at a constant rate, the height versus time function is the same shape as y = sin x for only one of the two systems. Which system is the shape of y = sin x? Explain your choice.
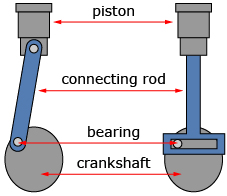
The following diagram shows some of the moving parts of an engine for the two different styles of connecting rods shown. These may help in your description of how each engine type moves.
1.5. Explore
Module 5: Trigonometry Applications and Identities
Explore
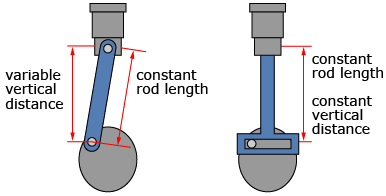
In Try This 1 and Share 1 you explored how two different pistons move over time. The difference in piston motion is due to the first connecting rod “waving” back and forth. This means the vertical distance between the ends of the connecting rod is not always the same. This scenario requires a more complex model than just a sine curve. The second rod does not “wave,” and so the vertical distance between the ends of the rod is constant. The second mechanism can be modelled using the transformations of a sine graph learned so far.
Your sketch of the two graphs should look similar to the following:
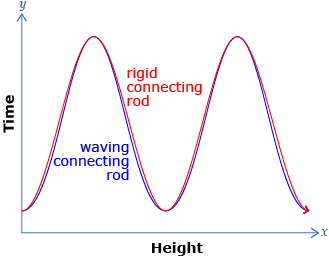
The graphs of the two piston heights are a mathematical model of the physical systems. A mathematical model is a representation of a system using mathematical ideas and language. A model is then used to make predictions about the system.
Creating mathematical models that accurately describe phenomena can be a challenging process and is the focus of a branch of mathematics called applied mathematics.
In the piston system, the model was just the sketch of the two graphs. Even though values were not included, it is still possible to determine a lot of information about the system:
- The maximum and minimum values coincide.
- The height of the piston with the waving connecting rod is always less than or equal to the height of the piston with the rigid connecting rod.
- The relative distance between the two heights can be seen.
- The movement of one piston is a close approximation of the movement of the other piston.
1.6. Explore 2
Module 5: Trigonometry Applications and Identities
In Try This 2 you will explore the model of a system that includes numbers.
Try This 2
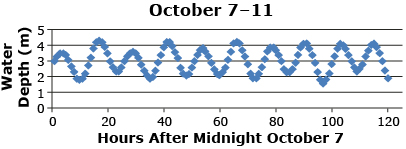
A tide chart predicts the height of water at a specific location at particular times. Consider the following tide chart for Vancouver from October 7 to 11, 2011.
SOURCE: Tide, Currents, and Water Levels, (Fisheries and Oceans Canada, 2011), <http://www.tides.gc.ca/>; (09/02/2012).
- What general shape is the graph? Is a sine or cosine model reasonable?
- Try to model the graph using the equation
 Use the following table to help you.
Graph Dimension What does the dimension represent in the problem? Value of Parameter amplitude ≈ a ≈ period ≈ b ≈ phase shift ≈ c ≈ midline ≈ d ≈
Write your equation in the form
- Use Tides Exploration 1 to determine an equation that matches the data. Adjust the parameters a, b, c, and d until the graph overlaps the points as closely as possible. Write down your equation.
-
How does the equation you determined in question 2 compare to the equation you determined in question 3?
- Three points on the original scatter plot are (10, 1.9), (50, 3.0), and (100, 3.3). Calculate the y-value at the times of 10, 50, and 100 hours by using each of your equations. Use a chart similar to the following one to organize the calculations. How close are your predicted heights to the actual heights?
x-Value y-Value Using Equation Found in Question 2 y-Value Using Equation Found in Question 3 Actual y-Value 10 1.9 50 3.0 100 3.3 - Consider the tide table for the same location from November 16 to 20, 2011. What characteristics of this graph are similar to a sine graph? What is different?
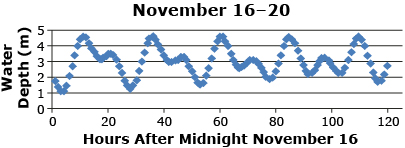
SOURCE: Tide, Currents, and Water Levels, (Fisheries and Oceans Canada, 2011), <http://www.tides.gc.ca/>; (09/02/2012). - Is it reasonable to use an equation of the form
 to model this data?
 -
Use Tides Exploration 2 in an attempt to model the data using an equation of the form
-
Does it make sense to use an equation of the form
 to model this data?
![]() Save your answers in your course folder.
Save your answers in your course folder.
Share 2
With a partner or group, discuss the following questions based on what you learned in Try This 2.
- How can you decide when
 should be used to model data?
 - What advantage is there in using an equation to represent data?
- What are some problems with using one of the equations from questions 2 and 3 of Try This 2 to predict the tide height at 5000 h?
1.7. Explore 3
Module 5: Trigonometry Applications and Identities

iStockphoto/Thinkstock
The gravitational pull of the Sun and the Moon are the main cause of coastal tides (water levels changing regularly). When the Sun and Moon are on the same side of Earth or are opposite each other, tides tend to be larger and follow a pattern like the one seen in Vancouver from October 7 to 11, 2011.
When the Sun and Moon are not on the same side of Earth or are not across from one another, the tide can be thought of as two overlapping patterns like that seen in Vancouver from November 16 to 20, 2011.
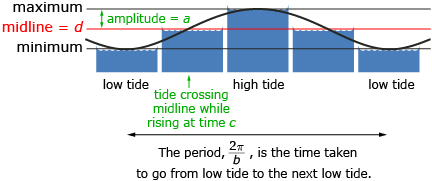
You may have noticed in Try This 2 that it is possible to represent data using an equation of the form ![]() Typically, a, b, c, and d represent some characteristic of the graph. For the tide graph,
Typically, a, b, c, and d represent some characteristic of the graph. For the tide graph,
- a = amplitude, and is half the distance between the highest water level and the lowest water level
 where P is the period or length of time it takes for the water to go from one low tide to the next low tide
- c = the phase shift and is a time when the tide hits the midline while rising, if a is positive
- d = the midline and represents the height halfway between the maximum and minimum water depths
You may have also noticed that it is possible to make predictions about tide heights in the future using your model. However, long-term predictions are not likely to be accurate because the shape of the graph changes over time.
Self-Check 1
Complete questions 2, 6.a., 6.d., 13, and 15 on pages 275 to 278 of the textbook. Answer
In the next section you will look at solving problems both graphically and algebraically.
1.8. Explore 4
Module 5: Trigonometry Applications and Identities
Try This 3
Photodisc/Adam Crowley/Thinkstock
In Canada, the electricity you commonly use from an outlet is an alternating current. This means the current moves back and forth to produce a voltage that cycles between positive and negative. The current makes 60 cycles per second.
The equation V = 170 cos (120πt) models the electrical current, where V is voltage and t is time in seconds.
- Determine the voltage at 0.61 s.
- Determine the times at which the voltage is equal to 100.
![]() Save your answers in your course folder.
Save your answers in your course folder.
Share 3
With a partner or group, discuss the following question based on your solutions to Try This 3.
How do your strategies for solving question 2 in Try This 3 compare?
![]() If required, save a record of your discussion in your course folder.
If required, save a record of your discussion in your course folder.
1.9. Explore 5
Module 5: Trigonometry Applications and Identities
In Try This 3 you may have solved the problem algebraically or graphically. Both of these methods are shown in Voltage: Algebraic Solution and Voltage: Graphical Solution.

Self-Check 2
![]()
- Complete “Your Turn” from "Example 2" on page 270 of the textbook. Answer
- Complete “Your Turn” from "Example 3" on page 271 of the textbook. Answer
- Complete questions 5, 16, and 18 on pages 275 to 279 of the textbook. Answer
Add mathematical model to your copy of Glossary Terms.
1.10. Connect
Module 5: Trigonometry Applications and Identities
Open your copy of Lesson 2 Assignment, which you saved in your course folder at the beginning of this lesson. Complete the assignment. Show work to support your answers.
Project Connection
You are now ready to apply your understanding of problem solving using trigonometric models. Go to Module 5 Project: Pushing the Limits of Vehicle Performance and complete Activity 2: Part 1. Note that you are not expected to complete Part 2 of Activity 1 until after you complete Lesson 4.
1.11. Lesson 2 Summary
Module 5: Trigonometry Applications and Identities
Lesson 2 Summary
In this lesson you studied how trigonometric models can be used to solve problems. A mathematical model is a representation of a system using mathematical ideas and language. It can take on many forms, such as graphs or equations, as was demonstrated in this lesson. Most models are only an approximation of reality. Understanding the limitations of a model can help you decide how accurate a model's predictions will be.
In Lesson 3 you will learn about trigonometric identities and how to use them to solve problems.