Lesson 1
| Site: | MoodleHUB.ca 🍁 |
| Course: | Math 30-1 SS |
| Book: | Lesson 1 |
| Printed by: | Guest user |
| Date: | Tuesday, 9 December 2025, 10:34 PM |
Description
Created by IMSreader
1. Lesson 1
Module 6: Exponents and Logarithms
Lesson 1: Exponential Functions
Focus
How can you describe the growth and decay of certain elements? One way is to say that an amount has doubled, tripled, halved, and so on.
An example of a quantity that keeps decreasing by the same amount over a specific time is the mass of a radioactive isotope. A radioactive isotope is a chemical element that is unstable and breaks down or decays into other elements. The time it takes for the element to decay to half its original amount is called the element’s half-life.
A medical isotope is a safe radioactive substance used primarily to diagnose illness. The energy emitted by the isotope when inside a patient is detected by special cameras while the patient is being scanned. These scans essentially light up the organ and show how the organ is working rather than what the organ looks like. The branch of medicine and medical imaging that uses these isotopes is known as nuclear medicine.
© Health Canada

� sonap/41131687/Fotolia
In Canada, about one out of every three patients entering a hospital will undergo some form of nuclear-medicine procedure.
In this lesson you will examine quantities that are increasing or decreasing by the same amount over time. What would the graph of the mass of a medical isotope look like over time? Is there a type of function that can be used to describe this relationship? If so, how can you use these types of functions in other applications?
Lesson Outcomes
At the end of this lesson you will be able to
- sketch a graph of an exponential function
- apply transformations to the graph of an exponential function
- identify characteristics of the graph of an exponential function
- solve problems involving exponential growth or decay
Lesson Question
You will investigate the following question:
- How can exponential functions be graphed and analyzed?
Assessment
Your assessment may be based on a combination of the following tasks:
- completion of the Lesson 1 Assignment (Download the Lesson 1 Assignment and save it in your course folder now.)
- course folder submissions from Try This and Share activities
- additions to Glossary Terms and Formula Sheet
- work under Project Connection
Self-Check activities are for your own use. You can compare your answers to suggested answers to see if you are on track. If you have difficulty with concepts or calculations, contact your teacher.
Remember that the questions and activities you will encounter provide you with the practice and feedback you need to successfully complete this course. You should complete all questions and place your responses in your course folder. Your teacher may wish to view your work to check on your progress and to see if you need help.
Time
Each lesson in Mathematics 30-1 Learn EveryWare is designed to be completed in approximately two hours. You may find that you require more or less time to complete individual lessons. It is important that you progress at your own pace, based on your individual learning requirements.
This time estimation does not include time required to complete Going Beyond activities or the Module Project.
1.1. Launch
Module 6: Exponents and Logarithms
Launch
Do you have the background knowledge and skills you need to complete this lesson successfully? Launch will help you find out.
Before beginning this lesson you should be able to
- identify powers
- evaluate expressions
- apply transformations
1.2. Are You Ready?
Module 6: Exponents and Logarithms
Are You Ready?
Complete these questions. If you experience difficulty and need help, visit Refresher or contact your teacher.
- Identify the coefficient, base, exponent, and power of the following expressions.
- Evaluate the following expressions.
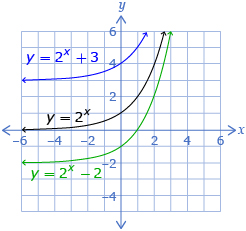
- Given the graph of y = f(x), sketch the graph of
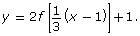 Describe the transformations of the graph.
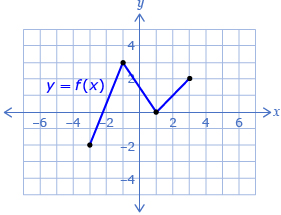
Answer
If you answered the Are You Ready? questions without difficulty, move to Discover.
If you found the Are You Ready? questions difficult, complete Refresher.
1.3. Refresher
Module 6: Exponents and Logarithms
Refresher

Review the definition of power and how to evaluate powers in Power.

Source: Khan Academy
(![]() BY-NC-SA 3.0)
BY-NC-SA 3.0)
View “Negative Exponent Intuition” to review negative exponents.
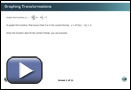
View Graphing Transformations to review graphing using transformations. You might also review the transformations summary sheet you made in Module 1.
Go back to the Are You Ready? section and try the questions again. If you are still having difficulty, contact your teacher.
1.4. Discover
Module 6: Exponents and Logarithms
Discover

iStockphoto/Thinkstock
A value can increase very quickly when doubled over a period of time. This idea is illustrated in Try This 1.
Try This 1
Logan asked his father for a weekly allowance. Logan suggested he get one penny the first week and that the allowance double each of the following weeks. Logan’s father thought he should investigate the idea a little further before deciding. He made the following chart:
Week |
Allowance (cents) |
Allowance Written as Base 2 |
0 |
1 |
20 = 1 |
1 |
1 × 2 = 2 |
21 = 2 |
2 |
2 × 2 = 4 |
22 = 4 |
3 |
4 × 2 = 8 |
23 = 8 |
4 |
8 × 2 = 16 |
24 = 16 |
5 |
|
|
6 |
|
|
- Complete the rest of the chart. Sketch a graph of allowance (cents) as a function of the week. Describe the shape of the graph.
- How could you determine the amount of allowance for any specified week?
- After six weeks Logan would still be receiving less than a dollar per week. Determine the allowance, in dollars, Logan would receive in week 12. (This would be about three months.)
![]() Save your responses in your course folder.
Save your responses in your course folder.
Share 1
With a partner or group discuss the following question based on the graph you created in Try This 1:
Should Logan’s father agree to Logan’s idea for his allowance? Why or why not?
![]() If required, save a record of your discussion in your course folder.
If required, save a record of your discussion in your course folder.
1.5. Explore
Module 6: Exponents and Logarithms
Explore

Polka Dot/Thinkstock
In Try This 1 you worked with an example of exponential growth. You may have determined that after about three months, in week 12, Logan’s allowance would have been 4096¢, or $40.96.
The relationship that describes the growth of Logan’s allowance in cents, A, as a function of week, w, is A = 2w. You will notice that the variable w is an exponent; therefore, A = 2w is considered an exponential function.
An exponential function is a function in the form y = cx, where c is a constant, c > 0, c ≠ 1, and x is a variable.
Different letters can be used to represent the base of an exponential function. A common form is y = bx. In your textbook and in this course, the letter c is used to represent the base, y = cx. This is to avoid confusion with the transformation parameters a, b, h, and k that were introduced in the first module on transformations.
In Try This 2 you will explore the graphs of exponential functions.
Try This 2
Open Exponential Functions.
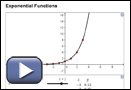
Using Exponential Functions, complete “Investigate Characteristics of Exponential Functions” questions 1 to 5 on pages 334 to 335 of the textbook. Use the slider to change the c-value.
![]() Save your responses in your course folder.
Save your responses in your course folder.
Share 2
With a partner or group, discuss the following question based on the graph you created in Try This 2:
How does the value of c affect the shape and characteristics of the graph?
![]() If required, save a record of your discussion in your course folder.
If required, save a record of your discussion in your course folder.
1.6. Explore 2
Module 6: Exponents and Logarithms
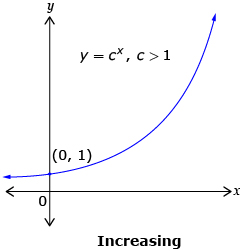
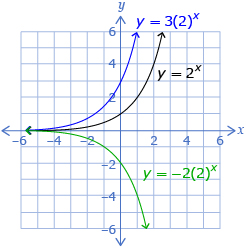
You may have noticed from Try This 2 that the graph increases when c > 1. This graph can be used to describe exponential growth.
Source: Pre-Calculus 12.
Whitby, ON: McGraw-Hill Ryerson, 2011.
Reproduced with permission.
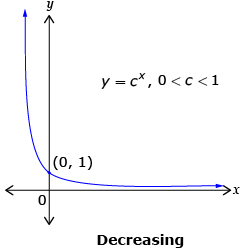
When 0 < c < 1, the graph decreases. This graph can be used to describe exponential decay.
Source: Pre-Calculus 12.
Whitby, ON: McGraw-Hill Ryerson, 2011.
Reproduced with permission.
The characteristics of all exponential functions of the form y = cx, c > 0, c ≠ 1 are as follows:
- The domain is {x|x ∈ R}.
- The range is {y|y > 0, y ∈ R}.
- There is no x-intercept.
- The y-intercept is 1.
- The horizontal asymptote is y = 0.
Self-Check 1
![]()
1.7. Explore 3
Module 6: Exponents and Logarithms
In Try This 2 you examined the graphs of different exponential functions. You determined characteristics of each function from the function’s graph. In Try This 3 you will look at determining the equation of an exponential function when given the function’s graph.
Try This 3
The medical isotope Iodine-131 is produced at Chalk River Laboratories in Ontario. The isotope is used in nuclear medicine. A radioactive sample of Iodine-131 has a half-life of 8 d. This means that after eight days, half of the original amount of the sample has decayed. The original sample is 1.0 g. The graph of the amount of Iodine, A, remaining over time, t, in 8-d intervals is shown.
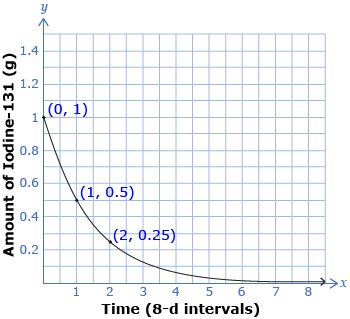
- What are the domain and range of this graph?
- Based on the shape of the graph, is c > 1 or 0 < c < 1?
- Place the three data points in a table like the one that follows. As the x-value increases by 1, by what factor does the y-value change? This factor describes the pattern of decay.
x
y
- Use your answer from question 3 as the c-value in an exponential function that would model the relationship between the amount of Iodine-131, A, and time, t, in 8-d intervals.
- To verify your function from question 4, substitute the point (2, 0.25) into your function. Is your function correct?
- Estimate how many days it would take for there to be 0.0625 g of Iodine-131 remaining. Explain how you determined your answer.
![]() Save your responses in your course folder.
Save your responses in your course folder.

© Photo courtesy of the National Research Council
The National Research Universal Reactor produces the following isotopes:
- Molybdenum-99: used for medical diagnosis of the brain, thyroid, heart, lungs, liver, kidney, spleen, and bone marrow
- Iodine-131: used in therapy, imaging, and diagnosis, primarily for the thyroid
- Iodine-125: used in in-vitro diagnostics, bone densitometry devices, protein iodination, and therapeutic seed
- Xenon-133: a medical diagnosis tool, especially for scanning lungs1
1 Adapted from Medical Isotopes/Atomic Energy of Canada Limited
1.8. Explore 4
Module 6: Exponents and Logarithms
In Try This 3 you may have determined that the function that modelled the amount of Iodine-131, A, and time, t, in 8-d intervals was ![]() . The function A = 2−t could also be used, since
. The function A = 2−t could also be used, since ![]() .
.
The base is one-half because the amount of Iodine-131 is decreasing by half over each 8-d interval. The domain of the function is {t|t ≥ 0, t ∈ R}, and the range is {A|0 < A ≤ 1, A ∈ R}. You may have determined that it would take 4 eight-day intervals, or 32 d, for 0.0625 g of Iodine-131 to be left.
View Determining an Exponential Function to see an example of how to determine the equation of an exponential growth function from its graph.
Self-Check 2
![]()
- Complete “Your Turn” at the end of “Example 3” on page 341 of the textbook. Answer
- Complete question 11 on page 344 of the textbook. Answer
Try This 4
Open Multiple Transformations. Click on the boxes to deselect Quadratic and select Exponential.
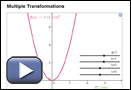
- Use the sliders to increase and decrease the a, b, h, and k values. Describe how the parameters a, b, h, and k in the form f(x) = a(c)b(x–h) + k transform the graph. Complete a table like the one shown.
Parameter
Describe Effect on Graph
a
b
h
k
- How do your responses compare to your knowledge of transformations from past lessons?
![]() Save your responses in your course folder.
Save your responses in your course folder.
1.9. Explore 5
Module 6: Exponents and Logarithms
In Try This 4 you may have found that the parameters a, b, h, and k change the graph of an exponential function in the form f(x) = a(c)b(x–h) + k in the ways summarized in the following chart. Note: You may find it helpful to look at Multiple Transformations from Try This 4 as you review this chart.
Parameter |
Transformation |
Example |
a |
|
 |
b |
|
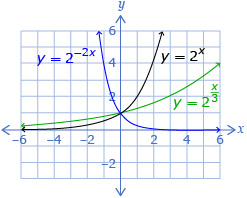 |
h |
|
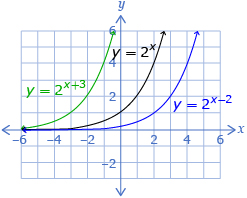 |
k |
|
 |
1.10. Explore 6
Module 6: Exponents and Logarithms
Read “Example 1” on page 349 of the textbook. Notice how, in the example, each point is transformed first by the vertical stretch and then by the horizontal translation using a table.
Self-Check 3
- Complete “Your Turn” at the end of “Example 1” on page 351 of the textbook. Answer
- Complete question 8 on page 367 of the textbook. Answer
- Complete questions 1 to 5 in “Exponential Functions – Activity B.”
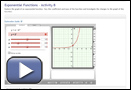
Screenshot reprinted with permission of ExploreLearning
You have graphed a given function using transformations. Can you write a function if given a graph? In Try This 5 you will look at an example of how bacteria growth can be modelled using an exponential function.
Try This 5

Wavebreak Media/Thinkstock
A scientist grew a type of bacteria in a Petri dish and started with 300 bacteria. The scientist found that the bacteria increased in population at an exponential rate of 60% every 4 d.
Answer the following questions to determine the exponential function for this situation in the form P = a(c)bt, where the population, P, is a function of the bacteria over time, t, in days. A graph of this situation is shown.
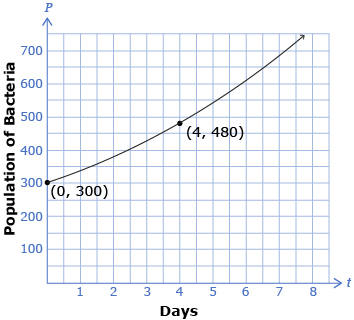
- Is the value of c > 1 or is 0 < c < 1?

- Determine the c-value. Explain your answer.
- Determine the b-value. Explain your answer.
- Determine the a-value. Explain your answer.
- Write the equation that models the growth of this bacteria in the form P = a(c)bt, where P is the population and t is the time in days.
![]() Save your responses in your course folder.
Save your responses in your course folder.
1.11. Explore 7
Module 6: Exponents and Logarithms
In Try This 5 you learned how to determine the equation of a function that models a given situation. You may have written the function as ![]() , where
, where
- c = 1.6
This value describes the rate of growth. The increase is 60%, so 1 + 0.60 = 1.6.

This value describes a horizontal stretch by a factor of 4. The increase occurs every 4 d.- a = 300
This value describes a vertical stretch by a factor of 300. The initial number of bacteria is 300.
For another example of using an exponential function to model a situation, read “Example 2” on pages 352 and 353 of the textbook. Notice while reading that this function has a horizontal asymptote. The horizontal asymptote helps determine the vertical translation of the function.
Self-Check 4
- Complete “Your Turn” at the end of “Example 2” on page 353 of the textbook. Answer
- Complete question 9 on page 356 of the textbook. Answer
Add the following terms to your copy of Glossary Terms:
- exponential function
- exponential growth
- exponential decay
Add the following formula to your copy of Formula Sheet:
- y = a(c)b(x−h) + k
1.12. Connect
Module 6: Exponents and Logarithms
Complete the Lesson 1 Assignment that you saved in your course folder at the beginning of the lesson. Show work to support your answers.
![]() Save your responses in your course folder.
Save your responses in your course folder.
Project Connection
Go to Module 6 Project: Movie Money. Read over all project requirements. Become familiar with what you will be doing and how you will be assessed.
1.13. Lesson 1 Summary
Module 6: Exponents and Logarithms
Lesson 1 Summary
In this lesson you explored exponential functions and how they can be used to describe growth or decay of quantities.
The characteristics of all exponential functions of the form y = cx, c > 0, c ≠ 1 are as follows:
- If c > 1, the function is increasing and is an exponential growth function.
- If 0 < c < 1, the function is decreasing and is an exponential decay function.
- The domain is {x|x ∈ R}.
- The range is {y|y > 0, y ∈ R}.
- There is no x-intercept.
- The y-intercept is 1.
- The horizontal asymptote is at y = 0.
When an exponential function is in the form y = a(c)b(x–h) + k, the parameters a, b, h and k correspond to the following transformations:
|
Value > 0 |
Value < 0 |
a |
|
|
b |
|
|
h |
|
|
k |
|
|
Exponential functions can be used to model real-life applications of exponential growth or decay. In the next lesson you will explore how to solve exponential equations.