Lesson 4
| Site: | MoodleHUB.ca 🍁 |
| Course: | Math 30-1 SS |
| Book: | Lesson 4 |
| Printed by: | Guest user |
| Date: | Tuesday, 9 December 2025, 11:01 PM |
Description
Created by IMSreader
1. Lesson 4
Module 6: Exponents and Logarithms
Lesson 4: Graphing Logarithmic Functions
Focus
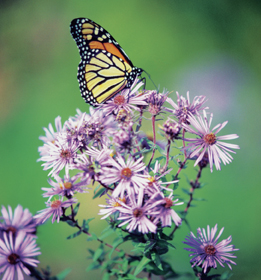
Photodisc/Thinkstock
The population of butterflies is dependent on the number of flower species the butterflies feed on. The relationship is a logarithmic function. As the number of flowers species, F, increases, so does the number of butterfly observations, B, but at a slow rate.
In the previous lesson you explored the meaning of logarithms and how they are evaluated. In this lesson you will explore graphing logarithmic functions and how transformations can be used to help sketch logarithmic functions. You will also look at how logarithmic functions can be used to solve problems.
Lesson Outcomes
At the end of this lesson you will be able to
- sketch the graph and identify the characteristics of a logarithmic function of the form y = logc x, c > 0 and c ≠ 1
- sketch the graph of a logarithmic function by applying transformations to the graph of y = logc x, c > 0 and c ≠ 1
Lesson Question
You will investigate the following question:
- How can logarithmic functions be graphed and described using transformations?
Assessment
Your assessment may be based on a combination of the following tasks:
- completion of the Lesson 4 Assignment (Download the Lesson 4 Assignment and save it in your course folder now.)
- course folder submissions from Try This and Share activities
- additions to Formula Sheet
1.1. Launch
Module 6: Exponents and Logarithms
Launch
Do you have the background knowledge and skills you need to complete this lesson successfully? Launch will help you find out.
Before beginning this lesson you should be able to
- identify functions
- identify inverse functions
1.2. Are You Ready?
Module 6: Exponents and Logarithms
Are You Ready?
Complete the following questions. If you experience difficulty and need help, visit Refresher or contact your teacher.
- Examine each graph of y = f(x); then sketch the graph of its inverse. Determine whether or not the inverse is a function. Provide a reason for your answer.
- Determine graphically whether each pair of functions are inverses of each other.
If you answered the Are You Ready? questions without difficulty, move to Discover.
If you found the Are You Ready? questions difficult, complete Refresher.
1.3. Refresher
Module 6: Exponents and Logarithms
Refresher

Source: Khan Academy
(![]() BY-NC-SA 3.0)
BY-NC-SA 3.0)
Review inverse functions by watching “Introduction to Function Inverses.”
Go back to the Are You Ready? section and try the questions again. If you are still having difficulty, contact your teacher.
1.4. Discover
Module 6: Exponents and Logarithms
Discover
Try This 1
- State the inverse of f(x) = 5x.

- Complete the following tables of values.
f(x) = 5x x
y
−2
−1
0
1
2
INVERSE OF f(x) = 5x
f -1(x) x
y
−2
−1
0
1
2
- Sketch the graphs of f(x) = 5x and the inverse, f −1(x).
- Identify the following characteristics of the graph of f(x) = 5x and the inverse graph.
Characteristics f(x) = 5x f -1(x) Domain
Range
x-intercept
y-intercept
Equation of Any Asymptotes
- Open “Logarithmic Functions – Activity A.”

Screenshot reprinted with permission of ExploreLearning
Step 1: Change the a-value to 5.
Step 2: Click on the box “Show associated exponential.”
Step 3: Click on the box “Show line y = x.”
Step 4: Compare your answers to Try This 1 to the graphs produced. - How are the x- and y-coordinates of the corresponding graphs related for the two functions?
- Describe the transformation of the graph of f(x) = 5x to get the graph of the inverse.
![]() Save your responses in your course folder.
Save your responses in your course folder.
Share 1
Based on your graphs created in Try This 1, discuss the relationship between the characteristics of the function f(x) = 5x and the inverse, f –1(x), with a partner or group.
![]() If required, save a record of your discussion in your course folder.
If required, save a record of your discussion in your course folder.
1.5. Explore
Module 6: Exponents and Logarithms
Explore
In Try This 1 you graphed the exponential function f(x) = 5x and its inverse, f –1(x) = log5 x. The graph of f –1(x) = log5 x is the reflection of the graph of f(x) = 5x about the line y = x. The coordinates of the exponential function graph and its inverse are connected by the following map: (x, y) ![]() (y, x).
(y, x).
Self-Check 1
- Use your knowledge of logarithmic functions to complete questions 1 to 5 in “Logarithmic Functions – Activity A.”
Screenshot reprinted with permission of ExploreLearning
![]()
- Complete questions 1.b. and 9 on page 380 of the textbook. Answers
Try This 2
Open Multiple Transformations. Deselect Quadratic by clicking on the box, and then select Logarithmic by clicking the box.
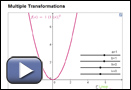
Screenshot reprinted with permission of ExploreLearning
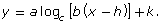
- Use the sliders to increase and decrease the a-, b-, h-, and k-values. Describe how the parameters a, b, h, and k in the form
 transform the graph by completing a table like the one shown.
Parameter
Effect on the Graph
Do the domain, range, and/or vertical asymptote change?
a 
b c d - How do your responses compare to your knowledge of transformations from past lessons?
- Using Multiple Transformations, compare
 and y = logc x. Describe the effect of a, b, h, and k on the domain, range, and vertical asymptote.
![]() Save your responses in your course folder.
Save your responses in your course folder.
1.6. Explore 2
Module 6: Exponents and Logarithms
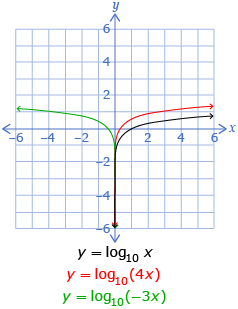
In Try This 2 you may have found that the parameters a, b, h, and k change the graph of a logarithmic function in the form ![]() in the following ways.
in the following ways. ![]()
Parameter |
Transformation |
Example |
| a |
|
 |
| b |
|
 |
| h |
|
 |
| k |
|
 |
You may have also noticed in Try This 2 that the parameters h and b affect the domain:
- The h-value translates the domain left or right.
- If the b-value is negative, the graph is reflected in the y-axis, and so the domain is reflected.
The range is unchanged and is all real numbers.
1.7. Explore 3
Module 6: Exponents and Logarithms
Try This 3
You will now explore graphing logarithmic functions using transformations.
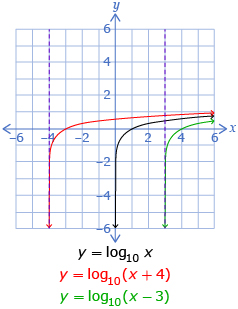
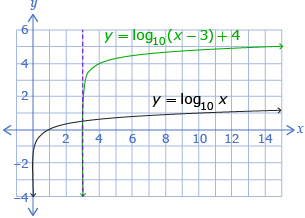
- In a table similar to the one shown, identify each parameter for the function y = log10(x − 3) + 4 when in the form
Parameter
Value of Parameter
Description of Transformation
a 1 no transformation b 1 no transformation h 
k - In your table, indicate the corresponding transformations for each parameter.
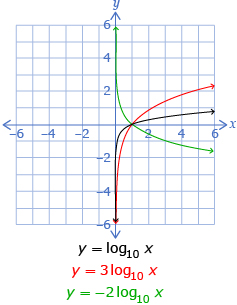
- Sketch the function y = log10 x.
- Apply the transformations described in the table to the sketch of y = log10x to sketch the graph of y = log10(x − 3) + 4.
- Graph y = log10(x − 3) + 4 using technology, and then compare this to the sketch you created in question 4.
![]() Save your responses in your course folder.
Save your responses in your course folder.
1.8. Explore 4
Module 6: Exponents and Logarithms
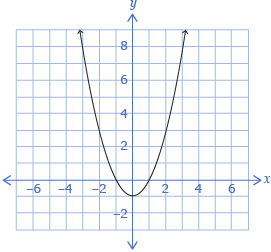
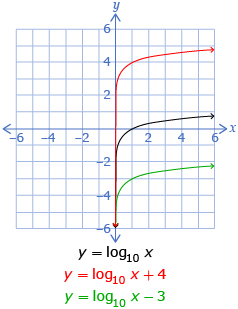
In Try This 3 you graphed a logarithmic function using transformations. You may have noticed that the function y = log10(x − 3) + 4 is the transformed graph of y = log10 x by a horizontal translation of right 3 units and a vertical translation of 4 units up.
Your graph may have looked like this one:
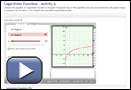
View Graphing Logarithmic Functions to see an example of how to graph a logarithmic function using transformations.
Self-Check 2
![]()
- Complete question 1.c. on page 389 of the textbook. Answer
- Complete question 4.b. on page 390 of the textbook. Answer
- Complete question 5.b. on page 390 of the textbook. Answer
- Complete questions 1 to 5 in “Logarithmic Functions: Translating and Scaling.”
Screenshot reprinted with permission of ExploreLearning
1.9. Explore 5
Module 6: Exponents and Logarithms
In Try This 3 you looked at graphing logarithmic functions from their equations. It is also possible to write the equation of a logarithmic function when given the graph of the function.
Read “Example 3” on pages 387 and 388 of the textbook. Notice that there are two methods:
- Method 1 examines how the graph is transformed and determines the equation using the transformations.
- Method 2 uses a specific point on the given function to determine the equation by substituting the point into a logarithmic form.
Self-Check 3
![]()
Complete “Your Turn” at the end of “Example 3” on page 388 of the textbook. Answer

Hemera/Thinkstock
As you saw in Focus, logarithmic functions can describe some growth situations. One such situation is the relationship between the number of flower species and the population of butterflies. In Try This 4 you will examine how a logarithmic function can be used to model growth and solve problems.
1.10. Explore 6
Module 6: Exponents and Logarithms

iStockphoto/Thinkstock
There are about 130 species of butterflies in Alberta. The species vary in size. The smallest measures about 15 mm, and the largest is over 10 cm from the tips of each wing.
Try This 4
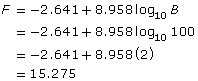
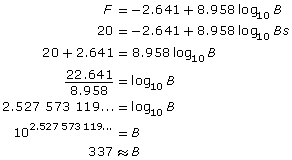
There is a logarithmic relationship between butterflies and flowers. In one study, scientists found that the relationship between the number of flower species, F, that a butterfly feeds on and the number of butterflies observed, B, can be modelled by the function F = −2.641 + 8.958 log10 B.
Pre-Calculus 12. Whitby, ON: McGraw-Hill Ryerson, 2011. Reproduced with permission.
- Determine algebraically the number of flower species if 100 butterflies are observed.

- Determine algebraically the number of butterflies that should be observed if there are 20 flower species.
- Use the graph of function F = −2.641 + 8.958 log10 B to check your solution to question 1. Explain why the graph shown in question 2 cannot be used to check your answer for question 2.
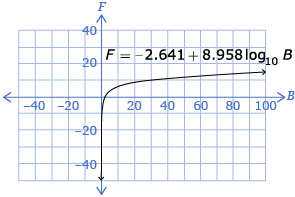
- Graph, using technology, the function F = −2.641 + 8.958 log10 B to check your answer to question 2. Explain the process you used.
Substitute 20 into the function for F and then solve for B using your knowledge of logarithms.
Substitute 100 into the function for B and then calculate the value.
1.11. Explore 7
Module 6: Exponents and Logarithms
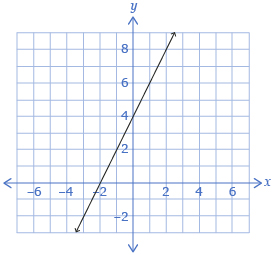
In Try This 4 you used a logarithmic function to determine the number of flowers and the number of butterflies observed in an area. You may have calculated that if there are 100 butterflies observed in an area, there would be approximately 15 flower species.
You may have found that when there are 20 flower species in an area, there should be approximately 337 butterflies observed.
You may have determined the number of butterflies observed by using a graph like this one:
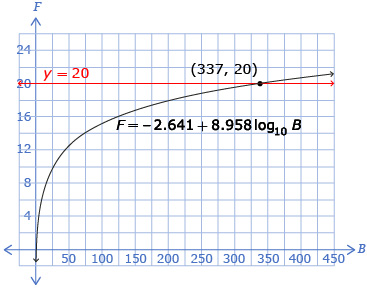
The intersection point of the graph is approximately (337, 20), so approximately 337 butterflies would be observed when there are 20 flower species in an area.
Self-Check 4
Add the following formula to your copy of Formula Sheet:
1.12. Connect
Module 6: Exponents and Logarithms
Complete the Lesson 4 Assignment that you saved in your course folder at the beginning of the lesson. Show work to support your answers.
![]() Save your responses in your course folder.
Save your responses in your course folder.
Project Connection
There is no Project Connection in this lesson.
1.13. Summary
Module 6: Exponents and Logarithms
Lesson 4 Summary
In this lesson you looked at graphing logarithmic functions and how transformations can be applied to logarithmic functions.
When a logarithmic function is in the form
Parameter |
Value > 0 |
Value < 0 |
a |
|
|
b |
|
|
h |
|
|
k |
|
|
In the next lesson you will continue to work with logarithms. You will explore how to work with multiple logarithms in an expression.