Lesson 3
| Site: | MoodleHUB.ca 🍁 |
| Course: | Math 30-1 SS |
| Book: | Lesson 3 |
| Printed by: | Guest user |
| Date: | Saturday, 27 December 2025, 2:09 AM |
Description
Created by IMSreader
1. Lesson 3
Module 7: Rational Functions and Function Operations
Lesson 3: Rational Graphs and Equations
Focus

iStockphoto/Thinkstock
Suppose that you need to move many tonnes of gravel and you have two trucks available. One truck is capable of completing the job in 15 trips, while the other truck is capable of completing the job in 25 trips. How could you determine the number of trips required if the two trucks drove together? This scenario can be modelled using rational functions.
In this lesson you will explore how some production and transportation problems can be solved using the graphs of rational functions.
Lesson Outcomes
At the end of this lesson you will be able to
- estimate the solutions to a rational equation by graphing
- determine extraneous roots of a rational equation
Lesson Question
You will investigate the following question:
- How can the graphs of rational functions be used to estimate solutions to a rational equation?
Assessment
Your assessment may be based on a combination of the following tasks:
- completion of the Lesson 3 Assignment (Download the Lesson 3 Assignment and save it in your course folder now.)
- course folder submissions from Try This and Share activities
- work under Project Connection
1.1. Launch
Module 7: Rational Functions and Function Operations
Launch
Do you have the background knowledge and skills you need to complete this lesson successfully? Launch will help you find out.
Before beginning this lesson you should be able to solve rational equations.
1.2. Are You Ready?
Module 7: Rational Functions and Function Operations
Are You Ready?
Complete these questions. If you experience difficulty and need help, visit Refresher or contact your teacher.
- Solve the equation
 What are the non-permissible values? Answer
 - Solve the equation
 where x ≠ ±1. Answer
 - Solve the equation
 Be sure to determine non-permissible values first. Answer
If you answered the Are You Ready? questions without difficulty, move to Discover.
If you found the Are You Ready? questions difficult, complete Refresher.
1.3. Refresher
Module 7: Rational Functions and Function Operations
Refresher
Watch Steps for Solving Rational Equations.
Go back to the Are You Ready? section and try the questions again. If you are still having difficulty, contact your teacher.
1.4. Discover
Module 7: Rational Functions and Function Operations
Discover

© Maridav/10972488/Fotolia
Try This 1
You and a friend have just returned from a weeklong river-kayaking trip. You drove to Dinosaur Provincial Park, paddled 145 km upstream on the Red Deer River to Drumheller, and then paddled back to Dinosaur Provincial Park. You estimate that you spent 48 h in the water, paddling the entire time. From previous experience you know that you paddle at about 8 km/h. Suppose that you were interested in how fast the river was moving during your trip.
- Let r be the average speed of the river in kilometres per hour.
Complete the following table.
Distance (km)
Average Speed (km/h) Time Upstream 145
8 − r
Downstream 145
- Use your times from the table and the total time taken for the trip to write an equation.
-
- Describe as many ways as you can to estimate or determine r from the equation you wrote in question 2.
- Use one of the strategies you listed to determine r to one decimal place.
- Which r-value should you choose? What does the other value represent?
-
- Graph the two functions
 and y2 = 48.
 - What occurs at r = 4 on your graph? Explain why this occurs.
- Graph the two functions
![]() Save your responses in your course folder.
Save your responses in your course folder.
Share 1
With a partner or group, discuss the following questions based on the information in Try This 1.
- Describe a strategy that allows you to use the graph of a rational function to estimate the solution(s) to a rational equation.
- Describe an easier way to estimate the river speed, if you were at the river, than that used in Try This 1.
![]() If required, save a record of your discussion in your course folder.
If required, save a record of your discussion in your course folder.
1.5. Explore
Module 7: Rational Functions and Function Operations
Explore
The graphs of rational functions can be used to estimate the solutions to rational equations using methods you have seen in previous lessons. In Try This 1 you may have noticed that if you graph each side of the equation as a separate function, the x-values of the intersections (the r-values in Try This 1) will give you the solutions to the equation.
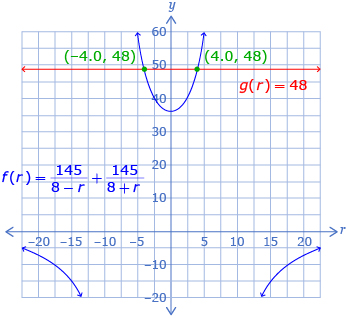
From this graph, the solutions to ![]() can be estimated as —4.0 and 4.0.
can be estimated as —4.0 and 4.0.
In previous sections you saw that there were multiple ways to estimate a solution from graphing. Try This 2 further explores another method.
Try This 2
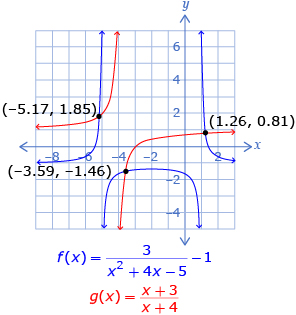
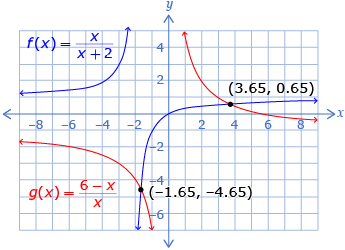
Consider the equation ![]()
-
- Plot
 and
and  on the same graph.
 - Determine the intersections of f(x) and g(x).
- Plot
-
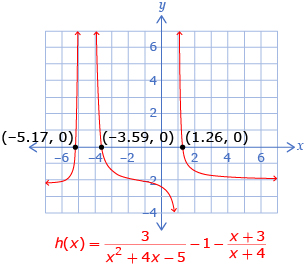
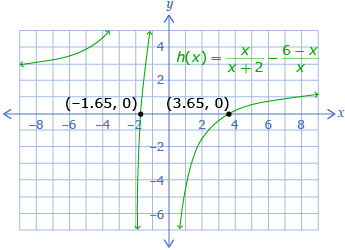
- How is
 related to
  ?
? - Plot h(x).
- Determine the x-intercepts of h(x). How are these values related to the ones you found in question 1.b?
- How is
-
- Explain a strategy that can be used to show that the x-values you found in questions 1.b. and 2.c. are solutions to
 .
. - Use your strategy to show that the x-values you found in questions 1.b. and 2.c. are solutions to
 .
.
- Explain a strategy that can be used to show that the x-values you found in questions 1.b. and 2.c. are solutions to
![]() Save your responses in your course folder.
Save your responses in your course folder.
Share 2
With a partner or group, discuss the similarities and differences between the two different graphing techniques used to solve rational equations in Try This 2. What benefits and/or drawbacks do you see to each method? Which method do you prefer?
![]() If required, save a record of your discussion in your course folder.
If required, save a record of your discussion in your course folder.
1.6. Explore 2
Module 7: Rational Functions and Function Operations
You have now used two different graphing methods to estimate solutions to rational equations:
- In Try This 1 you graphed two functions that correspond to each side of the equation. The value of x at the intersection point provides the solution in this method.
The equation can be solved by graphing
  The x-value of the intersection of these two functions is the solution to the equation.
- In Try This 2 you rearranged the equation so that one side is equal to 0, and then you graphed the function that corresponds to the other side of the equation. The zeros of the function, or x-intercepts of the graph, give the solutions using this method.
The equation can also be solved by rearranging
the equation to and graphing
 The x-intercepts will give the solutions to the equation.
Determining solutions graphically will usually give approximate solutions rather than exact ones. It is also possible to check solutions by showing that substituting the solutions into the original equation results in a true statement.
Read “Example 2” on pages 460 and 461 of the textbook to see another example of how approximate solutions are determined by graphing functions. Which method listed above do the methods “Use a Single Function” and “Use a System of Two Functions” from the textbook refer to?
Self-Check 1
Complete questions 1, 2, 4.a., and 4.b. on page 465 of the textbook. Answer
1.7. Explore 3
Module 7: Rational Functions and Function Operations
When solving a rational equation, it is common to come across extraneous roots. Try This 3 explores this idea.
Try This 3
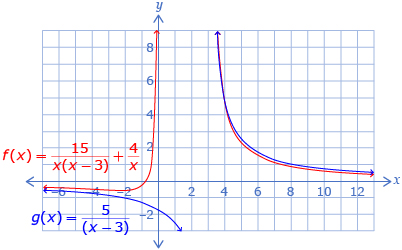
Tyrone and Kalina are trying to solve ![]()
Tyrone used an algebraic approach and wrote the following steps:
Kalina decided to use a graphical approach and made this graph. She agreed with Tyrone’s solution, as the functions on her graph looked as though they could possibly intersect at about x = 3 as the functions continued.
- Substitute x = 3 into
 to check that it is a solution.
 - What error did Tyrone make?

- What error did Kalina make?
- What should Tyrone and Kalina have stated as the solution to
 ? Explain.
1.8. Explore 4
Module 7: Rational Functions and Function Operations
In Try This 3 you may have found that ![]() has no solution. The error Tyrone made was that he did not identify the non-permissible values before solving; he also did not check his solution. A check would have determined that x = 3 is an extraneous solution. Kalina thought the graph crossed at x = 3 because the lines became very close at that point; x = 3 is actually an asymptote on the graph. Both f(x) and g(x) will approach the asymptote and each other, but they will never intersect.
has no solution. The error Tyrone made was that he did not identify the non-permissible values before solving; he also did not check his solution. A check would have determined that x = 3 is an extraneous solution. Kalina thought the graph crossed at x = 3 because the lines became very close at that point; x = 3 is actually an asymptote on the graph. Both f(x) and g(x) will approach the asymptote and each other, but they will never intersect.
Self-Check 2
1.9. Explore 5
Module 7: Rational Functions and Function Operations
Rational equations can be used to model and solve some problems. Consider the German tank problem in Try This 4.
Try This 4

iStockphoto/Thinkstock
In World War II, it was of interest to the Allies to know how many weapons, such as tanks, the Axis powers had produced. One method the Allies used to estimate this was to use the serial numbers of captured or destroyed weapons. For this strategy, the total number of serial numbers, n, and the largest serial number, m, of captured weapons were used. Two assumptions were then made using these serial numbers:
- The enemy produced at least as many as the largest serial number found.
- The number produced after the largest serial number found should be approximately the size of the average gap between serial numbers found.
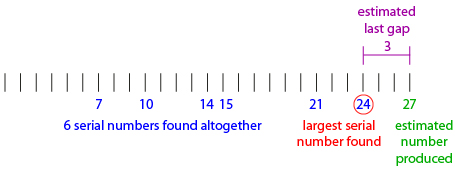
As an example, suppose that the Allies recovered tanks with engine serial numbers 7, 10, 14, 15, 21, and 24. The largest number found was 24, so assume that at least 24 tanks were produced. The average gap between serial numbers can be found by dividing the number of missing serial numbers by the number of serial numbers found, as follows:
This means there are approximately 3 more tanks than the 24 known for sure, so there were approximately 27 tanks produced.
-
- Explain why
 represents the average gap of missing numbers.
 - Using m and n as described, and T to represent the estimated total number of weapons produced, write a rational equation that can be used to estimate the total number of weapons produced.
- Use your equation to estimate the total number of weapons if 22 weapons are found and the largest serial number is 5217.
- Explain why
- Begin again with the formula you created in question 1.b.

- Set m as a constant at 1000. Graph the estimated total, T, as a function of the number of weapons found, n.
- Set n as a constant at 100. Graph the estimated total, T, as a function of the largest serial number found, m.
- Which variable, m or n, appears to have a greater effect on the estimate of weapons? Explain.
-
- Suppose that the Axis powers found out what the Allies were doing and wanted to trick the Allies into thinking they had produced more weapons than they really had. If they were able to determine that the Allies had captured approximately 250 weapons of a particular type, and wanted them to believe they had 7000, what fake serial number should they let the Allies capture? Solve using a graphical method.
- How important is the estimate of 250 in determining the fake serial number in the question 3.a? Explain.
- Explain whether or not you think the Allies would have fallen for the trick.
![]() Save your responses in your course folder.
Save your responses in your course folder.
Share 3
With a partner or group, discuss the following questions based on the information from Try This 4.
- Explain any problems you see using the estimating procedure described in Try This 4.
- Describe a manufacturing method that could be used to make it harder to predict weapon numbers from serial numbers.
![]() If required, save a record of your discussion in your course folder.
If required, save a record of your discussion in your course folder.
1.10. Explore 6
Module 7: Rational Functions and Function Operations
Read “Example 4” on pages 463 and 464 of the textbook to see another example of how a problem can be solved using a rational equation.
Self-Check 3
Complete questions 11, 12, and 13 on pages 466 and 467 of the textbook. Answer
1.11. Connect
Module 7: Rational Functions and Function Operations
Complete the Lesson 3 Assignment that you saved in your course folder at the beginning of this lesson. Show work to support your answers.
![]() Save your responses in your course folder.
Save your responses in your course folder.
Project Connection
You are now ready to apply your understanding of rational functions. Go to Module 7 Project: Shipping Wars, and complete Part 1.
![]() Save your responses in your course folder.
Save your responses in your course folder.
1.12. Lesson 3 Summary
Module 7: Rational Functions and Function Operations
Lesson 3 Summary
In this lesson you explored how the graphs of rational functions can be used to solve rational equations. You saw two common methods that you may have used in previous modules or courses for other types of equations. The first method was to graph a function that corresponds to each side of the equation and determine where the functions intersect. The second method was to rewrite the equation so that one side is equal to 0, and then graph the function that corresponds to the other side of the equation and determine the x-intercepts. Both methods typically give approximate solutions.
To solve ![]() it is possible to graph
it is possible to graph ![]() and find any intersections.
and find any intersections.
The x-values of these intersections will be the solutions.
To solve
This is the end of the first half of this module. You explored rational functions. In the second half of this module you will investigate methods of combining separate functions using various function operations.