Module 1: Lesson 2
Self-Check 1
- “Build Your Skills” questions 1, 2, 3, 5, and 6 on pages 162 and 163
-
- There are 13 clubs in a deck of cards and 52 total cards.
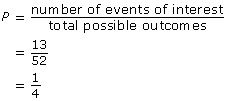
The probability that a card randomly chosen from a deck of cards will be a club is This can also be written as 0.25, 25%, or 1 out of 4.
 - There are 26 red cards in a deck of cards and 52 total cards.
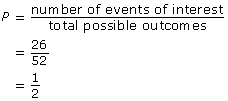
The probability that a card randomly chosen from a deck of cards will be a red card is This can also be written as 0.5, 50%, or 1 out of 2.
 - There are 4 queens in a deck of cards and 52 total cards.
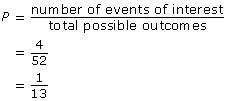
The probability that a card randomly chosen from a deck of cards will be a queen is This can also be written as 0.077, 7.7%, or 1 out of 13.
 - There are 2 black 7’s in a deck of cards and 52 total cards.
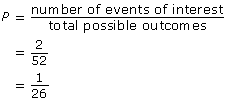
The probability that a card randomly chosen from a deck of cards will be a black 7 is This can also be written as 0.038, 3.8%, or 1 out of 26.
- There are 13 clubs in a deck of cards and 52 total cards.
-
- There are 5 two year olds and 23 children in total.

The probability that the child is two years old is This can also be written as 0.22, 22%, or 5 out of 23.
 - There are 11 three year olds and 23 children in total.

The probability that the child is three years old is This can also be written as 0.48, 48%, or 11 out of 23.
 - There are 7 four year olds and 23 children in total.

The probability that the child is four years old is This can also be written as 0.30, 30%, or 7 out of 23.
- There are 5 two year olds and 23 children in total.
- The probability for precipitation is 60%.
Convert this to a decimal.
60 ÷ 100 = 0.6
Subtract this from 1 to find the probability of no precipitation.
1 − 0.6 = 0.4
The probability of no precipitation is 0.4 or 40%.
-
- Calculate how many possible outcomes there are when rolling two dice. One die has 6 possible outcomes, and the second die also has 6 possible outcomes. To find out how many combinations there are in total, multiply the number of possible outcomes for each die.
6 × 6 = 36
There are 36 possible combinations when rolling a pair of dice. There are 6 ways to roll doubles. Calculate the probability.
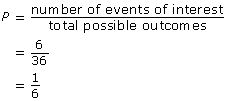
The theoretical probability of rolling doubles is 1 out of 6. - Calculate the experimental probability of rolling doubles.
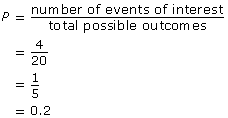
The experimental probability of rolling doubles is 0.2, 20%, or 1 out of 5.
 - Using Zoe’s experimental results, calculate how many times she is likely to roll doubles.

Based on the probability calculated in b., Zoe would roll doubles 100 times. - If 20 students rolled the dice 75 times each, calculate the total number of rolls.
20 × 75 = 1500
The students would have rolled the dice 1500 times. If the results are similar to Zoe’s, calculate how many times doubles are likely to have been rolled.

If the probability shown in Zoe’s experiment in part b. is correct, the students will roll doubles about 300 times.
Using theoretical probability, calculate how many times they would roll doubles.

According to the theoretical probability, the students would roll doubles 250 times.
With a sample size as large as 1500 trials, the actual number of rolls of doubles would probably be closer to the theoretical probability than the experimental probability.
- Calculate how many possible outcomes there are when rolling two dice. One die has 6 possible outcomes, and the second die also has 6 possible outcomes. To find out how many combinations there are in total, multiply the number of possible outcomes for each die.
-
- The theoretical probability that person will select Joyce is 1 out of 4, because there are 4 possible outcomes and 1 event or interest.
- Calculate the experimental probability of a person saying he or she would vote for Bill.

- The experimental probability would be a better indicator of how a person would vote. Calculate the experimental probability of a person saying he or she would vote for Mansour.

The experimental probability that a person asked on the street would say he or she is voting for Mansour is 0.178.
However, you would probably need to consider some other factors when predicting what the person might respond. Voting trends often depend on demographics, so you would need to know which people tend to plan to vote for Mansour (such as males vs. females, young people vs. older people, and certain neighbourhoods).
-
Source: MathWorks 12 Student Book/Teacher Guide. (Vancouver:
Pacific Educational Press, 2011.)