Module 2: Lesson 2
Self-Check 3
- “Your Turn” on page 85
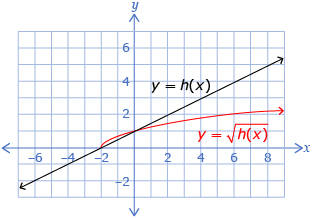
The graph can be split up into four regions:
- When x < −2, the graph of the square root function will be undefined.
- When −2 < x < 0, the y-value of the graph of the square root function will be greater than the y-value of the original graph.
- When x > 0, the y-value of the graph of the square root function will be less than the y-value of the original graph.
- When x = −2 and x = 0, the two graphs have the same y-value (they are invariant points).
This should result in a graph that looks as follows:
© 2012 Alberta Education