Lesson 3: Slope Intercept Form
Module 5: Linear Functions
Explore

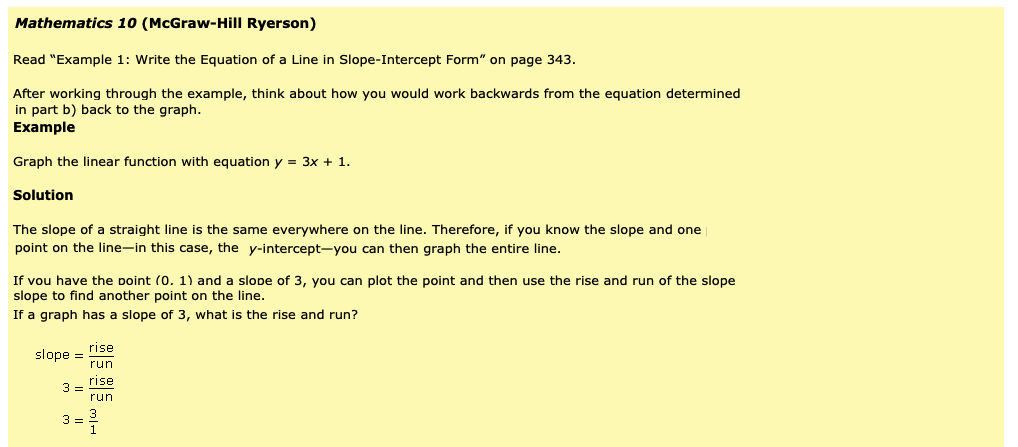
© Steven Pepple/427025/Fotolia
You have seen in previous lessons that there are many ways of representing linear relations. In this lesson you will relate the graph of a linear function to its equation in slope-intercept form. You will also have an opportunity in subsequent lessons to examine other forms of the equation of a linear function.
Glossary Terms
Add the following term to your "Glossary Terms" section in your noted. Include a definition and perhaps add examples that demonstrate the term.
- slope-intercept form
-------------------------------------------------------------------------
You have seen in Math Lab: Exploring Graphs of Linear Functions that the equation of a linear function can be written in the form
y = mx + b, where m represents the slope and b represents the y-intercept.
For example, the linear function with equation y = 2x + 1 has a slope of 2 and crosses the y-axis at (0, 1). Try the following activities to see how you can determine the equation of a linear function given its graph, and sketch the graph of a linear function given its equation.
![]() Try This 1 - 2
Try This 1 - 2
Print (or complete by hand) and complete the following in your binder.
Use the link below to check your answers to Try This 1 - 2.
![]() Read
Read
Read the sections in your textbooks that relate the graph of a linear function to its equation.
Foundations and Pre-calculus Mathematics 10 (Pearson)
First, read “Example 2: Graphing a Linear Function Given Its Equation in Slope-Intercept Form” on page 359. Next, read “Example 3: Writing the Equation of a Linear Function Given Its Graph” on page 360.
Focus on how the slope and y-intercept of a line is extracted from an equation and applied to the graph of the line.
![]() Self-Check
Self-Check
SC 1. Complete Identifying Slope and y-intercept quiz using the link below. (Note - some of the questions are missing some negative signs)
SC 2. For each of the following slopes and y-intercepts, draw the matching graph. Use the grid paper provided here:
Grid paper
-
slope =
 ; y-intercept −1
 -
slope =
 ; y-intercept 3
 -
slope = 0; y-intercept 3
![]() Try This 3
Try This 3
Complete the following questions from your textbook in your course folder ( binder).
Use the provided grid paper if necessary.
Grid paper
Foundations and Pre-calculus Mathematics 10 (Pearson)
TT 3. a. Complete “Exercises” questions 4.b), 4.c), 4.f), 5.a), 5.c), 5.e), 6.c), and 6.d) on page 362.
b. Complete “Exercises” questions 12.a), 12.b), and 12.d) on pages 362 and 363. Note: Only complete parts i) and ii); do not complete part iii).
c. Complete “Exercises” questions 17 and 18 on pages 363 and 364.
Use the link below to check your answers to Try This 3.