Lesson 2
1. Lesson 2
1.3. Explore 3
Module 4: Statistical Reasoning
The larger the standard deviation, the more spread out the data is—more data is further from the mean. The lower the standard deviation, the more clustered the data is about the mean—more data is close to the mean.
Standard deviation is another tool that provides information that you can use to draw inferences from numerical data and compare two or more data sets.
Outliers (one or two numbers in the data that are much larger or smaller than most of the data) can significantly affect all summary statistics for a set of data. If your data set has an outlier, the measure of central tendency most affected is the mean. Both measures of dispersion, the range and standard deviation, are also affected by an outlier. If you are using range and/or standard deviation as part of summary statistics, the outlier should be removed before performing the calculation.
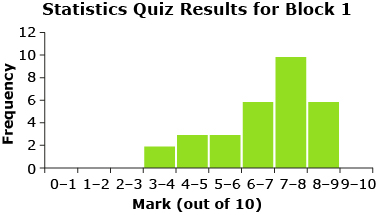
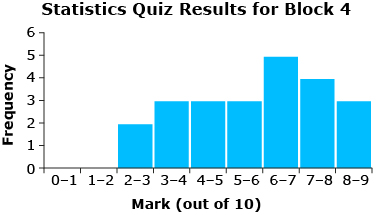
Take a look at the quiz results from Mr. Kong’s two classes. Consider the following questions:
- Just by looking at the histograms for each block, can you tell which set of data would have the higher standard deviation? How do you know?
- Is this consistent with what you would expect, given the result for the other measure of dispersion (range)?
|
Statistics Quiz Block 1 |
|
|
number of quizzes |
30 |
|
mean |
7.1 |
|
mode |
7 |
|
median |
7.5 |
|
range |
5 |
|
Statistics Quiz Block 4 |
|
|
number of quizzes |
25 |
|
mean |
6.5 |
|
mode |
7 |
|
median |
7 |
|
range |
6.5 |
The histograms show that the data for Block 4 is more dispersed or spread out about the mean than the data for Block 1. Therefore, Block 4 has a higher standard deviation than Block 1. This makes sense since the range for the quiz marks in Block 4 is larger than the range of marks for Block 1.