Lesson 3
1. Lesson 3
Module 4: Statistical Reasoning
Lesson 3: The Normal Distribution
Focus
Most high schools have a set amount of time in between classes in which students must get to their next class. If you were to stand at the door of your statistics class and watch the students coming in, think about how the students would enter. Usually, one or two students enter early, then more students come in, then a large group of students enter, and then the number of students entering decreases again, with one or two students barely making it on time, or perhaps even coming in late! Try the same by watching students enter your school cafeteria at lunchtime. Spend some time in a fast food restaurant or café before, during, and after the lunch hour and you will most likely observe similar behavior.
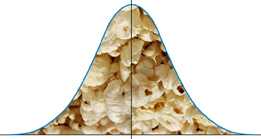
Have you ever popped popcorn in a microwave? Think about what happens in terms of the rate at which the kernels pop. Better yet, actually do it and listen to what happens! For the first few minutes nothing happens, then after a while a few kernels start popping. This rate increases to the point at which you hear most of the kernels popping and then it gradually decreases again until just a kernel or two pops. Try measuring the height, or shoe size, or the width of the hands of the students in your class. In most situations, you will probably find that there are a couple of students with very low measurements and a couple with very high measurements with the majority of students centered around a particular value.
c CK Foundation, Creative Commons Attribution-NonCommercial-ShareAlike 3.0 Unported License
These two examples show a typical pattern that seems to be a part of many real life phenomena. In statistics, because this pattern is so pervasive, it seems fit to call it “normal,” or more formally the normal distribution. The normal distribution is an extremely important concept because it occurs so often in the data we collect from the natural world, as well as many of the more theoretical ideas that are the foundation of statistics.
—c CK Foundation, Creative Commons Attribution-NonCommercial-ShareAlike 3.0 Unported License
This lesson will help you answer the following critical question:
- How can the properties of a distribution of data be used to compare data and make decisions?
Assessment
- Lesson 3 Assignment
All assessment items you encounter need to be placed in your course folder.
![]() Save a copy of the Lesson 3 Assignment to your course folder.
Save a copy of the Lesson 3 Assignment to your course folder.
Materials and Equipment
- calculator
- ruler
- 1-cm Grid Paper or 2-cm Grid Paper