Lesson 4
1. Lesson 4
1.2. Explore
Module 4: Statistical Reasoning
Explore
In Share 1 you and your partner may have determined that in order to meaningfully compare the two math marks, you need more information. At first glance, it appears that a mark of 78% is better than a mark of 77%. However, since these marks are so close, is there a better way to determine which student is demonstrating a greater understanding of math? For instance, if you knew the mean and standard deviation of each class, you could do a sketch of a normal curve for each class.
Suppose you were given the following information about Avery and Zachary’s math classes.
| Avery’s Class | Zachary’s Class |
| μ = 75.5% | μ = 76.5% |
| σ = 2.0% | σ = 2.5% |
The normal curves for each class might look something like the following.
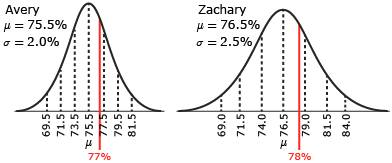
The normal curves might give you an idea of who is demonstrating a greater understanding in math. The student that is the farthest to the right on the curve would have demonstrated the greatest understanding. However, the answer might not be clear. You are comparing two very similar yet different normal curves. Because they are so similar, deciding which which mark is farther to the right may be difficult.
You and your partner may have thought about comparing the two math marks on the same normal curve; but, you can’t use the same normal curve unless the mean and the standard deviation are the same. In order to do this, you would need a way to standardize the math marks to fit on a common normal distribution. Then you could determine how many standard deviations each mark is away from the mean.
z-score: a measure of the number of standard deviations a particular data value is above or below the mean
standard normal distribution: a normal distribution that has a mean of zero and a standard deviation of one
—From CANAVAN-MCGRATH ET AL. Principles of Mathematics 11,
©2012 Nelson Education Limited. Reproduced by permission.
There is a way to standardize the marks! A z-score can be used to compare Avery and Zachary’s marks on the same normal distribution. A z-score is a measure of the number of standard deviations a particular data point is away from the mean on a standard normal distribution. A standard normal distribution is a normal distribution with a mean of zero and a standard deviation of one.
From CANAVAN-MCGRATH ET AL. Principles of Mathematics 11, © 2012 Nelson Education Limited. Reproduced by permission.
Any data point, x, from a normal distribution is a certain number of standard deviations away from the mean. This can be represented by the equation ![]() where z represents the z-score (i.e., the number of standard deviations the data point is away from the mean). A positive z-score means that the data value is above the mean. A negative z-score means that the data value is below the mean.
where z represents the z-score (i.e., the number of standard deviations the data point is away from the mean). A positive z-score means that the data value is above the mean. A negative z-score means that the data value is below the mean.
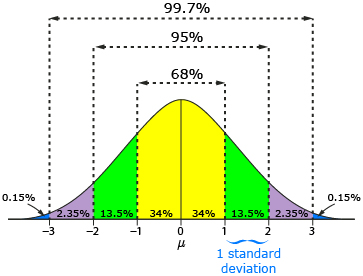
Look at the marks in Zachary’s math class again. You know that μ = 76.5% and σ = 2.5%. If you were in Zachary’s math class and you had a mark of 79%, it is exactly one standard deviation above the mean (76.5 + 2.5 = 79). If your mark was 69%, you can see that it is exactly three standard deviations below the mean (76.5 − 2.5 − 2.5 − 2.5 = 69).
To calculate a z-score that is not so easy to see, use this formula:
![]()
For instance, you would use the formula to calculate a z-score that is not exactly one, two, or three standard deviations from the mean.
Recall that Avery has a math mark of 77% and Zachary has a math mark of 78%. The mean mark for Avery’s class is 75.5% with a standard deviation of 2%. The mean mark for Zachary’s math class is 76.5% with a standard deviation of 2.5%. You can compare how far above or below the mean the marks are by calculating z-scores for them.
| Avery: | Zachary: |
 |
 |
So, Avery’s math mark is 0.75 standard deviations above the mean, and Zachary’s is 0.6 standard deviations above the mean. Each student’s z-score is shown on the following standard normal distribution.

So, when the marks are standardized, Avery’s mark is farther to the right on the standard normal distribution, with a z-score of 0.75, as compared to Zachary’s z-score of 0.6. Therefore, Avery actually has the better mark.
Read “Example 1: Comparing z-scores” on pages 283 to 284 of the textbook. As you work through the example, notice the importance of standardizing Hailey’s run times in order to get a true comparison.
Self-Check 1
- What z-score corresponds with each location on a standard normal curve?
- 1 standard deviation above the mean
- 1 standard deviation below the mean
- equal to the mean
- 1.5 standard deviations above the mean
- 3.2 standard deviations below the mean
- 1 standard deviation above the mean
- Complete “Check Your Understanding” question 1 on page 292 of the textbook. Answer
- Complete “Practising” question 10 on page 292 of the textbook. Answer