Lesson 4
1. Lesson 4
1.3. Explore 2
Module 4: Statistical Reasoning
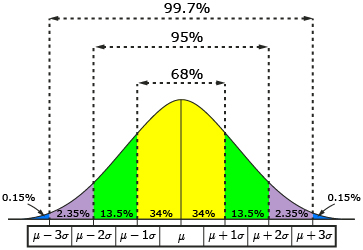
In Lesson 3 you learned that the 68%-95%-99.7% property of normal distributions could be used to make estimates about data that is exactly one, two, or three standard deviations away from the mean. But as you have seen so far in this lesson, the data value you need may not be exactly one, two, or three standard deviations away from the mean.
There are an infinite number of standard deviations that a data value can be above or below a mean. For instance, a data value could be 1.56, 0.25, or 3.02 standard deviations above the mean. A data value could also be 2.79, 0.5, or 3.58 standard deviations below the mean.
Consider the following situation.
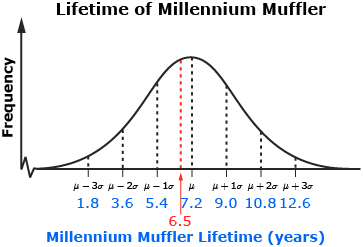
A muffler company makes and supplies the car industry with mufflers. The lifetime of the company’s best-selling muffler, the Millennium Muffler, is normally distributed with a mean of 7.2 years and a standard deviation of 1.8 years. The company wants to determine what percentage of its Millennium Mufflers will last less than 6.5 years.
To visualize the situation, you can sketch the normal distribution for the lifetime of the Millennium Muffler.
A lifetime of 6.5 years is between the mean and one standard deviation below the mean. Z-scores can be used when you are dealing with normally distributed data values that are not exactly one, two, or three standard deviations away from the mean.
The z-score formula can be used to determine the z-score for a muffler life of 6.5 years.
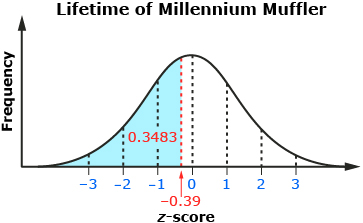
A muffler life of 6.5 years is about 0.39 standard deviations below the mean. A z-score of −0.39 is shown on a standard normal curve. The company wants to determine the percentage of Millennium Mufflers that will last less than 6.5 years. This is equivalent to the area under the curve to the left of −0.39 on the standard normal curve.

z-score table: a table that displays the fraction of data with a z-score that is equal to or less than a given value in a standard normal distribution
— From CANAVAN-MCGRATH ET AL. Principles of Mathematics 11,
© 2012 Nelson Education Limited. Reproduced by permission.
A z-score table can be used to determine the percent of data that is equal to or less than (i.e. to the left of) any given z-score in a standard normal distribution.
A z-score table can be found on pages 580 and 581 of the textbook. Or you can go to Z-Score Table to see an example.
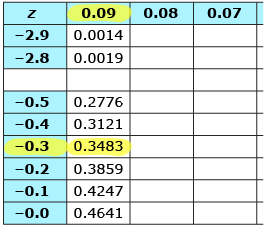
When you read a z-score table, you begin by rounding your z-score to two decimal places. Locate the z-score up to the first decimal place in the left-hand column of the table. Then find the second decimal place in the row across the top of the table. Where the row and column intersect, you will find your z-score value. For a z-score of −0.39, find the −0.3 row and then the 0.09 column on the z-score table.
From CANAVAN-MCGRATH ET AL. Principles of Mathematics 11,
© 2012 Nelson Education Limited. Reproduced by permission
The value in the table is 0.3483. This is the fraction of the area under the curve that is to the left of a z-score of −0.39. This means that about 34.8% of Millennium Mufflers will have a lifetime of 6.5 years or less.