Module 3 Project
1. Module 3 Project
1.1. Page 2
Module 3: Slope and Rate of Change
Step 2
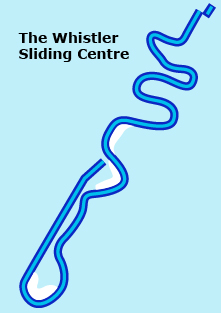
Look at the following diagram to see what the Whistler track is like.
Watch the “Track Calgary” video to take a virtual ride on the track at Canada Olympic Park.
Winter Olympic Games Organizing Committee Official Report,
(Calgary: Calgary Olympic Development Committee, 1988),
p. 119. Reproduced with permission.
- Use the information from the following charts to calculate the mean slopes of the men’s luge tracks at Whistler and Calgary. Do they fall within the safety guidelines of an average slope of 8% to 11%? (The starting point of the 2010 Olympic men’s luge event at Whistler was moved down the hill before the Olympics for safety reasons.) (4 marks)
WHISTLER SLIDING CENTRE Track Statistics
Length (bobsleigh and skeleton)
1450 m Length (men’s luge)
1374 m Length (doubles and women’s luge)
1198 m Vertical Drop
152 m Number of Corners
16 CANADA OLYMPIC PARK Track Statistics
Length (bobsleigh and skeleton)
1475 m Length (men’s luge)
1251 m Length (doubles and women’s luge)
1081 m Vertical Drop
104.2 m Number of Corners
14
Use the profile animation Whistler’s Slope to answer questions 2 to 4.
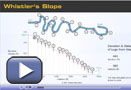
- Turn 2 at Whistler’s luge track, called Fallaway, is the steepest part of the run. Calculate the slope through Fallaway. (3 marks)
- Do any sections have a zero slope? Explain. (2 marks)
- Do any sections have a slope that does not exist? Explain. (2 marks)
Use the profile animation Calgary’s Slope to answer questions 5 to 7.
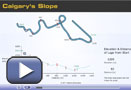
- Where on the Calgary’s track is the steepest section? Calculate the slope. (4 marks)
- Do any sections have a zero slope? Explain. (2 marks)
- Do any sections have a slope that does not exist? Explain. (2 marks)