Lesson 5: Slope as a Rate of Change
| Site: | MoodleHUB.ca 🍁 |
| Course: | Mathematics 10C |
| Book: | Lesson 5: Slope as a Rate of Change |
| Printed by: | Guest user |
| Date: | Friday, 19 December 2025, 5:23 AM |
Module 4: General Relations
Lesson 5: Slope as a Rate of Change
Focus

© Jim Parkin/shutterstock
Did You Know?
The 2008 Summer Games were difficult for the USA track team. The women’s 4 × 100 m relay team also dropped a baton. Unlike the men’s team, however, the women’s team finished the race.
A relay race in track and field typically consists of four runners, each running an equal part of the race. For example, in a 4 × 200 m relay race, each of four participants will run a 200-m leg of the race. A critical part of the race involves the passing of a baton from runner to runner. At the 2008 Summer Olympic Games in Beijing, China, the 4 × 100 m USA men’s relay team dropped the baton and was consequently disqualified from the event.
The progress of a runner can be graphed on a distance-time graph. The slope of such a graph represents the ratio of the change in distance and the change in time. This rate is better known as the speed.
In this lesson you will investigate slope as a rate of change. You will learn how to construct lines and find points on lines given sufficient information. These concepts will then be applied to problem-solving situations.
Outcomes
At the end of this lesson, you will be able to
-
draw a line, given its slope and a point on the line
-
determine another point on a line, given the slope and a point on the line
-
explain, using examples, slope as a rate of change
-
solve contextual problems involving slope
Lesson Questions
-
How is the slope of a line related to the dependent and independent variables of a graph?
-
How can slope be used to make predictions about the outcome of certain events?
 Lesson Completion and Assessment
As you work through each lesson, complete all the questions and learning activities in your binder using paper and pencil, clearly labeling your work (they refer to this as your course folder). These include the Are you Ready, Try This, Share and Self Check questions. Check your work if answers are provided. Remember that these questions provide you with the practice and feedback that you need to successfully complete this course.
Once you have completed all of the learning activities, take the Lesson Quiz. This is the assessment for each lesson and is located under the Assess tab or by using the Quizzes link under the Activities block.
** Note – Share questions may have to be done on your own depending on your learning situation**
Module 4: General Relations
Launch
This section checks to see if you have the prerequisite knowledge and skills to be able to complete this lesson successfully.
Are You Ready?
Complete these questions in your course folder (binder). If you are experiencing difficulty, you may want to use the information and the multimedia in the Refresher section to clarify concepts before completing these exercises.
Print (or copy by hand) and complete.
Once you have completed these exercises to the best of your ability, use the provided answer link to check your work.
Answers
If you feel comfortable with the concepts covered in the questions, move forward to Discover. If you experienced difficulties or want more practice, use the resources in Refresher to review these important concepts before continuing through the lesson or contact your teacher.
 Refresher
The purpose of this section is to provide you with some resources to review in preparation for the lesson ahead. These resources may include videos, interactive applets, mini-lessons, and flash games to help you recall previously learned concepts. You can use these resources either before or after you try the questions in Are You Ready? Your teacher may also direct you to this section to review specific concepts.
Watch the following song on “Rise, Run, and Slope” . It is a fun way to review these concepts.

Use the “Pythagorean Theorem” applet to see a visual definition of the Pythagorean theorem.
Materials
Discover
 Math Lab: Analyzing Slope
You will study a graph that records the results of four runners in a 4 × 200 m relay race. 
© Suzanne Tucker/shutterstock
Go Math Lab: Analyzing Slope, print it (or copy by hand) and complete it.
Math Lab: Analyzing Slope
Once you have completed these questions, use the link below to check your answers. Make any corrections or notes as needed. File this in your binder( course folder) to refer to later.
Mathematics 10C Learn EveryWare © 2010 Alberta Education
Module 4: General Relations
Explore

© SVLumagraphica/shutterstock
Running in a cross-country race or a marathon is very different from running in a sprinting event. Besides being different distances, the strategy that an athlete brings to each type of race is also different. Unlike short-distance races where you want to run as fast as you can from start to finish, you need to run at a steady pace in order to succeed in a long-distance race. In these cases, a long-distance runner needs to balance energy conservation with holding a good position amongst the other competitors.
For these reasons, the speed of a long-distance runner is fairly constant throughout the race. The progress of a long-distance runner can be modelled by a relatively straight line on a distance-time graph.
In this lesson you will learn how to interpret the slope as a rate and how to use the slope and another point to predict other values along the graph.
Glossary Terms
Add the following term to your "Glossary term" section in your notes.
- rate of change
-------------------------------------------------------------------
The slope of a line is constant. Regardless of which pair of points on a line is used to calculate slope, the result will be the same. If you know the slope of a line and a point on that line, then you can do the following:
-
Find other points on the line.
-
Draw the line.
![]() Try This 1 - 2
Try This 1 - 2
Print (or copy by hand) and complete the following in your course folder ( binder).
Use the link below to check your answers to Try This 1 - 2.
Possible TT1- 2 (Try This 1- 2) Solutions
The following example shows a similar question to the one you just completed. Compare the solution in this example to the method you used.
Example
A line passes through the point (–2, –5) and has a slope of 3.
- Determine two other points on the line.
- Sketch the line.
Solution
- To determine the rise and run of a slope of 3, write the slope as a fraction.
Step 1: Determine the rise and run of the slope.
slope = 3
Therefore, the rise is 3 and the run is 1.
Step 2: Graph the point (–2, –5). Then apply a rise of 3 units up and a run of 1 unit to the right to find another point on the line. The second point will have coordinates (–1, –2).
Since , you could also apply a rise of –3 and a run of –1. In other words, you could also move down 3 units and left 1 unit.
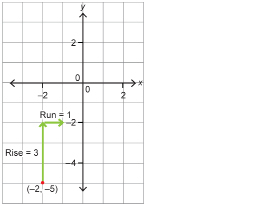
Step 3: Since the slope of a line is constant, you can find additional points by applying the rise and the run to each new point. A third point found in this way is (0, 1).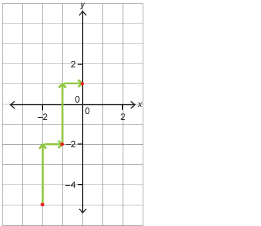
- Use a straightedge to connect the points on the graph with a line.
 Tips
Tips
1. You only need two points to construct a line, but you can improve the accuracy of the line by using more than two points. Or you may use two points that are separated by a greater distance.
In either case, you would have to apply the rise and run more than once.
2. Double check that your line has the right slope by remembering that lines with
a positive slope, rise to the right and
a negative slope, fall to the right.
 Watch and Listen
Watch the following short video clips to confirm that you understand how to plot a line given a point and the slope of the line.
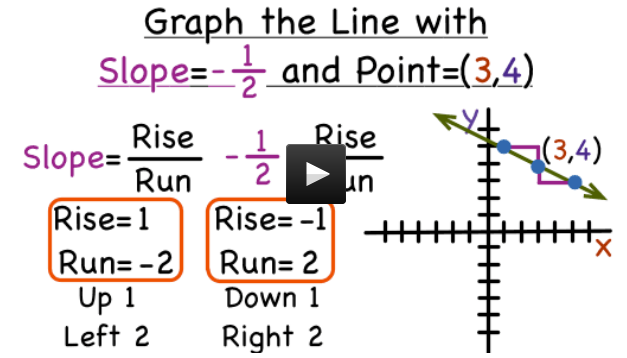
Now watch the “Slope of a Line” video to review the concepts of slope that you learned in Lessons 4 and 5 of this module. The context of the video is based on going to a carnival. ** Scroll down to find the video** . You have previously viewed segments of this video.

 Self-Check
For each of the following self-checks, make a graph of a line through the given point with the given slope.
SC 1. A point at (–3, 2) and a slope of ![]()
SC 2. A point at (5, 6) and a slope of ![]()
SC 3. A point at (–4, –3) and a slope of –2.
![]() Try This 3
Try This 3
Complete the following in your course folder ( binder).
Foundations and Pre-calculus Mathematics 10 (Pearson)
TT 3. Complete “Exercises” questions 9.c), 9.d), 23.b), and 23.d) on pages 340 and 341.
Print the provided grid page to graph.
Grid page
Use the link below to check your answers to Try This 3.
Possible TT3 (Try This 3) Solutions
|
A vertical intercept is where the line crosses the vertical axis. This is often referred to as the y intercept. |

Slope as a Rate of Change
The slope of a line shows how the vertical quantity on a graph changes as the horizontal quantity changes. The slope is the constant rate of change. You can determine this rate of change by evaluating any two points on the line by dividing the change in the vertical measure by the change in the horizontal measure.
Retrieve your results from Math Lab: Analyzing Slope. In the lab, you analyzed a distance-time graph representing the running times of a 4 × 200 m relay team. You constructed a straight line connecting the first and last points on the graph. You may have discovered that this line represents the average speed of the relay team. The slope units will help you to determine what the slope represents.
In the Math Lab, you may have calculated the slope in this way:
By looking at the slope units, you will know that this value is a measure of speed.
![]() Read
Read
In the following example, you will determine and interpret the slope in a different context. Look for the answer to the following question as you work through the example.
Foundations and Pre-calculus Mathematics 10 (Pearson)
Read “Example 4: Interpreting the Slope of a Line” on pages 338 and 339. What other information can you calculate once you have determined the rate of change?
![]() Self-Check
Self-Check
Try the following Self-Check questions to ensure you understand how to evaluate the slope of a line and interpret the slope as a rate of change. In these questions you will also be using the rate of change to predict other values in the context of the question.
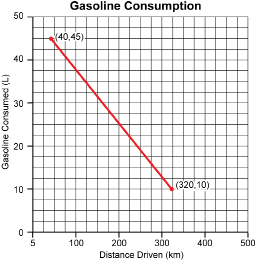
The graph shows the amount of gasoline remaining in the fuel tank after a vehicle has been driven certain distances. You will use this graph to answer SC 4, SC 5, and SC 6.
SC 4. What is the slope of the line through these points? Include units.
SC 5. What rate of change does the slope represent?
SC 6. Explain how the rate of change in SC 5 can be used to determine the following.
- How far can the vehicle be driven before it runs out of gas?
- What is the maximum capacity of the gas tank?
![]() Try This 4
Try This 4
Complete the following in your course folder ( binder).
Foundations and Pre-calculus Mathematics 10 (Pearson)
TT 4. Complete “Exercises” questions 25, 26, and 27 on page 342.
There is a grid provided for 25.
Use the link below to check your answers to Try This 4.
Module 4: General Relations
Connect
 Lesson Assessment
Complete the lesson quiz posted under the Assess tab or by using the Quizzes link under the Activities block. Also, ensure your work in your binder (course folder) is complete.
 Project Connection ** NOT ASSIGNED**

© Martin Horsky/shutterstock

© Epic Stock/shutterstock
In Lessons 4 and 5 you have examined the slope of a line. Now it is your turn to choose a sport and create a graph that fits possible data from your chosen sport. At this time, go to the Unit 3 Project and complete the Lesson 5 component of the project.
 Going Beyond
iStockphoto/Thinkstock
Skiing and snowboarding have evolved to become more acrobatic, with the use of terrain park jumps and other features. As the sports become more acrobatic, however, there has been an increase in serious spinal cord injuries.
Landing impact is determined by the skier’s velocity perpendicular to the slope. To reduce the impact on the skier or boarder’s body, the landing surface slope should be nearly equal to the skier or boarder’s flight path slope at landing. Such “safe” surfaces can still yield exhilarating flight experiences with big air, but without as much danger as the jumps created without any design planning.
Conduct an Internet search to find out more about the slope of a jumper’s flight path and the slope of the hill in the jumper’s landing area. What can a skier or boarder do to reduce the risk of injury when attempting to get big air?
Module 4: General Relations
Lesson 5 Summary
In this lesson you investigated the following questions:
-
How is the slope of a line related to the dependent and independent variables of a graph?
-
How can slope be used to make predictions about the outcome of certain events?
You were previously introduced to slope as a way to measure the steepness of a line. In this lesson you learned how to draw a line with a given slope through a particular point. You also learned that, with a slope and a point, you can determine other points on the line. In this way, a slope can be used to predict other values on a line.
In the second half of Lesson 5 you investigated slope as a rate of change. Since the slope of a line is the vertical change divided by the horizontal, slope can also be interpreted as the change in the dependent variable compared to the change in the independent variable. You learned that you can interpret the slope in any context by writing the units of the slope as the units of the dependent variable divided by the units of the independent variable. For example, the slope of a distance-time graph could be metres per second, or a measure of speed.
In Module 5 you will investigate linear relations. You will build on your knowledge of slope by investigating the slopes of parallel and perpendicular lines. You will also see how the slope of a line is used to determine its equation.