Lesson 3: Slope Intercept Form
| Site: | MoodleHUB.ca 🍁 |
| Course: | Mathematics 10C |
| Book: | Lesson 3: Slope Intercept Form |
| Printed by: | Guest user |
| Date: | Tuesday, 4 November 2025, 3:34 AM |
Description
Created by IMSreader
Module 5: Linear Functions
Lesson 3: Slope-Intercept Form
Focus

Jupiterimages/Pixland/Thinkstock
The high jump is one of the oldest Olympic disciplines. Athletes compete to see who can jump the highest over a horizontal bar onto a pad on the other side. In each round of the competition, the bar is raised by equal increments.
Over the years, the jumping techniques have evolved. Early techniques included the scissors technique, the Western roll, and the Fosbury flop, which is shown in the photo. The last technique is named for Dick Fosbury, who pioneered the approach and used it to win the gold medal at the 1968 Summer Olympics.
Just as there are many ways of executing a high jump in competition, so are there different ways of expressing a linear relation. In this lesson you will study a particular method of expressing the equation of a linear relation. You will also learn how to use this type of expression to graph linear relations and identify their characteristics, namely the slope and the y-intercept.
At the end of this lesson, you will have a chance to analyze high jump world records and compare these marks to what you have learned about linear relations and the slope-intercept equation.
Outcomes
At the end of this lesson, you will be able to
-
identify the graph that corresponds to a given slope and y-intercept
-
determine the slope and the y-intercept of a given linear relation from its graph, and write the equation in the form y = mx + b
-
solve a contextual problem that involves intercepts, slope, domain, or range of a linear relation
Lesson Questions
-
How does the equation of a linear function relate to its graph?
-
How are the properties of linear functions applied to studying and solving problems?
 Lesson Completion and Assessment
As you work through each lesson, complete all the questions and learning activities in your binder using paper and pencil, clearly labeling your work (they refer to this as your course folder). These include the Are you Ready, Try This, Share and Self Check questions. Check your work if answers are provided. Remember that these questions provide you with the practice and feedback that you need to successfully complete this course.
Once you have completed all of the learning activities, take the Lesson Quiz. This is the assessment for each lesson and is located under the Activities block on the left in moodle or under the Assess tab.
** Note – Share questions may have to be done on your own depending on your learning situation**
Module 5: Linear Functions
Launch
This section checks to see if you have the prerequisite knowledge and skills to be able to complete this lesson successfully.
Are You Ready?
Complete these questions in your course folder (binder). If you are experiencing difficulty, you may want to use the information and the multimedia in the Refresher section to clarify concepts before completing these exercises.
Once you have completed these exercises to the best of your ability, use the provided answer link to check your work.
Answers
If you feel comfortable with the concepts covered in the questions, move forward to Discover. If you experienced difficulties or want more practice, use the resources in Refresher to review these important concepts before continuing through the lesson or contact your teacher.
** There is a nice solved example you SHOULD look at in the refresher section**
 Refresher
The purpose of this section is to provide you with some resources to review in preparation for the lesson ahead. These resources may include videos, interactive applets, mini-lessons, and flash games to help you recall previously learned concepts. You can use these resources either before or after you try the Are You Ready? questions.Your teacher may also direct you to this section to review specific concepts.
-------------------------------------------------------------------------------------------
Review how to find the Slope of a Line and the intercepts from a graph.

-------------------------------------------------------------------------------------------
Review Module 4: Lesson 5: Example to see how you can graph a line given its slope and a point on the line.
Module 4: Lesson 5: Example
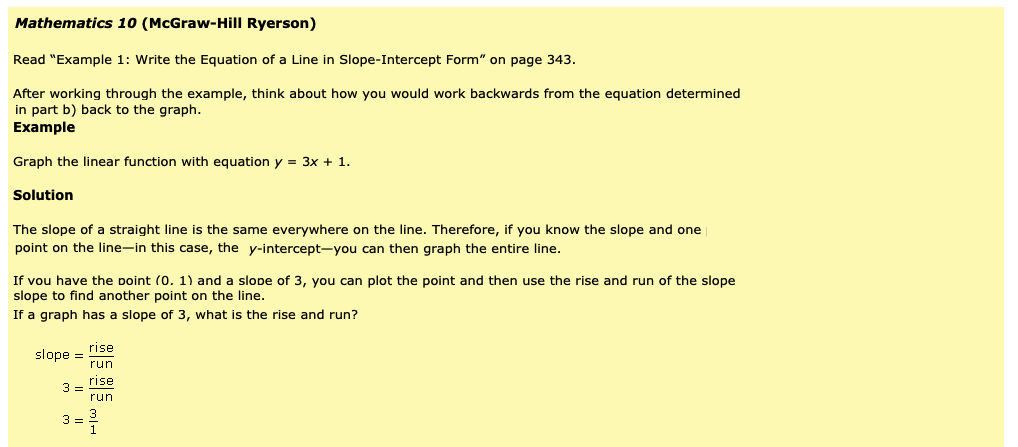
Example
A line passes through the point (−2, −5) and has a slope of 3.
-
Determine two other points on the line.
-
Sketch the line.
Solution
-
To determine the rise and run of a slope of 3, write the slope as a fraction.
Step 1: Determine the rise and run of the slope.
Therefore, the rise is 3 and the run is 1.
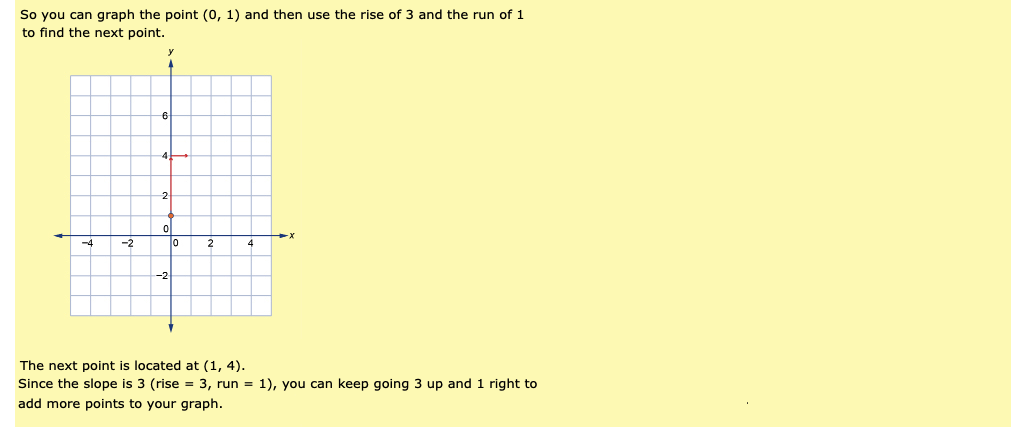
Step 2: Graph the point (−2, −5). Then apply a rise of 3 units up and a run of 1 unit to the right to find another point on the line. The second point will have coordinates (−1, −2).
Since you could also apply a rise of −3 and a run of −1. In other words, you could also move down 3 units and left 1 unit.
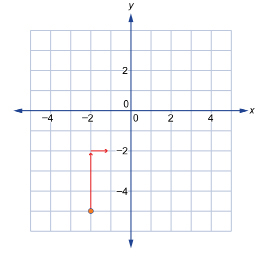
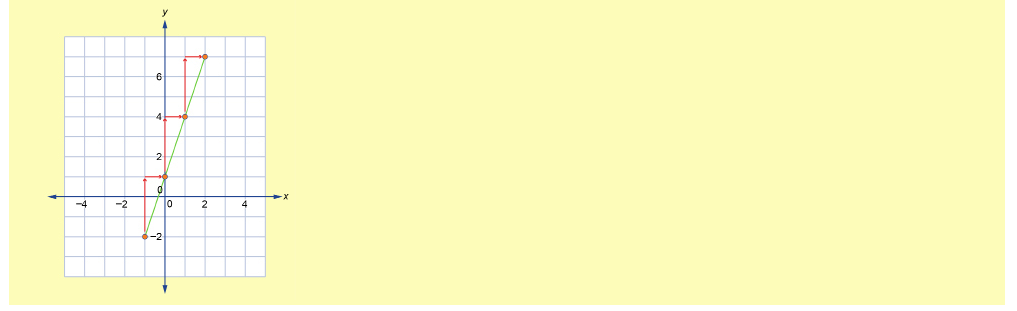
Step 3: Since the slope of a line is constant, you can find additional points by applying the rise and the run to each new point. A third point found in this way is (0, 1).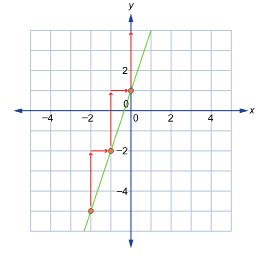
-
Use a straightedge to connect the points on the graph with a line.
----------------------------------------------------------------------------------------------------
Lastly, go to “Formula” to review the definition of formula and how to rearrange formulas. In the Example section, you will see how the width variable in the perimeter formula can be isolated by balancing both sides of the formula. There is also a second example that shows how the radius variable in the circumference formula can be isolated.
------------------------------------------------------------------------------------------------------
If you would like a more thorough review in preparation for this lesson, refer to the Explore sections of the following lessons:
-
Module 4: Lesson 4
-
Module 4: Lesson 5
-
Module 5: Lesson 1
Discover
 Math Lab: Exploring Graphs of Linear Functions
Go Math Lab: Exploring Graphs of Linear Functions, print it and complete it.
Math Lab: Exploring Graphs of Linear Functions
There are several resources you can use to complete this lab:
1. Use the “Linear Function Graph” applet. Click on the picture to launch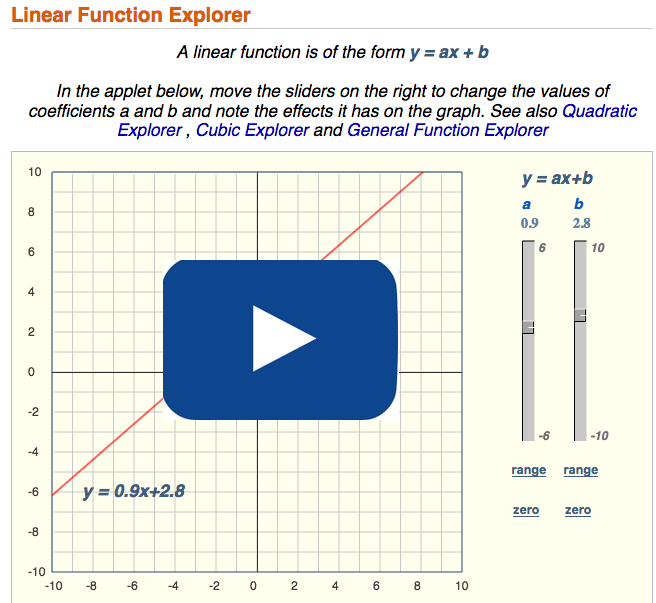
2. Use your graphing calculator to graph the lines.
Once you have completed these questions, use the link below to check your answers. Make any corrections or notes as needed. File this in your binder( course folder).
Mathematics 10C Learn EveryWare © 2010 Alberta Education
Module 5: Linear Functions
Explore

© Steven Pepple/427025/Fotolia
You have seen in previous lessons that there are many ways of representing linear relations. In this lesson you will relate the graph of a linear function to its equation in slope-intercept form. You will also have an opportunity in subsequent lessons to examine other forms of the equation of a linear function.
Glossary Terms
Add the following term to your "Glossary Terms" section in your noted. Include a definition and perhaps add examples that demonstrate the term.
- slope-intercept form
-------------------------------------------------------------------------
You have seen in Math Lab: Exploring Graphs of Linear Functions that the equation of a linear function can be written in the form
y = mx + b, where m represents the slope and b represents the y-intercept.
For example, the linear function with equation y = 2x + 1 has a slope of 2 and crosses the y-axis at (0, 1). Try the following activities to see how you can determine the equation of a linear function given its graph, and sketch the graph of a linear function given its equation.
![]() Try This 1 - 2
Try This 1 - 2
Print (or complete by hand) and complete the following in your binder.
Use the link below to check your answers to Try This 1 - 2.
![]() Read
Read
Read the sections in your textbooks that relate the graph of a linear function to its equation.
Foundations and Pre-calculus Mathematics 10 (Pearson)
First, read “Example 2: Graphing a Linear Function Given Its Equation in Slope-Intercept Form” on page 359. Next, read “Example 3: Writing the Equation of a Linear Function Given Its Graph” on page 360.
Focus on how the slope and y-intercept of a line is extracted from an equation and applied to the graph of the line.
![]() Self-Check
Self-Check
SC 1. Complete Identifying Slope and y-intercept quiz using the link below. (Note - some of the questions are missing some negative signs)
SC 2. For each of the following slopes and y-intercepts, draw the matching graph. Use the grid paper provided here:
Grid paper
-
slope =
 ; y-intercept −1
 -
slope =
 ; y-intercept 3
 -
slope = 0; y-intercept 3
![]() Try This 3
Try This 3
Complete the following questions from your textbook in your course folder ( binder).
Use the provided grid paper if necessary.
Grid paper
Foundations and Pre-calculus Mathematics 10 (Pearson)
TT 3. a. Complete “Exercises” questions 4.b), 4.c), 4.f), 5.a), 5.c), 5.e), 6.c), and 6.d) on page 362.
b. Complete “Exercises” questions 12.a), 12.b), and 12.d) on pages 362 and 363. Note: Only complete parts i) and ii); do not complete part iii).
c. Complete “Exercises” questions 17 and 18 on pages 363 and 364.
Use the link below to check your answers to Try This 3.
Module 5: Linear Functions
Using Linear Functions to Model a ProblemWhen a linear function is used to model a problem in a particular context, there may be some limits to the properties of the function. These limits or restrictions may be placed on such properties as the independent and dependent variables, domain and range, and slope and y-intercepts.
Example
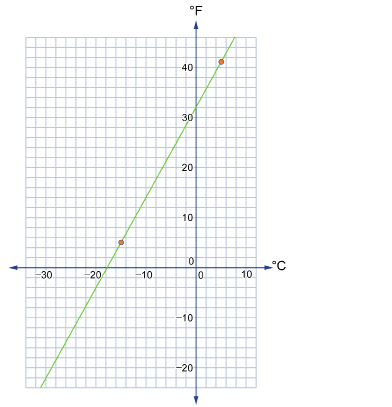
Amarjeet and Kristin are snowboarding at Lake Louise. Kristin moved from the United States, so she is accustomed to temperatures reported in Fahrenheit, but Amarjeet is from Alberta, so he is more familiar with the Celsius scale. They decide to graph the relationship between the two temperature scales based on their day at Lake Louise. In the morning, Amarjeet recorded the lowest temperature reached to be a chilly −15°C. By late afternoon, he recorded the highest temperature to be 5°C. At the same times of the day, Kristin recorded the lowest temperature to be 5°F and the highest temperature to be 41°F.
-
Identify the independent and dependent variables.
-
State the domain and the range of the temperatures experienced this day by the snowboarders.
-
Calculate the slope of the graph. What does this value represent?
-
State the y-intercept of the graph. What does this value represent?
-
State the equation of the graph in slope-intercept form.
Solution
-
The independent variable is Celsius. The dependent variable is Fahrenheit.
-
For this particular day, the domain is
 and the range is
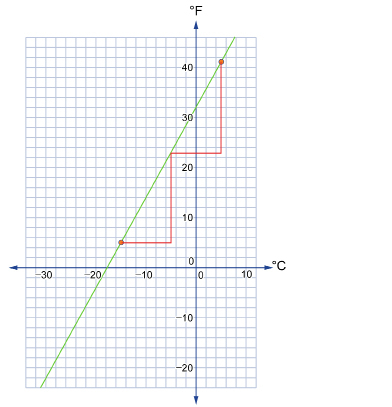
- To determine slope from a graph, you can choose two points and do either of the following:
- Apply the coordinates to the slope formula.
- Count the rise and the run between the points.
The slope is This means that for every 9° change in Fahrenheit, there is a corresponding change of 5° in Celsius.
You can also determine the slope by using the method, as shown in the following graph.
- The y-intercept is (0, 32). This means that 0°C is equal to 32°F.
- The equation of the graph is

Did You Know?
If you travel in the United States in the summer time, you may encounter temperatures approaching 100°F! You can use the following algorithm to obtain an approximation of the temperature in degrees Celsius:
Step 1: Subtract 30 from the Fahrenheit temperature.
Step 2: Divide the result by 2.
To estimate the temperature 100°F, mentally subtract 30°F to get 70°F. Then divide 70°F by 2 to get 35°C. (The actual temperature is 37.8°C.)
This is an algorithm you can perform mentally, and it gives a reasonable approximation!
Linear functions are represented by lines that extend infinitely in both directions. However, when a linear function is used to model a specific situation or context, there are often limitations on how far a line extends. In some cases, it does not make sense for the line to extend into quadrants where there are negative points. In other cases, the points on a line may not have any meaning beyond a certain value.
 Self-Check
In the following Self-Check, you will work with graphs of linear functions that are both unrestricted and restricted. Unrestricted graphs are those that extend infinitely. They are not associated with a particular context. Restricted graphs, on the other hand, are limited by the conditions of the situation.
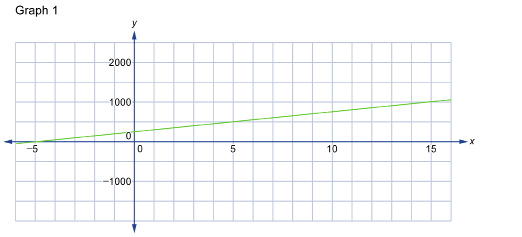
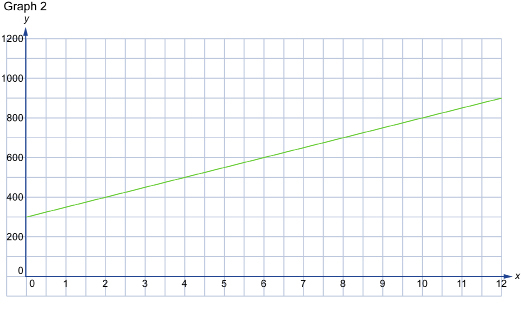
SC 3. Complete the table in Restricted Graph and Unrestricted Graph based on the graphs that follow. You need the following information to complete the table.
-
Graph 1 is an unrestricted graph.
-
Graph 2 is a restricted graph based on the following situation: the monthly cost, over a 12-month period, of owning and using a cellphone if the phone costs $300 to purchase and the basic plan is $50 per month (assuming a person stays within the plan and doesn’t add on extra charges).
SC 4. You have decided to help out with some school fundraising for an upcoming trip to California. You decided to bake some healthy granola bars to sell, and you want to make at least $5 for every $1 you spend on supplies.
-
You have $25 dollars that you can spend on supplies. Create a table of values showing your expenses and your minimum profit for the first $25 you spend. (You can count up by $5 purchases.)
-
Determine the dependent and the independent variables.
-
Graph your data.
-
Determine the y-intercept.
-
What does the y-intercept represent?
-
Calculate the slope.
-
What does the slope represent?
-
Determine the domain and the range for your graph.
 Try This 4
Complete the following questions from your textbook in your course folder ( binder).
Foundations and Pre-calculus Mathematics 10 (Pearson)
TT4: Complete “Exercises” question 13 on page 363.
Use the link below to check your answers to Try This 4.
Module 5: Linear Functions
Connect
![]() Lesson Assessment
Lesson Assessment
Complete the lesson quiz posted under the Quizzes link to the left in moodle or under the Assess tab and ensure your work in your binder (course folder) is complete.
 Project Connection ** NOT ASSIGNED**

iStockphoto/ Thinkstock
Bungee jumping is an activity where a person jumps from a bridge, a crane, or some other elevated point attached by only a bungee cord. While bungee jumping is not an Olympic sport, there are bungee jumping competitions that award points in the same manner as platform diving.
In this Project Connection and the Project Connection in Lesson 4, you will carry out a procedure that can be modelled by a linear function. You will determine the equation of the line based on experimental data. You will then use that data to make predictions.
Go to the Unit 3 Project and complete Math Lab: Bungee Jump Simulation.
 Going Beyond

© Gina Sanders/5170620/Fotolia
Unfortunately, the amount of garbage on Earth is growing. It’s likely that you and your family are aware of the importance of recycling; everyone needs to play a role in reducing waste.
The planet has a limited number of resources and limited space for garbage. Think about these limitations as you would think about restrictions on the domain and the range of a graph.
1. Conduct an Internet search and find information about a landfill near you.
a. What is the size of the landfill?
b. How much garbage is received at the landfill each day?
c. When will that landfill reach capacity?
2. Graph your data.
3. Calculate the slope and y-intercept.
4. If the rate remains constant, how long will it be until the landfill is completely full?
5. What if the slope of your graph doubles?
6. What if the slope could be reduced by half? How does the changing slope affect the domain and range on your graph?
7. What do all of these values mean in your specific situation?
Module 5: Linear Functions
Lesson 3 Summary
In this lesson you investigated these following questions:
-
How does the equation of a linear function relate to its graph?
-
How are the properties of linear functions applied to studying and solving problems?
In this lesson you learned that a line can be represented by the equation y = mx + b. This is called slope-intercept form. You discovered that the slope of the graph is given by the value of m in the equation and the y-intercept is given by the value of b in the equation.
You can graph a linear function easily when it is presented as an equation in slope-intercept form. You do this first by identifying and plotting the y-intercept, b. Then you can apply the slope, m, to the y-intercept in order to find a second point. By connecting the two points, you will have a line that corresponds with the given slope and y-intercept.
In this lesson you also practiced solving contextual problems involving slope, y-intercept, domain, and range. When placed in the context of a real-world problem, the properties of linear functions have meaning. The y-intercept of a distance-time graph may refer to the distance that an athlete has to run in a triathlon while the x-intercept may refer to the time that it takes to run that distance.
In previous lessons you learned that the domain and the range of diagonal lines are elements of the real numbers. The domain and the range of a linear relation in a real-world setting, however, may have to be restricted to those points which are meaningful. Negative values and very large numbers are often unrealistic or not meaningful in the context of everyday situations. When using linear functions to model problems, it is not enough to complete the math correctly but it is also important to assess whether the results make sense in the context that the results are being used in.
In subsequent lessons you will learn how to represent linear functions with equations of other forms. You will learn the type of information that each equation gives and you will study how to use these equations to graph linear functions.