Module 3 Project
| Site: | MoodleHUB.ca 🍁 |
| Course: | Math 20-3 SS |
| Book: | Module 3 Project |
| Printed by: | Guest user |
| Date: | Tuesday, 2 December 2025, 7:05 AM |
Description
Created by IMSreader
1. Module 3 Project
Module 3: Slope and Rate of Change
Module 3 Project: Luge Track Comparison
(78 marks)
Introduction
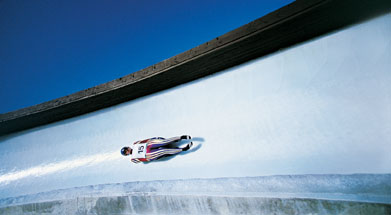
Digital Vision/Thinkstock
Luge is a winter sledding sport that was invented in Switzerland. The term luge refers to both the sport and the sled used to slide down icy tracks with plenty of curves. The riders, or sliders, lie on their backs on the sled, and use their feet and shoulders to control their movements as they go feet-first down the course.
In World Cup and Olympic competitions, there are single riders in both women’s and men’s events. Two-person luge events also take place.
All tracks in the world are designed and constructed differently. When designing a track, the primary goals are competitor safety and maximum performance. Mathematics, physics, and engineering concepts are all considered in the design.
Many factors contribute to the speed at which a luge athlete travels: sled aerodynamics, sled blades, clothing, boots and gloves, ice and atmosphere temperatures, athlete weight, and the track’s slope. The Whistler Sliding Centre track is considered to be the fastest in the world, but it’s also the newest course and has the most up-to-date technology. During the 2010 Olympic Winter Games, the lugers reached speeds up to 150 km/h.
Calgary was also host to the Winter Olympics in 1988. The Calgary luge venue was Canada Olympic Park.
Project Goal
In this project you will investigate why the luge track at the Whistler Sliding Centre is considered faster than the one at Canada Olympic Park in Calgary. The project will lead you through six steps to help you gather data and perform calculations in order to compare the two tracks. Although many factors contribute to track speed, you will focus on analyzing only the slope.
Timeline
This project is to be completed in small steps during each lesson of Module 3.
![]() As you complete each step, save your work to your course folder. Submit the entire project at the end of Module 3.
As you complete each step, save your work to your course folder. Submit the entire project at the end of Module 3.
Step 1
At both Whistler Sliding Centre and Canada Olympic Park, there are three sports for athletes to take part in—bobsleigh, skeleton, and luge. For each sport there are different starting points along the track. The following charts provide information about each track.
| WHISTLER SLIDING CENTRE | |
Track Statistics |
|
Length (bobsleigh and skeleton) |
1450 m |
Length (men’s luge) |
1374 m |
Length (doubles and women’s luge) |
1198 m |
Vertical Drop |
152 m |
Number of Corners |
16 |
| CANADA OLYMPIC PARK | |
Track Statistics |
|
Length (bobsleigh and skeleton) |
1475 m |
Length (men’s luge) |
1251 m |
Length (doubles and women’s luge) |
1081 m |
Vertical Drop |
104.2 m |
Number of Corners |
14 |
- Slope indicates how fast one quantity changes when compared with another quantity. Using the information about the two tracks provided in the charts, describe in your own words what slope means to the sport of luge. (2 marks)
- All artificial luge tracks have a slope restriction for safety reasons. The average slope must be between 8% and 11%.
For 8%, the track cannot exceed an 8-m vertical drop for every 100 m of length.
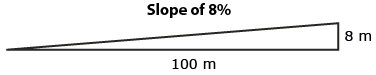
For 11%, the track cannot exceed an 11-m vertical drop for every 100 m of length.
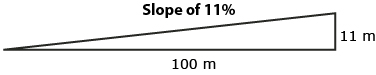
Why do you think the track’s slope cannot exceed a slope of 11%? (2 marks)
1.1. Page 2
Module 3: Slope and Rate of Change
Step 2
Look at the following diagram to see what the Whistler track is like.
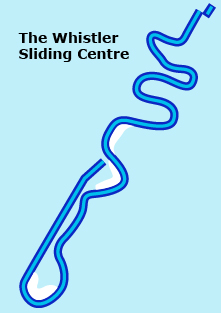
Watch the “Track Calgary” video to take a virtual ride on the track at Canada Olympic Park.

Winter Olympic Games Organizing Committee Official Report,
(Calgary: Calgary Olympic Development Committee, 1988),
p. 119. Reproduced with permission.
- Use the information from the following charts to calculate the mean slopes of the men’s luge tracks at Whistler and Calgary. Do they fall within the safety guidelines of an average slope of 8% to 11%? (The starting point of the 2010 Olympic men’s luge event at Whistler was moved down the hill before the Olympics for safety reasons.) (4 marks)
WHISTLER SLIDING CENTRE Track Statistics
Length (bobsleigh and skeleton)
1450 m Length (men’s luge)
1374 m Length (doubles and women’s luge)
1198 m Vertical Drop
152 m Number of Corners
16 CANADA OLYMPIC PARK Track Statistics
Length (bobsleigh and skeleton)
1475 m Length (men’s luge)
1251 m Length (doubles and women’s luge)
1081 m Vertical Drop
104.2 m Number of Corners
14
Use the profile animation Whistler’s Slope to answer questions 2 to 4.

- Turn 2 at Whistler’s luge track, called Fallaway, is the steepest part of the run. Calculate the slope through Fallaway. (3 marks)
- Do any sections have a zero slope? Explain. (2 marks)
- Do any sections have a slope that does not exist? Explain. (2 marks)
Use the profile animation Calgary’s Slope to answer questions 5 to 7.

- Where on the Calgary’s track is the steepest section? Calculate the slope. (4 marks)
- Do any sections have a zero slope? Explain. (2 marks)
- Do any sections have a slope that does not exist? Explain. (2 marks)
1.2. Page 3
Module 3: Slope and Rate of Change
Step 3
To ensure the safety of lugers, the International Luge Association has set specific guidelines for track design and construction. There are a few requirements, but you will focus on the ones specifically regarding slope.
Track Regulation from the International Luge Federation |
The track gradient should be designed in such a way that a speed of about 80 km/h is reached approximately 250 m after the start. The average gradient of a track from the men’s start to the low point should not exceed 10%. The average gradient of the second half of the track should not exceed 8%. The calculated maximum speed must not exceed 135 km/h.
The gradient of the outrun must not exceed 20% and must give athletes the possibility for an exit along one side. |
- Use the slope calculations and other information from Step 2 to calculate the gradients for each section of the two tracks. (12 marks)
Track
Gradient of Top
Half of Course
Gradient of Bottom
Half of Course
Canada Olympic Park
Whistler Sliding Centre
- Examine the chart and discuss how safe each track is in terms of slope. Does each track meet the International Luge Association standard regulations? (2 marks)
Step 4
Luge at the Vancouver Olympics in 2010 had several different competitions. There were individual and doubles competitions. Individuals made four runs down the track with the lowest total time winning. Doubles made two runs down the track and, again, the lowest total time won.
- Use the women’s luge course length (3914 ft) and the information in the table to answer the questions that follow.
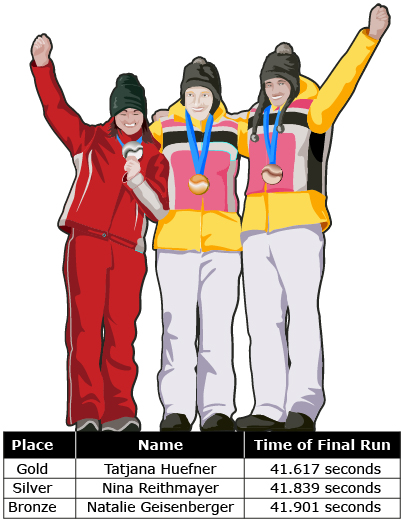
- Find the fastest time in the final round for women medal winners and determine the speed in feet per second. Round your answer to the nearest thousandth of a foot per second. (3 marks)
- Find the slowest time in the final round for women medal winners and determine the speed in feet per minute. Round your answer to the nearest foot per minute. (3 marks)
- Find the fastest time in the final round for women medal winners and determine the speed in feet per second. Round your answer to the nearest thousandth of a foot per second. (3 marks)
- Use the men’s doubles luge course length (3914 ft) and the information in the table to answer the questions that follow.
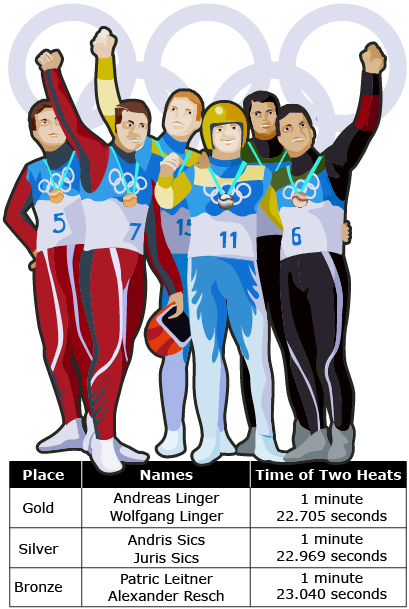
- i. Find the average time for one run for the Lingers.
ii. Calculate their average speed in feet per second. Round your answer to the nearest thousandth of a foot per second. (4 marks)
- i. Find the average time for one run for the silver-medal-winning Sics.
ii. Calculate their average speed in feet per minute. Round your answer to the nearest foot per minute. (4 marks)
- i. Find the average time for one run for the Lingers.
- How do the fastest single and double times compare? What reasons can you suggest for this difference in speed? (4 marks)
1.3. Page 4
Module 3: Slope and Rate of Change
Step 5
At the Winter Olympics in 1988, the winning men’s doubles luge team was Joerg Hoffmann and Jochen Pietzsch. They finished their two heats in a total time of 1:31.940.
The first-place time at Vancouver was given as 1:22.705. Andris Sics and Juris Sics placed second in Vancouver and had a time of 1:22.969.
- Assume that the times from the Calgary Olympics and the Vancouver Olympics are proportional. What would be the time of the Calgary Olympics second-place finishers? You should use proportional reasoning to solve this problem. Round your answer to thousandths of a second. (5 marks)
- Search the Internet for the second-place time in Calgary. Was the assumption valid that the times were proportional? (3 marks)
Step 6
While working on the Module 3 Project in Lesson 2 of Section 1, you found the slope of different parts of the Whistler track and the Calgary track. You can use the Whistler's Slope and Calgary's Slope animations to discover other things about the track.


- How many metres does the Whistler track fall over the first 900 ft? (3 marks)
- How many metres is 900 ft? (2 marks)
- How many metres does the luge track at Canada Olympic Park in Calgary fall in the first 900 ft? (3 marks)
- How does the slope of the first 900 feet of the two tracks compare? (3 marks)
Summary
In a short paragraph, summarize why the Whistler track is faster than the Canada Olympic Park track. Base your summary on the data and calculations performed throughout the project’s six steps. (3 marks)