Lesson 2
| Site: | MoodleHUB.ca 🍁 |
| Course: | Math 30-3 SS |
| Book: | Lesson 2 |
| Printed by: | Guest user |
| Date: | Sunday, 2 November 2025, 4:09 AM |
Description
Created by IMSreader
1. Lesson 2
Module 1: Probability
Lesson 2: Theoretical Probability
Focus
Photodisc/Thinkstock
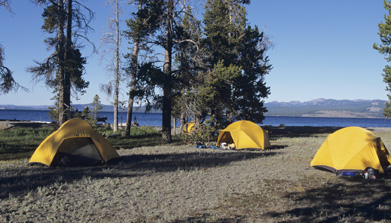
When planning a summertime camping trip, people check the weather forecast for the possibility of favourable conditions. In Alberta a common saying is, “If you don’t like the weather, just wait a minute.” This saying indicates that the weather in Alberta can be unsettled at times.
A weather forecast tries to predict the likely outcome of the weather, but sometimes it may be wrong. Why might this be?
Lesson Outcomes
At the end of this lesson you will be able to
- determine the theoretical probability of an event
- distinguish between experimental and theoretical probability
Lesson Questions
In this lesson you will investigate the following questions:
- How does theoretical probability differ from experimental probability?
- What is the theoretical probability of an event?
Assessment
Your assessment may be based on a combination of the following tasks:
- completion of the Lesson 2 Assignment (Download the Lesson 2 Assignment and save it in your course folder now.)
- course folder submissions from Try This and Share activities
- additions to Glossary Terms
- work under Project Connection
Materials and Equipment
You will need
- calculator
- two standard six-sided dice (virtual dice are also available in the lesson)
- assortment of coins
- deck of cards
1.1. Discover
Module 1: Probability
Discover
Creatas/Thinkstock
In Lesson 1 of this module you experimented with experimental probability by rolling a six-sided standard die multiple times and recording the results. The experimental probability was determined based on the results of the experiment.
For example, if you rolled a four 10 times in 36 rolls of the die, then your experimental probability would have been ![]() Expressed as a percent, the probability of rolling a four in your experiment was approximately 27.8%. Does this sound reasonable? Would you use your experimental results to help you make a good decision? That is, if you were asked to predict the outcome of the next roll of the die, could you confidently say that it would be a four?
Expressed as a percent, the probability of rolling a four in your experiment was approximately 27.8%. Does this sound reasonable? Would you use your experimental results to help you make a good decision? That is, if you were asked to predict the outcome of the next roll of the die, could you confidently say that it would be a four?
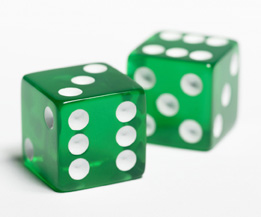
Now dive deeper and continue to explore your predicting abilities. This time it will involve calculating the absolute difference when you roll two dice!
Try This 1

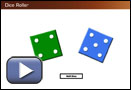
Open Dice Roller and use it to complete the experiment and answer the following questions.
In this experiment you will be rolling two dice and recording the difference in their outcomes (you will always subtract the smaller value from the larger value).
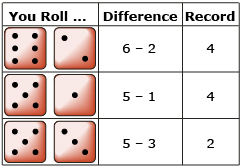
- Prior to rolling the dice, list the set of possible outcomes for the experiment. Keep in mind that your possible outcomes are based on the difference between the values on the two dice.
- Next, make predictions to the following questions.
- Will some of the outcomes occur more frequently than others?
- Which outcome(s) do you expect will occur most often?
- Which outcome(s) do you expect will occur least often?
- Roll the dice a total of 36 times. Using the difference between the value on the two dice as the outcome, record the tally and frequency in a table similar to the one shown.
Outcome
Tally
Frequency
Experimental
Probability0
1
2
3
4
5
Total
36
36
- Next, determine the experimental probability for each outcome. Record the results in the last column of your table.

-
Based on the results of your experiment, answer the following questions.
- Were your predictions of the least and the most expected outcomes correct?
- How confident are you that your experimental probability results are very close to those of other students or groups performing the same experiment?
- If you were to perform this experiment with 10 times the number of dice rolls, how might this change the experimental probability? If you had 100 times the number of dice rolls, would the experimental probability change? Explain.
Share 1
With a partner or in a group, discuss the results of your experiment and your responses to the questions in Try This 1. Compare your findings. Explain why there may be similarities and differences.
![]() Save a summary of your discussion in your course folder.
Save a summary of your discussion in your course folder.
1.2. Discover 2
Module 1: Probability
In Try This 1 you listed all possible outcomes of the experiment. Listing all the possibilities is also known as determining the sample space.
Try This 2
- Copy and complete the following sample space table to show all possible differences when rolling two dice. The first row and column of outcomes have been completed for you.
|Difference|
Outcome of Die 1
1
2
3
4
5
6
Outcome
of
Die 2
1
0
1
2
3
4
5
2
1
3
2
4
3
5
4
6
5
- What is the total number of outcomes in the sample space table?
- Using the sample space table, predict the probability of rolling a difference of 0, 1, 2, 3, 4, and 5.

- Copy and summarize your findings in a table like the following. The frequency table probabilities are from Try This 1, and the sample space table probability is from Try This 2 question 1.
Outcome
Frequency Table Probability
(from Try This 1)Sample Space Table Probability
(from Try This 2 question 1)0
1
2
3
4
5
- Explain how the frequency table and the sample space table are similar.
- Explain how the frequency table and the sample space table are different.
- Do either of these methods of representation—frequency table or sample space table—better represent the probability of rolling a particular difference? Explain.
![]() Save your work in your course folder.
Save your work in your course folder.
Compare the number of favourable outcomes to the total number of outcomes.
1.3. Explore
Module 1: Probability
Explore
theoretical probability: the ratio of one or more events of interest to the total number of possible outcomes
Source: MathWorks 12 Student Book/Teacher Guide. (Vancouver: Pacific Educational Press, 2011.)
In Discover you constructed a sample space table of all possible outcomes. This table can be used to determine the theoretical probability of the different outcomes.
Theoretical probability is determined by calculating the number of favourable outcomes and the total number of possible outcomes, whereas experimental probability is determined by performing an experiment, as you did in Lesson 1 of this module.
The formula for calculating theoretical probability is the same as experimental probability.
![]()
Source: MathWorks 12 Student Book/Teacher Guide. (Vancouver:Pacific Educational Press, 2011.)
|
Experimental Probability |
Theoretical Probability |
Definition |
the ratio of the number of occurrences of a particular event during an experiment or trial to the total number of trials conducted |
the ratio of one or more events of interest to the total number of possible outcomes |
Formula |
|
|
For example, when flipping a single coin, the result will be either heads or tails. There are only two possible outcomes.
The theoretical probability of flipping a head is ![]()
In Try This 3 you will further explore how theoretical probability and experimental probability compare.
Try This 3
Predict how many heads will appear when 16 coins are flipped. Does your prediction change if there are 32, 48, or 64 coins flipped? Test your prediction with an experiment.
Open Coin Flipper and click on 16 for the number of coins. Then select “Flip Coins.” Note that this experiment can also be completed using a real coin by simply flipping it 16 times, and recording the results. You can also flip 16 coins at once.

coin images: Royal Canadian Mint. All Rights Reserved.
Predict the number of heads you expect for each of the next four trials of 16 coins, and record your predictions in a table similar to the one that follows.
|
Cumulative Number |
Predicted |
Actual |
1st set of 16 coins |
|
|
|
2nd set of 16 coins |
|
|
|
3rd set of 16 coins |
|
|
|
4th set of 16 coins |
|
|
|
5th set of 16 coins |
|
|
|
Total |
|
|
|
Flip the coins four more times, for a total of five 16-coin trials.
Record in the table the total number of heads that appear.
![]() Save your responses in your course folder.
Save your responses in your course folder.
Share 2
With a partner or in a group, discuss your findings from Try This 3. Then use your results to answer the following questions.
- Combine your results. Determine the total number of flips of the coin. Determine the total number of heads that appeared. What is the experimental probability of flipping a head based on the combined data?
- Calculate the theoretical probability of flipping a head. Are the two probabilities close?
- How do you think these numbers would compare if you flipped 10 times as many coins?
If you wish, find more people to add to your group and combine the results. Are your findings closer to the theoretical probability?
![]() Save your responses in your course folder.
Save your responses in your course folder.
1.4. Explore 2
Module 1: Probability
In Try This 3 you may have noticed that the theoretical and experimental probabilities were similar. Also, the experimental probability came closer to the theoretical probability as you did more trials. In the next activity you will determine some theoretical probabilities for events more complex than flipping coins.
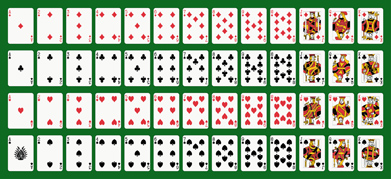
Let’s experiment with a deck of cards.
Try This 4
© Mannaggia/23299310/Fotolia
A standard deck of playing cards consists of 52 cards labelled as follows:
- Four suits include spades, hearts, diamonds, and clubs.
- Two suits are red: hearts and diamonds.
- Two suits are black: spades and clubs.
- In each suit there are 13 members: ace, 2, 3, 4, 5, 6, 7, 8, 9, 10, jack, queen, and king.
- Jacks, queens, and kings are called face cards.
If you were to randomly draw a card from a shuffled deck, find the probability for each of the following questions.
- What is the probability that the card would be a 2 of hearts?
- What is the probability that the card would be a spade?
- What is the probability that the card would be a face card?
- What is the probability that the card would be a black 9?
- Suppose you drew a card and looked at it. You then returned the card to the deck, shuffled the deck, and repeated the process until you had looked at 20 cards. How many times would you expect to see the following?
- a red card
- a face card
- a 7 of clubs
![]() Save your responses in your course folder.
Save your responses in your course folder.
1.5. Explore 3
Module 1: Probability
Self-Check 1
![]()
- Turn to page 157 of the textbook and complete the questions for “Example 1.” Check your answer with the solution provided on page 158.
- Answer “Build Your Skills” questions 1, 2, 3, 5, and 6 on pages 162 and 163 of the textbook. Answer
So far you have looked at experiments where the number of objects to pick from was always the same. In some scenarios the number of objects to pick from changes. For example, if you are passing around a box of chocolates, the number left to choose from changes as people pick their favourites. Complete the next activity to explore this idea.
Try This 5

Photodisc/Thinkstock
An electrician’s tool belt holds a variety of tools, including 3 different sizes of Robertson screwdrivers, 5 different sizes of flat head screwdrivers, and 4 different sizes of Phillips screwdrivers. The electrician randomly takes one of the screwdrivers out to use.
- What is the probability that the screwdriver is a Phillips screwdriver?
- Assuming the screwdriver in question a. was a Phillips and was not replaced, what is the probability that the next screwdriver chosen is a Robertson?
- Assuming that a Phillips and a Robertson have been taken out of the belt and not replaced, what is the probability that the next screwdriver chosen is a flat head?
![]() Save your responses in your course folder.
Save your responses in your course folder.
1.6. Explore 4
Module 1: Probability
After completing Try This 5, you should have noticed that when an item or object is not replaced after being picked, the sample space or total number of possible outcomes will change. Check your knowledge of this in Self-Check 2.
Self-Check 2
![]()
- Turn to page 159 of the textbook and complete “Example 2.” Check your answer with the solution provided on page 159.
- Answer “Build Your Skills” question 7 on page 164. Answer
When determining a theoretical probability using ![]() all of the outcomes need to be equally likely. The next two activities illustrate this.
all of the outcomes need to be equally likely. The next two activities illustrate this.
Math Lab
Turn to page 161 of the textbook and read “Activity 4.2: Populate A Video Game Planet.”
- Complete question 1. If you don’t have a die to roll, you can use one of the die in the Dice Roller.
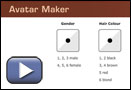
- If you have 15 or more people to work with, complete questions 2 and 3. If you do not have 15 people to work with, use Avatar Maker to create information for 30 avatars, and use this information to complete questions 2 and 3 of the textbook.
![]() Save your responses in your course folder.
Save your responses in your course folder.
1.7. Explore 5
Module 1: Probability

Photodisc/Thinkstock
Self-Check 3
You have been offered the opportunity to complete an online customer satisfaction survey for Home Renos Supply Depot. All survey entries receive a prize. After submitting your comments, you are entered into a draw to determine your prize. The grand prize is an all-inclusive one-week paid trip to Hawaii. Ten thousand (10 000) surveys are entered into the draw, and the prizes are distributed as follows:
Prize |
Number of Prizes of This Type |
5% off your next purchase |
7922 |
10% off your next purchase over $250 |
1577 |
30% off your next purchase over $500 |
500 |
All-inclusive one-week paid trip for two to Hawaii |
1 |
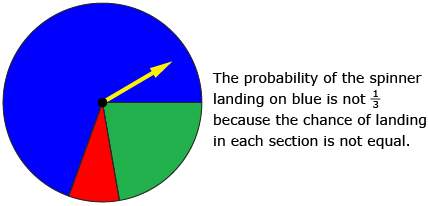
Elia and Erryn have filled in satisfaction surveys and are discussing the probability of winning the grand prize. Elia says she thinks she has a 1 in 4 chance of going to Hawaii because there are four prizes available and she will win one of them. Erryn says that sounds too good to be true.
- Which girl do you agree with? Explain. Answer
- What is the formula for the probability of winning a certain prize? Answer
- What is the probability of winning a prize of 30% off your next purchase over $500? Answer
- What is the probability of winning a prize other than 5% off your next purchase? Answer
- If you checked the prizes of 500 people, how many do you expect received the 5% discount? Answer
In Self-Check 3 you may have noticed that, in fact, there is not a 1 in 4 chance of winning the trip to Hawaii. Why? Because the four options do not have equal probabilities.
The probability of the individual events must be equal to use the formula ![]()
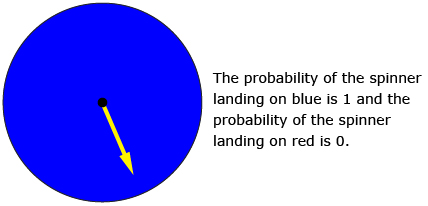
You also saw that the probability of an event that must happen is 1, and the probability of an event that cannot happen is 0.
The diagrams illustrate these ideas.
Self-Check 4
You have a bag with 9 red marbles, 6 blue marbles, and 5 green marbles. A marble is selected and then put back in the bag. Answer each of the following questions as a fraction in lowest terms, as a decimal, and as a percentage. What is the probability of randomly selecting the following colours of marbles?
- a green marble Answer
- a red or blue marble Answer
- a black marble Answer
- a non-green marble Answer
- a pink marble Answer
- Explain why the probability of selecting a red marble is not
 Answer
Self-Check 5
Add theoretical probability to your copy of Glossary Terms.
1.8. Connect
Module 1: Probability
Complete the Lesson 2 Assignment that you saved in your course folder at the beginning of the lesson. Show work to support your answers.
![]() Save your responses in your course folder.
Save your responses in your course folder.
Project Connection
You are now ready to apply your understanding of theoretical probability to Module 1 Project: Applying Probability in a Business. Go to the Module 1 Project, and use the research gathered from Step A to complete Step B. You may need to do further research to gather data to answer all the questions effectively. Next, read and be aware of the Project Checklist as you continue your project in the next two lessons.
![]() Save your responses in your course folder.
Save your responses in your course folder.
1.9. Lesson 2 Summary
Module 1: Probability
Lesson 2 Summary
In this lesson you looked at theoretical probability and how it relates to experimental probability, as seen in Discover when you used the absolute value of the difference of rolling two dice.
Theoretical probability explains what should happen in an experiment, and experimental probability explains what actually happened when the experiment was performed.
You also learned that as the number of trials in an experiment increases, the experimental probability approaches the same value as the theoretical probability.
The formula for experimental and theoretical probability is the same.
![]()
In Lesson 3 you will begin to explore odds. Odds provide an alternate way to express the chance of something occurring.