Lesson 4
| Site: | MoodleHUB.ca 🍁 |
| Course: | Math 30-3 SS |
| Book: | Lesson 4 |
| Printed by: | Guest user |
| Date: | Sunday, 2 November 2025, 12:11 PM |
Description
Created by IMSreader
1. Lesson 4
Module 5: Geometry
Lesson 4: Single Transformations
Focus
iStockphoto/Thinkstock
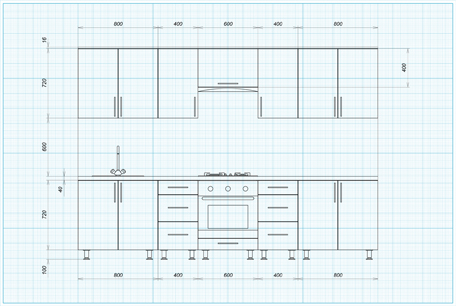
When you decide to build something, typically you begin by drawing a set of plans to follow as you work. Sometimes a plan will include shapes that are repeated or closely related to one another. When this occurs, it can be useful to use transformations (the movement of a shape by sliding, flipping, rotating, or changing its size) to help you produce an accurate set of plans.
Lesson Outcomes
At the end of this lesson you will be able to
- draw an object after a transformation has been applied
- determine the transformation used on an object, given the original and an image
Lesson Question
You will investigate the following question:
- How can transformations be used to help plan a project?
Assessment
Your assessment may be based on a combination of the following tasks:
- completion of the Lesson 4 Assignment (Download the Lesson 4 Assignment and save it in your course folder now.)
- course folder submissions from Try This and Share activities
- additions to Glossary Terms
Materials and Equipment
- graph paper
1.1. Launch
Module 5: Geometry
Launch
Do you have the background knowledge and skills you need to complete this lesson successfully? Launch will help you find out.
Before beginning this lesson you should be able to
- plot points on a coordinate plane
- calculate equivalent ratios
- calculate proportions
- insert values into simple formulas
1.2. Are You Ready?
Module 5: Geometry
Are You Ready?
Complete these questions. If you experience difficulty and need help, visit Refresher or contact your teacher.
- Solve for x.
- Solve for x.
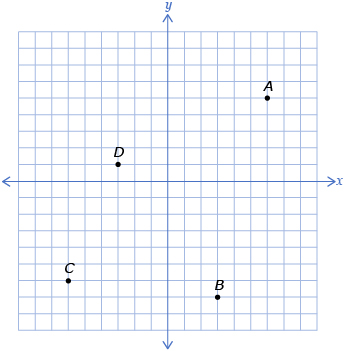
- Write down the coordinates of the points shown on the grid.
If you answered the Are You Ready? questions without difficulty, move to Discover.
If you found the Are You Ready? questions difficult, complete Refresher.
1.3. Refresher
Module 5: Geometry
Refresher
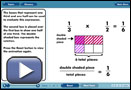
To review multiplying and dividing fractions, complete Fractions—Multiply and Divide (Home), listed under the Number column at the link provided.

Screenshot reprinted with permission of ExploreLearning
Work through “City Tour (Coordinates)” to review coordinates.
Go back to the Are You Ready? section and try the questions again. If you are still having difficulty, contact your teacher.
1.4. Discover
Module 5: Geometry
Discover
Try This 1
Open Transformations to explore the different types of transformations.
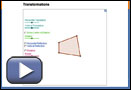
As you are exploring, complete a table like the one shown and answer the questions that follow.
Type of Transformation |
How the Polygon Changes |
Diagram of the Change |
horizontal translation |
The polygon moves left or right. |
|
vertical translation |
|
|
dilation |
|
|
horizontal reflection |
|
|
vertical reflection |
|
|
rotation |
|
|
- Which transformation(s) changed the size of the polygon?
- Which transformation(s) changed the orientation of the polygon?
- Which transformation(s) changed the position of the polygon?
- Describe how the dilation of an object is related to the centre of dilation.
- Describe how the rotation of an object is related to the centre of rotation.
![]() Save your responses in your course folder.
Save your responses in your course folder.
1.5. Explore
Module 5: Geometry
Explore
transformation is the movement of a shape or object by sliding, flipping, rotating, or changing its size
A translation is the horizontal and/or vertical movement of an object.
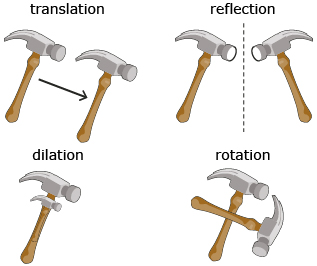
A transformation is the movement of a shape or object by sliding, flipping, rotating, or changing its size. In Try This 1, you were introduced to four types of transformations:
- translations
- reflections
- dilations
- rotations
In this lesson, you will explore these types of transformations one at a time.
A translation is the horizontal and/or vertical movement of an object. Translations are useful when you would like to reproduce the same shape but in a different location. The next activity will explore a rule that can be used for translations.
Try This 2
Suppose you are building a beanbag game where the object of the game is to throw a beanbag through a hole. You have drawn a quadrilateral as the shape of the hole you would like to use, but now you need to draw this quadrilateral in three other locations. You would like the centre of each quadrilateral to be a specified distance apart, as shown in the diagram.
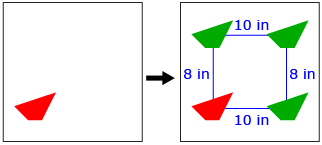
- Describe a strategy that can be used to draw the three remaining quadrilaterals.
- How accurate do you feel your strategy will be? Can you think of a more accurate strategy?
There are many reasonable ways to draw the remaining quadrilaterals. One possibility is to use a coordinate grid. The grid can be used to count the distances.
- Make a grid with a quadrilateral like the one shown here. Use your grid to draw the three remaining shapes.

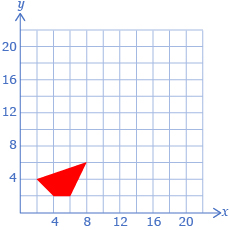
- For each quadrilateral, label the vertices with their coordinates.
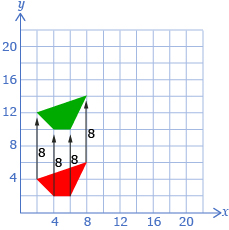
- Describe how the coordinates of the original quadrilateral are related to those of the new quadrilaterals. The following table may help organize your thinking.
Quadrilateral
How the Coordinates Are Related to Those of the Original
8 units up from the original
10 units right from the original
8 units up and 10 units right from the original
- What happens to the coordinates of the original quadrilateral when the quadrilateral is moved as follows?
- right 18
- down 6
- left 8
- down 10 and left 12
![]() Save your responses in your course folder.
Save your responses in your course folder.
Share 1
With a partner or in a group, discuss the following questions.
- Compare the strategies you used to move the quadrilaterals in the coordinate grid. Explain which strategy you feel is more accurate.
- Describe an advantage of using just coordinates instead of drawings to describe the translation of an object.
![]() If required, place a summary of your discussion in your course folder.
If required, place a summary of your discussion in your course folder.
Count from each vertex or “corner” of the quadrilateral separately.
1.6. Explore 2
Module 5: Geometry
In Try This 2, you may have noticed that a coordinate grid can be useful when describing a translation. In fact, a coordinate grid will prove useful for all of the transformations discussed in this module.
Watch Translation Explanation to see how a formula can be used to describe what translations are applied to an object.
To move an object left or right, you can decrease or increase the x-values of the point’s coordinates. For example, suppose the point (1, 2) is a vertex of an object. To move the vertex left or right, you change the x-value, which, in this case, is 1.
Movement from (1 , 2) |
Change in Coordinates |
New Coordinates |
left 3 |
(1 − 3, 2) |
(−2, 2) |
left 2 |
(1 − 2, 2) |
(−1, 2) |
left 1 |
(1 − 1, 2) |
(0, 2) |
not moved |
(1, 2) |
(1, 2) |
right 1 |
(1 + 1, 2) |
(2, 2) |
right 2 |
(1 + 2, 2) |
(3, 2) |
right 3 |
(1 + 3, 2) |
(4, 2) |
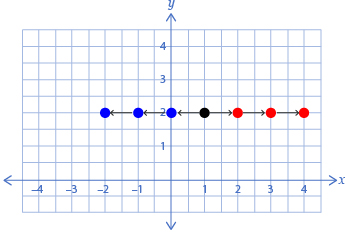
Similarly, to move an object up or down you can increase or decrease the y-value of its coordinates.
Self-Check 1
- Complete the Translation Mapping matching activity.

![]()
1.7. Explore 3
Module 5: Geometry
A reflection is a mirror image created by transforming an original image over a line.
Source: MathWorks 12 Student Book/Teacher Guide. (Vancouver: Pacific Educational Press, 2011.)
Reflections are the next type of transformation you will examine.
Try This 3
-
- Explain how symmetry could be used to complete the following picture.
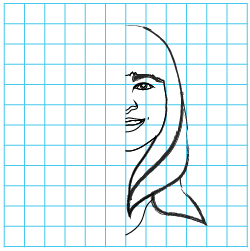
- Print Girl’s Face Diagram and complete the image using your strategy from question 1.a. One possibility for completing the picture is to use a reflection. To do this, pick key points, reflect them across the y-axis, and use the new points to guide where the rest of the drawing will go.
Did You Know?

Thomas Northcut/Digital Vision/ThinkstockIn reality most people’s faces are not symmetrical. Enter “facial symmetry” in your favorite search engine to see what many famous people would look like if their faces were symmetric. You can even take a picture of yourself and manipulate it to see what you would look like with a symmetric face.
- Explain how symmetry could be used to complete the following picture.
- Use the key-point strategy to complete the following diagram using the steps provided.
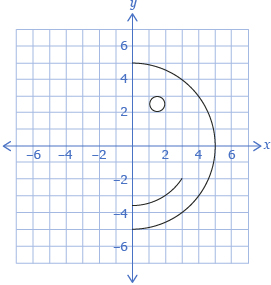
- Print Happy Face Diagram, which includes the key points.
- Determine the new location of each reflected point and draw the new points on the diagram. Label the new points with a prime symbol: ′. For example the point corresponding to A is A′.

- Complete the drawing.
- Determine the line of symmetry for this drawing.
-
- Record all coordinates from the drawing in a table like the one shown.
Original Point
Reflected Point
A(0, 5)
A′(0, 5)
B(4, 3)
B′(−4, 3)
- Describe the relationship between the original points and the reflected points.
- Record all coordinates from the drawing in a table like the one shown.
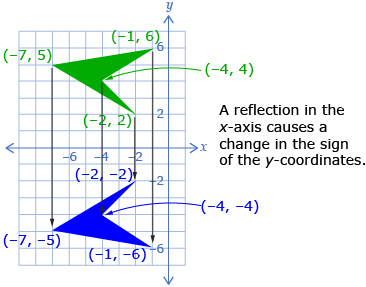
- Another common line of reflection, or axis of symmetry, is the x-axis.
- Predict how the original coordinates will change when a reflection occurs across the x-axis.
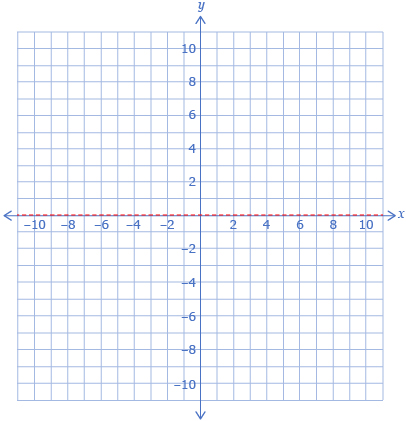
- Print Polygon Reflection Diagram, and reflect the polygon across the x-axis.
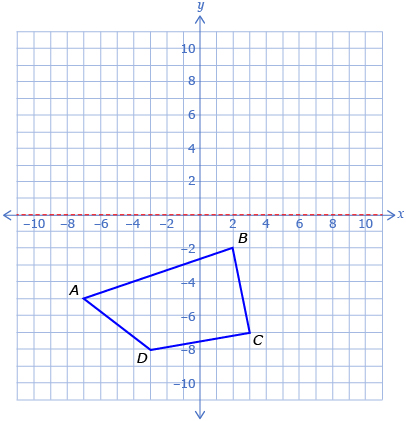
- Complete a table like the one shown.
Original Point
Reflected Point
A(−7, −5)
A′(−7, 5)
B(2, −2)
C(3, −7)
D(−3, −8)
- Describe the relationship between the original points and the reflected points. How does this compare to your prediction?
- Predict how the original coordinates will change when a reflection occurs across the x-axis.
![]() Save your responses in your course folder.
Save your responses in your course folder.
Share 2
With a partner or in a group, discuss the following questions.
- Compare the processes you used to reflect a shape.
- Describe the relationship between a line of reflection and a line of symmetry.
![]() If required, place a summary of your discussion in your course folder.
If required, place a summary of your discussion in your course folder.
1.8. Explore 4
Module 5: Geometry
In Try This 2, you may have noticed that reflecting a diagram produces a symmetrical picture where the line of symmetry is the same as the line of reflection. Two common lines of reflection are the x-axis and the y-axis.
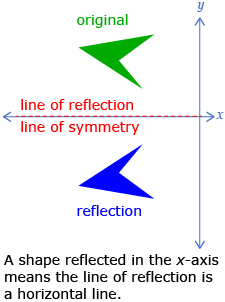
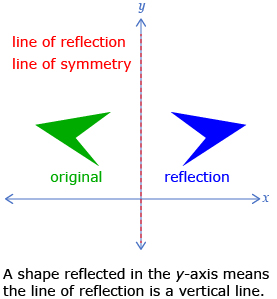
When reflecting in the x-axis, you change the sign of the y-coordinate of each point.
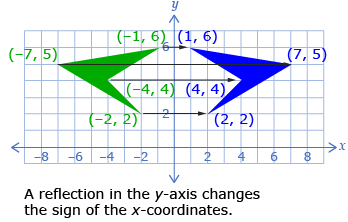
When reflecting in the y-axis, you change the sign of the x-coordinate of each point.
Self-Check 2
1.9. Explore 5
Module 5: Geometry
A dilation is the enlargement or reduction of a figure around a fixed point.
Source: MathWorks 12 Student Book/Teacher Guide. (Vancouver: Pacific Educational Press, 2011.)
Dilations are the next type of transformation you will focus on. A dilation is the enlargement or reduction of a figure around a fixed point. In this course you will use the point (0, 0) as the centre of dilation. Dilations are useful if you have an object and you would like to produce a similar object but of a different size.
Try This 4
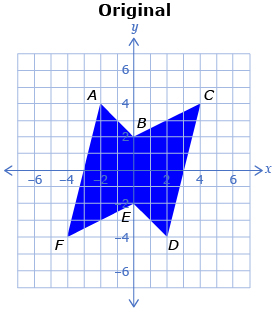
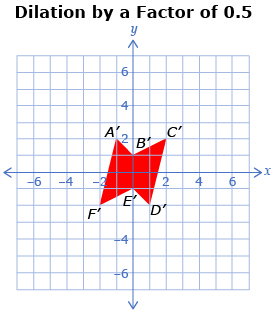
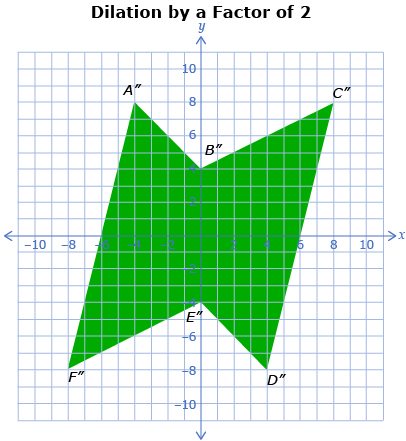
The following images show a polygon and two dilations. The first dilation is 0.5 times the size of the original polygon and the second dilation is 2 times the size of the original polygon.
-
- Describe how the three polygons are related.
- Complete a table like the one shown.
Point on Original
Corresponding Point on Dilation by a Factor of 0.5
Corresponding Point on Dilation by a Factor 2
A(−2, 4)
A′(−1, 2)
A″(−4, 8)
B(0, 2)
C(4, 4)
D(2, −4)
E(0, −2)
F(−4, −4)
- Describe how the corresponding points are related to the original points.
- Predict a rule that will determine the points of an object 3 times the size of the original.
- Predict a rule that will determine the points of an object 0.6 times the size of the original.
- How can you decide if the dilation will result in a larger figure or a smaller figure?
- Continue exploring dilations by opening Dilations.
- Pick a point on the shape you would like to work with. (You can change the shape of the polygon by moving the vertices. If you do this, keep the size of your shape similar to the size of the original shape.)
- Use the rule you predicted in 1.c. to determine where your point will be after a dilation by a factor of 3.
- Use the rule you predicted in 1.d. to determine where your point will be after a dilation by a factor of 0.6.
- Enter the dilation factors 3 and 0.6 into the input box in the Dilations interactive to check your answers to 2.b. and 2.c.
![]() Save your responses in your course folder.
Save your responses in your course folder.
1.10. Explore 6
Module 5: Geometry
In Try This 4, you saw that dilations change the size of an object, but not the shape of the object. To determine the new coordinates after a dilation, each x-coordinate and each y-coordinate is multiplied by the same scale factor. This means a dilation by a factor of 5 will give an object with lengths 5 times the size of those in the original image.
To determine the new points, multiply each x-coordinate and each y-coordinate by 5.
The scale factor of a transformation can be determined by dividing a length on the new object by the corresponding length on the original object.
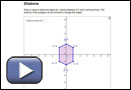
A dilation by a factor larger than 1 creates a larger shape. In the following example, the dimensions of the dilated triangle will all be 3 times the size of the dimensions of the original triangle.
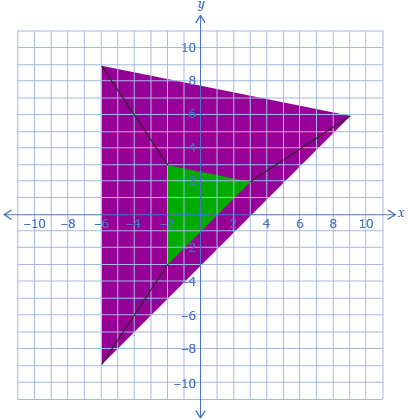
A dilation by a factor smaller than 1 creates a smaller shape. In the following example, the dimensions of the dilated triangle are ![]() the size of the dimensions in the original triangle.
the size of the dimensions in the original triangle.
Self-Check 3
Answer “Build Your Skills” questions 7 and 8 on pages 228 and 229 of the textbook. Answer
1.11. Explore 7
Module 5: Geometry
A rotation is the movement of an object around a fixed point.
Source: MathWorks 12 Student Book/Teacher Guide. (Vancouver: Pacific Educational Press, 2011.)
Rotations are the final type of transformation for you to explore. A rotation is the movement of an object around a fixed point. A rotation is useful if you want to change the orientation of an object by a specific amount. Rotations are often used in pattern generation.
Try This 5
- Consider this diagram:

- Describe a strategy you could use to accurately draw the second diagram using the first diagram.
- How accurate do you expect your diagram to be?
- There are many ways to complete the design in question 1. One way is to use rotations. Open Rotations. You can use the polygon provided, or make your own polygon by moving the vertices. Move the slider to rotate the polygon about the origin.
- Describe what happens when you rotate the polygon clockwise and counterclockwise.
- How is the point (0, 0) special for this rotation? Why is it called the centre of rotation?
- How is a rotation of 90° clockwise related to a rotation of 270° counterclockwise?
- The positions of points after rotations of 90°, 180°, and 270° can be predicted using methods similar to those for other transformations.
- Complete a table like the one shown using three points from your polygon.
Original Point
Point After 90°
Rotation ClockwisePoint After 180°
Rotation ClockwisePoint After 270°
Rotation Clockwise - Describe how the original point is related to the corresponding point after each of the three rotations.
- Use your answers from part b. to predict a rule that describes how the points change for each angle. The following table may help organize your thinking.
90° Rotation
Clockwise180° Rotation
Clockwise270° Rotation
Clockwise - Do you expect the rules you determined in part c. to work for counterclockwise rotations? If not, provide a set of rules that will work.
- Complete a table like the one shown using three points from your polygon.
![]() Save your responses in your course folder.
Save your responses in your course folder.
1.12. Explore 8
Module 5: Geometry
A rotation can be used to change the orientation of a figure. Rotations can be in a clockwise or a counterclockwise direction.

The coordinates of points can be predicted for some angles using a strategy similar to that used earlier. The mappings for a 90° and a 180° clockwise rotation are shown. Notice that the mapping for 180° is the same as performing a 90° rotation twice.
|
90° Clockwise Rotation |
180° Clockwise Rotation |
Description |
The x- and y-coordinates trade places, and the x-coordinate (now y) changes sign. |
Both the x- and y-coordinates change sign. |
Example |
(5, 3) → (3, −5) |
(5, 3) → (−5, −3) |
Self-Check 4
![]()
- Answer “Discuss the Ideas” questions 3.a, 3.b, and 3.c from page 223 of the textbook. Answer
- Answer “Build Your Skills” questions 2 and 6 from pages 227 and 228 of the textbook. Answer
Share 3
With a partner or in a group, discuss the following question.
Thus far, you have learned many rules for different transformations. Describe a strategy that will help you decide how a set of coordinates will change after a transformation, without having to memorize these rules.
![]() If required, place a summary of your discussion in your course folder.
If required, place a summary of your discussion in your course folder.
Add the following terms to your copy of Glossary Terms:
- transformation
- translation
- reflection
- dilation
- rotation
- scale factor
1.13. Connect
Module 5: Geometry
Complete the Lesson 4 Assignment that you saved in your course folder at the beginning of the lesson. Show work to support your answers.
![]() Save your responses in your course folder.
Save your responses in your course folder.
Project Connection
There is no Project Connection in this lesson.
1.14. Lesson 4 Summary
Module 5: Geometry
Lesson 4 Summary
In this lesson you looked at four ways of transforming an object.
- A translation slides an object to a new position.
- A reflection produces a mirror image of the original object.
- A dilation changes the size of an object but not its shape.
- A rotation turns a shape so as to change its orientation.
In the next lesson, you will explore how multiple transformations can be used successively.