Lesson 1: Identifying Linear Relations
| Site: | MoodleHUB.ca 🍁 |
| Course: | Mathematics 10C |
| Book: | Lesson 1: Identifying Linear Relations |
| Printed by: | Guest user |
| Date: | Tuesday, 4 November 2025, 3:41 AM |
Module 5: Linear Functions
Lesson 1: Identifying Linear Relations
Focus

Brand X Pictures/Thinkstock
An important skill in volleyball is the serve. A well-served ball can result in a quick point for your team, whereas a poorly served ball can result in a point for the opposition and loss of service. There are many variables that make a serve difficult for the other team to return. Besides the accuracy of the serve, the spin, speed, and height of the ball are all factors.
If you were to graph the volleyball’s path from the moment it is served until the moment it makes contact with either the ground or a player on the other side of the net, what would the graph’s shape be? Would it be a straight line or a curved line? What if you graphed the relationship between how hard a ball is served compared to how far the ball travels?
In Module 4 you learned about relations. In this lesson you will learn to distinguish between linear and non-linear relations. You will also learn how to identify linear relations expressed as graphs, tables, ordered pairs, and other representations.
Outcomes
At the end of this lesson, you will be able to do the following:
-> determine whether a situation, a graph, a table of values, an equation, or a set of ordered pairs represents a linear relation, and explain why or why not
-> draw a graph from a set of ordered pairs within a given situation, and determine whether the relationship between the variables is linear
-> match corresponding representations of linear relations
Lesson Questions
-
How can you distinguish a linear relation from a non-linear relation?
-
How can the concept of slope be used to identify a linear relation?
 Lesson Completion and Assessment
As you work through each lesson, complete all the questions and learning activities in your binder using paper and pencil, clearly labeling your work (they refer to this as your course folder). These include the Are you Ready, Try This, Share and Self Check questions. Check your work if answers are provided. Remember that these questions provide you with the practice and feedback that you need to successfully complete this course.
Once you have completed all of the learning activities, take the Lesson Quiz. This is the assessment for each lesson and is located under the Activities block on the left in moodle or under the Assess tab.
** Note – Share questions may have to be done on your own depending on your learning situation**
receive more information about how to complete the assignment later in this lesson.
Module 5: Linear Functions
Launch
This section checks to see if you have the prerequisite knowledge and skills to be able to complete this lesson successfully.
Are You Ready?
Complete these questions in your binder. If you are experiencing difficulty, you may want to use the information and the multimedia in the Refresher section to clarify concepts before completing these exercises.
Print (or copy by hand) and complete.
Lesson 1: Are you ready?Once you have completed these exercises to the best of your ability, use the provided answer link to check your work.
Answers
If you feel comfortable with the concepts covered in the questions, move forward to Discover. If you experienced difficulties or want more practice, use the resources in Refresher to review these important concepts before continuing through the lesson or contact your teacher.
 Refresher
The purpose of this section is to provide you with some resources to review in preparation for the lesson ahead. These resources may include videos, interactive applets, mini-lessons, and flash games to help you recall previously learned concepts. You can use these resources either before or after you try the questions in Are You Ready? Your teacher may also direct you to this section to review specific concepts.
-----------------------------------------------------
Use the "Relations and Functions" video to review concepts related to relations.

-----------------------------------------------------
Watch the short video on “Slope as Rise Over Run.”

-----------------------------------------------------
Watch the “Investigating Slope” video to see how you can use points to determine the rise and run of a line.

-----------------------------------------------------
Review how to find the slope from two points using the slope formula.

-----------------------------------------------------
Go to “Degree” and select the “polynomial” link in the second sentence. You can try the demonstration applet to review the definition of the degree of a polynomial.
-----------------------------------------------------
If you would like a more thorough review in preparation for this lesson, you can refer to the Explore sections of the following lessons:
-
Module 4: Lesson 2
-
Module 4: Lesson 4
Discover
 Math Lab: Identifying Linear Relations
Go Math Lab: Identifying Linear Relations, print it and complete it.
Math Lab: Identifying Functions
You will also want to access the following two help files that help you learn how to graph using your graphing calculator.
Graphing Functions
Setting the Viewing Window
Once you have completed these questions, use the link below to check your answers. Make any corrections or notes as needed. File this in your binder( course folder).
Mathematics 10C Learn EveryWare © 2010 Alberta Education
Module 5: Linear Functions
Explore

© Christophe Schmid/11946651/Fotolia
A linear relation is a relation whose graph is represented by points along a straight line. On the other hand, a non-linear relation is a relation whose graph is not represented by a straight line.
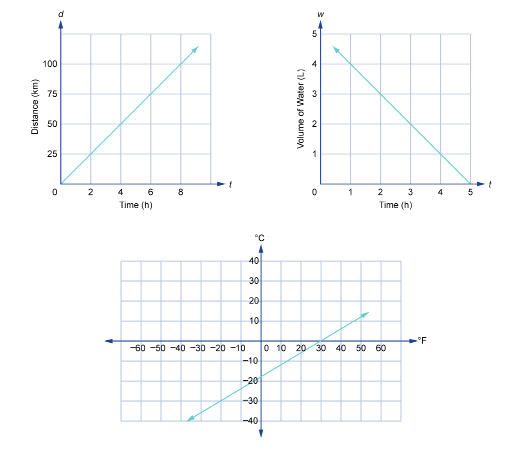
For instance, you have seen in Module 4 that some distance-time graphs can be represented by straight-line graphs. You have also seen that the slopes of these graphs are constant and that they represent speed. In Olympic disciplines, where a constant speed needs to be maintained, you will find examples of a linear relationship between distance and time. Examples of such disciplines include endurance races in swimming and running.
In this lesson you will examine different representations of relations and learn how to tell if each one is a linear relation. You will also learn that examples of linear relations are not confined to distance-time graphs.
Glossary Terms
Add the following terms to your "Glossary Terms" section in your notes.
You may also want to add examples that demonstrate how each term is applied.
-
linear relation
-
non-linear relation
----------------------------------------------------------------------
Any relation whose graph is represented by a straight line is considered a linear relation.
 Tip
Tip
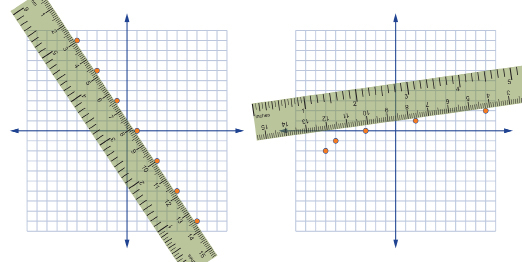
Graphing a relation is a sure-fire way of finding out whether a relation is linear. If a single straight line can pass through the points on the graph, the relation is linear.
In Module 4 you learned about the slopes of lines. Slope is the measure of the steepness of a line. Slope can be thought of as
You also learned that the slope of a straight line is constant. Recall Math Lab: Slope of a Staircase in Module 4: Lesson 4, where you determined the rise/run ratio of a single step on a staircase and compared that ratio to the slope of the entire staircase.
These concepts can help you to determine whether a relation in any form is linear or nonlinear.
![]() Try This 1 - 4
Try This 1 - 4
Complete the following in your binder. You can print the file or open it and just complete the questions.
Use the link below to check your answers to Try This 1 - 4.
Possible TT1-4 (Try This 1-4) Solutions
 THINK: How can you tell if a table of values represents a linear relation?
![]() Read
Read
Go to your textbook to confirm your response to the question above. As you read, try to find out what aspects of a table of values must be constant in order for the relation to be considered linear. Also, try to identify any exceptions. ** Write a rule for yourself on your TT1 - 4 pages**
Foundations and Pre-calculus Mathematics 10 (Pearson)
Read “Example 1: Determining Whether a Table of Values Represents a Linear Relation” on page 303.
A relation can also be represented by a set of ordered pairs. Just as there are many ways of representing a relation, there are also many strategies you can use to identify whether a relation is linear or non-linear.
Module 5: Linear Functions
 Self-Check 1
In the following Self-Check question, see if you can come up with at least two different strategies for determining whether a set of ordered pairs is linear. Once you have tested your strategies, check your work.
SC 1. Using two different methods, determine whether the set of ordered pairs S = {(−2, 8), (6, −4), (2, 2), (8, −7)} represents a linear relation.
Retrieve your results from Part B of the Math Lab.
Consider your response to this question: How can you tell from an equation whether its graph will be a straight line or not?
Another way to phrase this question is to ask: How can you tell whether an equation represents a linear or non-linear relation?
The following are three ways that you can identify an equation as a linear relation. Compare the following methods with your own.
Method 1: Table/Graph
Choose four or five values for the independent variable. Record these values in a table. Calculate the corresponding values of the dependent variable for the selected values of the independent variable. Record these values in the table. Graph the relation based on the table. If the graph reveals points along a straight line, then the relation is linear.
Method 2: Equation Form
If the equation is in the form y = mx + b, where m and b are real numbers, then the equation is a linear relation. Also, if the equation takes the form of x = b, where b is a real number, then it is also a linear relation.
Method 3: Degree of Equation
If the equation consists of one or two variables and is a first-degree equation, then it represents a linear relation.
 Read
Read
Foundations and Pre-calculus Mathematics 10 (Pearson)
Go to your textbook and read “Example 2: Determining Whether an Equation Represents a Linear Relation” on page 304 to see how relations expressed as equations can be identified as linear or non-linear. As you read, try to answer the following questions:
-
Which method is used to identify linear relations?
-
How are the relations y = 5 and x = 5 different?
As you discovered from previous lessons, a relation can be expressed in many ways. In Lesson 1 so far, you have examined linear relations expressed as graphs, tables, ordered pairs, and equations. One final method of describing a relation that will be examined in this lesson is the use of words. A relation can also be a description of a situation.
In these cases, how can you identify whether it’s a linear relation?
 Share 1 - 3
Complete the following questions in your course folder binder and then compare your answers with another classmate or appropriate partner ( if possible). Record any similarities and differences you discussed. Use the provided link to check your work.
The following situations represent relations that are linear and non-linear. Apply the techniques you have learned in this lesson to determine whether the relation is linear or non-linear, and explain how you know. Provide supporting explanations and/or show the steps you followed to arrive at your conclusions. Include in your response a discussion of what the key difference is between linear and non-linear situations.
1. The cost of downloading songs from a music website is $1.29 per song. The total cost of downloading songs is related to the number of songs downloaded.
2. Dennis invests $200. Every year, the value of the investment increases by 10%. The value of the investment is related to time.
3. The cost of hosting a fundraising dinner is $500 to rent the hall, plus $25 per person. The total cost of the event is related to the number of people that attend.
Self-Check 2
You have now learned to recognize linear relations in their different forms from graphs to words. The following Self-Check questions will give you the chance to test your ability to identify linear and non-linear relations when they are described in various forms.
SC 2. Identify each of the following relations as linear or non-linear. Provide support for your answer.
-
x
y
0
4
1
8
2
12
3
16
4
20
5
24
- S = {(15, 13), (20, 17), (5, 9), (10, 11)}
- y = x
- The number of bacteria in a sample doubles every two hours. The number of bacteria is related to time.
 Try This 5
Complete the following in your course folder ( binder).
Foundations and Pre-calculus Mathematics 10 (Pearson)
TT 5. Complete “Exercises” questions 3, 4, 5, 6, 16, and 17.a) on pages 308 to 310.
Use the link below to check your answers to Try This 5.
Module 5: Linear Functions
Connect
 Lesson Assessment
Complete the lesson quiz posted under the Quizzes link to the left in moodle or under the Assess tab and ensure your work in your binder (course folder) is complete.
 Project Connection **NOT ASSIGNED**

© Andres Rodriguez/ Fotolia
You have learned how to represent a linear relation as a graph, a table of values, a set of ordered pairs, an equation, and in words. You have also learned how to match equivalent relations.
Go to the Unit 3 Project and create a game for two or more people based on the outcomes of this lesson. This game could be based on an existing game, or it could be entirely original. You may want to construct a game from traditional materials such as construction paper or cardstock, or you may also want to consider creating a computer-based game.
 Going Beyond
The path of a ball used in volleyball follows the path of an arc called a parabola. Just as the equation of a non-vertical line can be written in the form y = mx + b, so is there a form for parabolas. In subsequent math courses, you may work with parabolas and other non-linear relations. These include
-
cubic functions
-
radical functions
-
exponential functions
-
logarithmic functions
Perform an Internet search for these and other functions. Find an example of the graph and an equation of each function. Use the Types of Functions chart to complete this activity.
Module 5: Linear Functions
Lesson 1 Summary
In Lesson 1 you investigated the following questions:
-
How can you distinguish a linear relation from a non-linear relation?
-
How can the concept of slope be used to identify a linear relation?
In this lesson you learned to identify relations as linear or non-linear when they are presented as graphs, tables, and equations. There are several ways to know whether a relation is linear or not.
1. A graph can be identified as linear if the points on the graph can be connected with a single line.Sometimes the need to develop a table of values and graph for there is necessary.
2. An equation represents a linear relation if it can be written in the form y = mx + b. You can also identify an equation as a linear relation if it contains one or two variables and is a first-degree equation.
3. The slope calculated between any two data points in the table is constant. You learned previously that the slope of a line is constant. This concept also helps you to identify a linear relation. For example, the data in a table is linear if the slope calculated between any two data points in the table is constant. A set of ordered pairs is considered linear if the slope between any two ordered pairs is constant. Indeed, the constant is the slope of the linear relation.
In the next lesson you will examine linear functions. Recall that a function is a special type of relation where each input value only has one output value. You will investigate the features of linear functions such as domain, range, and intercepts.