Lesson 5: Graphing Linear Functions
| Site: | MoodleHUB.ca 🍁 |
| Course: | Mathematics 10C |
| Book: | Lesson 5: Graphing Linear Functions |
| Printed by: | Guest user |
| Date: | Tuesday, 4 November 2025, 3:41 AM |
Description
Created by IMSreader
Module 5: Linear Functions
Lesson 5: Graphing Linear Functions
Focus

top left, top right, and bottom right: Christophe Schmid/iStockphoto/Thinkstock; bottom left: Veronika Surovtseva/iStockphoto/Thinkstock
There are four different techniques, or strokes, used in Olympic swimming. These are the butterfly stroke, the backstroke, the breaststroke, and freestyle. Each stroke requires a different way of moving the arms and a different way to breathe.
While most of the swimming events focus on one particular stroke, the medley events focus on all four! In the 200-m individual medley, each swimmer uses a different stroke for every 50 m of the race. The swimmers begin with the butterfly and end with the freestyle, or front crawl. The world record for both the 200-m and 400-m individual medley is held by Michael Phelps of the United States.
You have learned several ways of representing the equation of a linear function. These are the slope-intercept, general, and slope-point forms. In previous lessons you learned how to convert from one form to another.
In this lesson you will explore the strategies for using each form to graph linear functions. While you may not be breaking any world records, by the end of this lesson you will become more comfortable with different techniques for graphing lines. These techniques will come in handy in the remainder of this course.
Outcomes
At the end of this lesson, you will be able to
-> generalize and explain strategies for graphing a linear relation in slope-intercept, general, or slope-point form
-> graph, with and without technology, a linear relation given in slope-intercept, general, or slope-point form, and explain the strategy used to create the graph
-> match a set of linear relations to their graphs
Lesson Questions
-
In what ways can you verify that you have properly graphed a linear function?
-
How is graphing a linear relation similar to solving the corresponding equation?
 Lesson Completion and Assessment
As you work through each lesson, complete all the questions and learning activities in your binder using paper and pencil, clearly labeling your work (they refer to this as your course folder). These include the Are you Ready, Try This, Share and Self Check questions. Check your work if answers are provided. Remember that these questions provide you with the practice and feedback that you need to successfully complete this course.
Once you have completed all of the learning activities, take the Lesson Quiz. This is the assessment for each lesson and is located under the Activities block on the left in moodle or under the Assess tab.
** Note – Share questions may have to be done on your own depending on your learning situation**
Module 5: Linear Functions
Launch
This section checks to see if you have the prerequisite knowledge and skills to be able to complete this lesson successfully.
Are You Ready?
Complete these questions in your course folder (binder). If you are experiencing difficulty, you may want to use the information and the multimedia in the Refresher section to clarify concepts before completing these exercises.
Once you have completed these exercises to the best of your ability, use the provided answer link to check your work.
Answers
If you feel comfortable with the concepts covered in the questions, move forward to Discover. If you experienced difficulties or want more practice, use the resources in Refresher to review these important concepts before continuing through the lesson or contact your teacher.
 Refresher
The purpose of this section is to provide you with some resources to review in preparation for the lesson ahead. These resources may include videos, interactive applets, mini-lessons, and flash games to help you recall previously learned concepts. You can use these resources either before or after you try the questions in Are You Ready? Your teacher may also direct you to this section to review specific concepts.
--------------------------------------------------------------------------------
You have learned three forms for expressing a linear function.
These are summarized in this table.
|
Name |
Form |
Examples |
|
slope-intercept |
y = mx + b |
|
|
slope-point |
y − y1 = m(x − x1) |
|
|
general |
Ax + By + C = 0 |
x + 4y − 6 = 0 3x − 7y + 1 = 0 |

-----------------------------------------------------------------------------------
Go to the following site to watch a video on converting linear forms.

----------------------------------------------------------------------------------------
 Read
Read
In the first module of this course you investigated the surface area and volume of 3-D objects. You used formulas to evaluate not only volume and area but also radii, heights, and other lengths.
In this lesson you will also determine unknown parameters by substituting known parameters into an equation. Go to your textbook to get a sneak preview of how this skill will apply to this lesson. As you read, focus on how the solution is determined. You will later learn why the numbers are used in specific situations.
Foundations and Pre-calculus Mathematics 10 (Pearson)
Read part b) and part c) only of “Example 4: Using an Equation of a Linear Function to Solve a Problem” on page 361.
Discover
 Math Lab: Analyzing General Form
Go Math Lab: Analyzing General Form, print it (or copy by hand) and complete it.
Math Lab: Analyzing General Form
Once you have completed these questions, use the link below to check your answers. Make any corrections or notes as needed. File this in your binder( course folder).
Mathematics 10C Learn EveryWare © 2010 Alberta Education
Module 5: Linear Functions
Explore

Janis Litavnieks/iStockphoto/Thinkstock
There are many forms of martial arts, such as tae kwon do, karate, or Muay Thai boxing.
Tae kwon do, a martial art with origins in Korea, is an official Olympic discipline. Like any other combative sport, tae kwon do consists of both offensive and defensive tactics that enable competitors to score points in competition.
There are different types of strikes that are allowed, and some competitors may favour a particular kind of strike when competing. Nevertheless, the successful tae kwon do competitor will employ a variety of different strikes and blocks to overcome his or her opponent. Each manoeuvre is chosen based on the circumstances of the moment. Likewise, in this lesson you will explore a variety of strategies to graph linear functions.
In this lesson you will examine different ways of graphing a linear function based on the form of its equation. A linear relation is a relation whose graph is represented by points along a straight line. On the other hand, a non-linear relation is a relation whose graph is not represented by a straight line.
To graph a line, you need to know one of the following:
-
two points on the line
-
one point on the line and the slope
In the following activities you will learn how to extract the information you need from the form of the equation. The forms you will investigate are the slope-intercept form, the slope-point form, and the general form.
As you proceed through this lesson, you will be required to complete a summary sheet of the techniques and strategies for graphing linear functions. This summary sheet will help you to consolidate your learning. The sheet can also be used as a tool to help you review and prepare for tests or quizzes.
Save a copy (or copy by hand) the Graphing Linear Functions: Summary of Strategies document to your course folder now. A description of how to use the document is included.
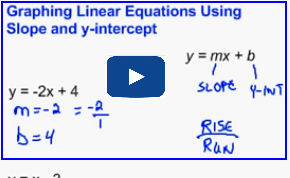
Slope-Intercept Form (y = mx + b)
 Watch and Listen
Watch the video “Graphing from Slope Intercept form”. Focus on how the slope is applied to find the second point.
----------------------------------------------------------------------
 Tip
Tip
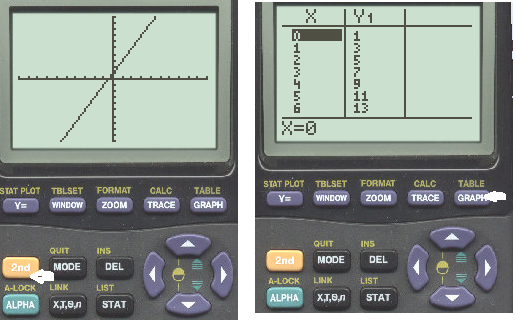
You can use a graphing calculator to check that you have sketched a graph properly. Enter the equation into the graphing editor. Most calculators will only accept an equation in the form “Y =”. Set an appropriate window and then graph the function. Compare your sketch to the one displayed on your calculator. Many graphing calculators will also have the option of checking specific points on the graph so you can be more confident that your sketch and the one on the calculator are identical.
 Self-Check
Now it is your turn to graph a linear relation expressed in slope-intercept form. Check your answers as you proceed.
SC 1. Consider the linear function ![]()
-
What is the slope?
-
Provide the coordinates of one point on the graph.
-
Use the information in SC 1.a. and SC 1.b. to sketch the graph. Describe the procedure you followed to sketch the graph.
-
Check your answer by using graphing display technology, such as a graphing calculator or graphing software.
Retrieve your Graphing Linear Functions: Summary of Strategies document that you saved to your course folder, and update it with your strategy for graphing based on slope-intercept form.
-----------------------------------------------------------------------------------------------------------------------------------------
Slope-Point Form
Recall that the slope-point form of the equation of a linear function is given by y − y1 = m(x − x1), where m is the slope and (x1, y1) is a point on the graph.
Graphing a linear function expressed in slope-point form is similar to graphing one expressed in slope-intercept form. In this case you will be applying the slope to a point other than to the y-intercept. This is mathematically sound since the slope of a line is constant between any two points.
Tip
With a slope-point equation, you have this form:y − y1 = m(x − x1)
To find a point on the graph, look at the (x1, y1) values. In other words, look at what is being subtracted from the x and y variables. In this case, y − 4 = 3(x − 2) shows that the 2 and the 4 are being subtracted. Therefore, a point on the graph is (2, 4).
If the equation is y + 4 = 3(x + 2), then you can rewrite it as y − (−4) = 3[x − (−2)]. This means that a point on this graph is (−2, −4).
Self-Check
Apply your knowledge of graphing linear functions to the following question. If you are stuck on any part of the problem, there are a couple of hints you can review to help you solve the question.
SC 2. Sketch the linear function y − 4 = 3(x − 2). Describe your reasoning and the procedure you followed. Check your answer by using graphing display technology, such as a graphing calculator or graphing software. Note: If you are stuck on any part of the problem, click on Finding a Point or Finding a Slope to help you answer this question.
Tip
If you have a point at the top area of your graph, and it is inconvenient to find a point higher on your graph, there is an alternate way to find a second point.
A slope of 3 is equal to ![]() or
or ![]() .
.
This implies that a second point can be found 3 units below and 1 unit left of the first point. You will obtain the same line whether you use this point or one that is above and to the right. Try it for yourself!
Your strategy for graphing may have been different than those presented in the suggested answer for SC 2; but the underlying principles are the same for any strategy. Make any necessary revisions to your sketch, and record any misconceptions that you may have had.
Retrieve the Graphing Linear Functions: Summary of Strategies document from your course folder, and record any new strategies that you have learned or any previously learned strategies that were reinforced. Remember to save your updated Graphing Linear Functions: Summary of Strategies document to your course folder (binder).
--------------------------------------------------------------------------------------------------------------------------------------------------
General Form
In the Discover section of this lesson, you investigated how you can extract a slope and points from the equation of a linear function in general form.
Retrieve your results from Math Lab: Analyzing General Form. In Part A, you rearranged equations given in general form to equations in slope-intercept form. You can do this also in the general case:
The slope is ![]() , and the y-intercept is
, and the y-intercept is ![]() .
.
Compare this final result to your response to question 3 from Part A. Did you arrive at the same conclusion? You may want to add any new knowledge that you may have gained to your answers in the Math Lab. Without erasing your initial response, revise your response by adding to it or noting errors in your thinking.
Module 5: Linear Functions
 Self-Check
SC 3. Consider the linear function 3x + 4y − 12 = 0. Sketch the graph of this function. Describe the steps you followed. Check your answer by using graphing technology. (You may have to rearrange the graph so that the variable y is isolated before you can enter the expression into your calculator.)
 Share 1 - 4
The two-intercept method allows you to find two points on a line—the minimum required to sketch a line. It is possible, and sometimes more convenient, to find two other points on a line besides the intercepts.
Work with a partner ( if possible) to answer the following questions. Complete these in your binder.
1. Describe how you can find two integral points (points with integer coordinates) on the line represented by the equation 5x + 3y - 8 = 0. Then sketch the graph.
2. When constructing a line, why is it better to use points that have integer coordinates?
3. How can you use technology to locate integral points?
4. If you can only find one point, how can you still graph the line?
Verifying a Graph
It is a very good habit to check to make sure your graph is correct, especially when you are solving for the x- and y-intercepts. There is a lot of algebra in this process, and one little mistake can lead you to an incorrect graph.
One way you can verify a graph is by checking that two points on the graph satisfy the equation of the line. Every point on the graph of a linear function will satisfy the equation of that linear function. This means that when you substitute the coordinates of any point on a line into the equation of that line, you will obtain a true statement. When verifying, you should choose at least one point on the graph that was not one of the original points used to graph the line.
Example
Verify the graph used in SC 3.
Solution
Look for another point on the graph; then substitute the coordinates of that point into the original equation. The point (−4, 6) appears to be on the graph.
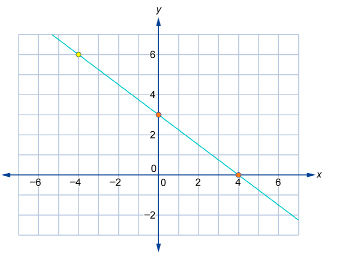
Verify the point (−4, 6). Substitute x = −4 and y = 6 into the equation 3x + 4y − 12 = 0.
Since the left side is equal to the right side, the point satisfies the equation. Therefore, the graph is probably correct. Now verify a second point.
Verify the point (4, 0). Substitute x = 4 and y = 0 into the equation 3x + 4y − 12 = 0.
Since the statement 0 = 0 is true, the point satisfies the equation. Therefore, the graph is correct.
Other ways to verify a graph include:->using graphing technology. Enter the equation into a graphing calculator or use graphing software; then check that the graph matches the one that has been manually constructed.
-> verifying by rearranging the equation into slope-intercept form to see if the slope and y-intercept match the one that has been manually constructed.
->verifying by finding coordinates (x, y) that satisfy the equation. Then check to see if that point is on the graph. ( see above)
Here is the help document again for graphing a line using your graphing calculator.
Graphing using a Graphing Calculator
Given the point ( -2, 3) is on the line described by y = -4x + b, find b.
Solution:
Sub the point into x and y in the equation and solve for b. Replace x with -2 and y with 3.
y = -4x + b
3 = -4(-2) + b
3 = 8 + b
3 - 8 = b
b = -5
Self-Check
SC 4. For each equation, do the following:
-
Create an accurate sketch. Show all work.
-
Verify that your sketch is accurate.

- x + 2y − 6 = 0
SC 5. Match each equation on the left with the corresponding graph on the right.
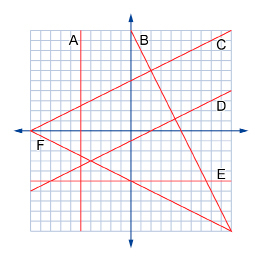
- x + 5 = 0

- 2x + y − 10 = 0
- y = −5
- x − 2y − 2 = 0
 Try This 1 - 3
Complete the following in your course folder ( binder).
Foundations and Pre-calculus Mathematics 10 (Pearson)
TT 1. Complete “Exercises” questions 7.b), 7.d), 7.e), and 18 on pages 362 to 364.
TT 2. Complete “Exercises” questions 7.b), 7.d), 15.a), and 15.d) on pages 372 and 373.
TT 3. Complete “Exercises” questions 14.b), 14.d), and 22 on pages 384 and 385.
Use the link below to check your answers to Try This 1 - 2.
Module 5: Linear Functions
Connect
Take time now to complete your Graphing Linear Functions: Summary of Strategies document that you saved to your course folder. Be sure to include at least two strategies for graphing linear functions in general form.
 Lesson Assessment
Complete the lesson quiz posted under the Quizzes link to the left in moodle or under the Assess tab and ensure your work in your binder (course folder) is complete.
 Project Connection **NOT ASSIGNED**

Ryan McVay/Digital Vision/Thinkstock
A velodrome is an arena built for track cycling. Velodromes feature banked tracks that allow a cyclist to travel at a high speed even while riding through turns in the track. In this section you will investigate the graph of a cyclist travelling at a constant speed.
The distance that a cyclist travels, y metres, with respect to the time elapsed, x seconds, is given by the equation 15x − 2y = 0. You will use this information to complete the Module 5: Lesson 5 component of the Unit 3 Project.
 Going Beyond

Jupiterimages/Pixland/Thinkstock
Correlation is a measure of how a change in one variable affects the change in another variable. If the increase in one variable results in the increase of another variable, then there is a positive correlation between the two variables. For example, for any basketball player, there may be a positive correlation between the number of shots taken and the number of points obtained. As the number of shots increases, the number of points increases.
On the other hand, if the increase in one variable results in the decrease of another variable, then there is a negative correlation between the two variables. For example, for a person on a weight-loss program, an increased amount of exercise is beneficial. Therefore, there is a negative correlation between exercise and weight since increased amounts of physical activity result in a decreased weight.
Do some research on correlation. Find out the answers to the following questions:
-
How can you tell the difference between graphs representing a positive correlation and those representing a negative correlation?
-
How do you know if a graph exhibits strong or weak correlation?
-
What is the correlation coefficient, and how does it measure correlation?
-
How is the correlation coefficient similar to, and different from, the slope of the line of best fit?
- How would you qualitatively describe the relationship between two variables whose data has a correlation coefficient of r = 1? Can you give an example of data that would have a correlation coefficient of 1?
Module 5: Linear Functions
Lesson 5 Summary
In this lesson you investigated the following questions:
->In what ways can you verify that you have properly graphed a linear function?
->How is graphing a linear relation similar to solving the corresponding equation?
In this lesson you explored strategies for graphing linear functions. To graph a line, you need to know either of the following:
->two points on the line
->one point on the line and its slope
The strategies you used depended on the form of the linear equation. For linear functions expressed in slope-intercept form or slope-point form, you are directly given the slope of the line as well as a point on the line. In the case of the equation y = mx + b, m is the slope and (0, b) is the y-intercept. In the case of the equation y − y1 = m(x − x1), m is the slope and (x1, y1) is a point on the line.
For linear functions expressed in general form Ax + By + C = 0, you learned two main approaches for graphing.
The first approach is to convert the general form into slope-intercept form. When this is done, the slope is ![]() and the y-intercept is
and the y-intercept is ![]() .
.
The second approach is to find two points on the line. Sometimes, the intercepts of the graph are easy to find and result in coordinates that are integers. When this is not the case, you can employ a system of trial and error to find points other than the intercepts which have integral coordinates.
Graphing a linear relation is similar to solving the corresponding equation in a couple of ways. In solving an equation, you are balancing both sides of the equation with the aim of isolating a particular variable. In graphing a linear relation, you may rearrange general form into slope-intercept form with the aim of isolating y. A second way that graphing a linear equation resembles the solving of an equation is in the way that points on the line are determined. In order to find a point on the line, whether it is an intercept or not, you need to substitute a value for x or for y. By doing so, you have made it possible to solve the equation for the other variable.
Verifying an equation can be done by selecting two points on the graph and substituting their coordinates into the equation of the line. If the result is a true statement for the coordinates of each point, then the line is considered correct. Since you have learned multiple strategies for graphing linear functions, another way to verify a graph is to employ a different approach to graph the line and then compare the result with the first graph.
You have now completed Module 5. In the next module you will learn about parallel and perpendicular lines and how to write the equations of linear equations. All of these outcomes were taught in the context of recreational pursuits and hobbies!