Section 2
| Site: | MoodleHUB.ca 🍁 |
| Course: | Math 20-3 SS |
| Book: | Section 2 |
| Printed by: | Guest user |
| Date: | Tuesday, 2 December 2025, 7:01 AM |
Description
Created by IMSreader
Table of contents
- 1. Section 2
- 1.1. Lesson 1
- 1.2. Launch
- 1.3. Are You Ready?
- 1.4. Refresher
- 1.5. Discover
- 1.6. Explore
- 1.7. Explore 2
- 1.8. Explore 3
- 1.9. Connect
- 1.10. Lesson 1 Summary
- 1.11. Lesson 2
- 1.12. Launch
- 1.13. Are You Ready?
- 1.14. Refresher
- 1.15. Discover
- 1.16. Explore
- 1.17. Explore 2
- 1.18. Explore 3
- 1.19. Explore 4
- 1.20. Connect
- 1.21. Lesson 2 Summary
- 1.22. Lesson 3
- 1.23. Launch
- 1.24. Are You Ready?
- 1.25. Refresher
- 1.26. Discover
- 1.27. Explore
- 1.28. Explore 2
- 1.29. Explore 3
- 1.30. Connect
- 1.31. Lesson 3 Summary
- 1.32. Lesson 4
- 1.33. Launch
- 1.34. Are You Ready?
- 1.35. Refresher
- 1.36. Discover
- 1.37. Explore
- 1.38. Explore 2
- 1.39. Explore 3
- 1.40. Connect
- 1.41. Lesson 4 Summary
- 1.42. Section 2 Summary
1. Section 2
Section 2: Perspective and Scale
Section 2 Introduction
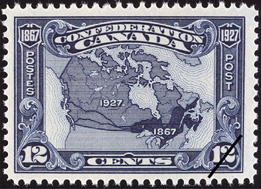
Library and Archives Canada; Copyright: Canada Post Corporation, 1927.. Reproduced with permission.
This commemorative stamp was issued in 1927 at the 60th anniversary of Canada's Confederation. It's amazing to be able to fit Canada, which stretches more than 9300 km from the Atlantic to the Pacific, on one small 12-cent stamp! The map, of course, is rather small in scale.
In Lesson 1 you will explore one-point perspective drawings of three-dimensional objects. The concept of scale in drawings, maps, and models will be discussed in Lessons 2 through 4. In the Module 5 Project you will create a scale model of a three-dimensional object.
1.1. Lesson 1
Section 2: Perspective and Scale
Lesson 1: One-Point Perspective
Focus
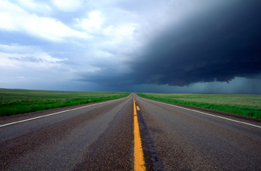
Comstock/Thinkstock
Have you ever driven along a prairie highway and watched the road narrow, and even vanish, at a distant point on the horizon? This classic prairie landscape in the photo captures the way your eyes see depth and your mind perceives distance.
In this lesson you will explore a method of drawing objects the way your eyes would see them in three dimensions.
Lesson Question
In this lesson you will investigate the following question:
- How are views drawn in one-point perspective?
Assessment
Your assessment for this lesson may include a combination of the following:
- course folder submissions from the Try This and Share sections of the lesson
- your contribution to the Mathematics 20-3: Glossary Terms
- Lesson 1 Assignment (Save a copy of your lesson assignment to your course folder now.)
Materials and Equipment
- blank sheets of paper
- pencils
- pencil crayons
- eraser
- straight edge
- square from a geometry set
Time
This lesson has been designed to take 150 minutes; however, it may take more or less time depending on how well you are able to understand the lesson concepts. It is important that you progress at your own pace based on your own learning needs.
1.2. Launch
Section 2: Perspective and Scale
Launch
This section checks to see if you have the necessary background knowledge and skills required to successfully complete Lesson 1.
Complete the following Are You Ready? questions. If you have difficulty or any questions, visit Refresher for a review or contact your teacher.
1.3. Are You Ready?
Section 2: Perspective and Scale
Are You Ready?
In this lesson you will apply your knowledge of some of the terminology associated with one-point perspectives.
If you answered the Are You Ready? questions without problems, move on to Discover.
If you found the Are You Ready? questions to be difficult, complete Refresher to review these topics.
1.4. Refresher
Section 2: Perspective and Scale
Refresher
If you don’t know the answers in Are You Ready?, or require more information, click on the buttons to study the Horizontal Line and Vertical Line applets.


Go back to Are You Ready? and try the questions again. Contact your teacher if you continue to have difficulty with the questions.
1.5. Discover
Section 2: Perspective and Scale
Discover
In this section you will investigate several principles behind one-point perspective drawings. A perspective drawing represents three-dimensional objects in such a way that the objects appear three dimensional rather than being flat on a two-dimensional surface. There are one-point, two-point, and three-point perspective drawings. In this course you will focus only on one-point perspective drawings.
First, you must understand an important concept. A horizon line is a horizontal line that represents the viewer’s eye level. If the horizon is above an object, the viewer must be looking down on top of the object.The vanishing point is an area on the horizon where the object moves out of sight. As you approach the vanishing point, objects get smaller and smaller until they disappear. The vanishing point is the farthest point in the perspective drawing.

BananaStock/Thinkstock
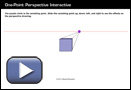
Use One-Point Perspective Interactive to investigate the effects on a perspective drawing when you move the vanishing point.
Try This 1
Use One-Point Perspective Interactive to answer the following questions.
- What side of the object do you see when the vanishing point is moved to the left side?
- What side do you see when the vanishing point is on the right side?
- What side of the object do you see when the vanishing point is above the object? Why?
- What side do you see when the vanishing point is below the object? Why?
Share 1
Share your answers to Try This 1 with a partner or with a group of people. Then discuss the following question:
- How does the view of an object (the side you see) change as the vanishing point moves?
![]() If required, save a copy of your discussion to your course folder.
If required, save a copy of your discussion to your course folder.
1.6. Explore
Section 2: Perspective and Scale
Explore
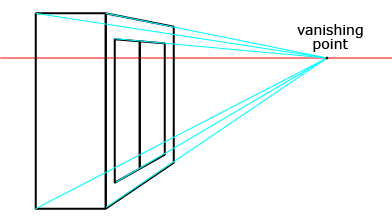
In Discover you learned that moving the vanishing point in a one-point perspective drawing changes what side of the object you view. Artists use this type of perspective drawing to show the front of the object face on.
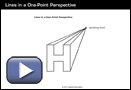
In a one-point perspective drawing, the lines drawn are vertical, horizontal, or diagonal. The diagonal lines are called orthogonal lines. All the orthogonal lines meet on the horizon at a single point called the vanishing point. Lines in a One-Point Perspective reviews all of the different lines in a one-point perspective drawing.
Practise this new terminology in the following Self-Check.
Self-Check 1
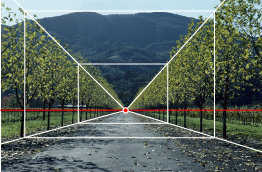
Brand X/Thinkstock
- The horizontal red line in the photograph is at the observer's eye level. What is the line called? Answer
- The road converges to the dot (point) located on the red line. What is that point called? Answer
- Assuming the trees are all approximately the same height, why do some trees appear to be so much smaller than others? Answer
- The sides of the road are perpendicular to the horizontal and vertical lines in the photograph. What are these lines called, including the lines along the tops of trees? Answer
- Through what point do all lines described in question 4 pass? Answer
- This photograph is an example of one-point perspective. Define one-point perspective. Answer
iStockphoto /Thinkstock
Example: Drawing a Bedroom in One-Point Perspective
You now have the terminology needed to sketch a one-point perspective drawing. The following Drawing a Bedroom in One-Point Perspective example describes the steps required to create a drawing in one-point perspective. You may find it beneficial to draw each step on your own sheet of paper—pause the animation when necessary.

1.7. Explore 2
Section 2: Perspective and Scale
Try This 2
Draw a one-point perspective of the cabinet shown in the photo. Draw the cabinet with the left side facing you, as shown in the photo. As you may notice, the top of the cabinet is above eye level.

Photodisc/Michael Blann/Thinkstock
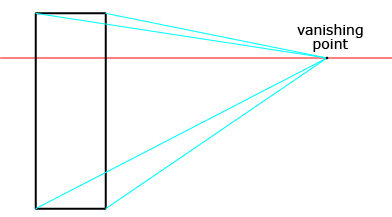
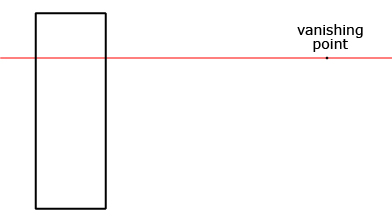
Step 1: Draw the horizon. Position the vanishing point on the right, as you will want to sketch the left side of the cabinet as it appears in the photograph. Check Step 1. ![]()
Step 2: Draw a rectangle representing the left side of the cabinet. The top of the cabinet must be above the horizon line, since you don't see the top of the cabinet. Therefore, the top of the cabinet is above eye level. Check Step 2. ![]()
Step 3: Draw the orthogonal lines from each corner of the rectangle. Check Step 3. ![]()
Step 4: Draw the vertical line to finish the edge of the cabinet. Add in the doors using orthogonal lines as necessary. Check Step 4. ![]()
Step 5: Erase all unnecessary lines.
![]() Save a copy of your drawing to your course folder.
Save a copy of your drawing to your course folder.
For an example of where the vanishing point is on the left side of the horizon, turn to pages 238 and 239 of MathWorks 11. Work through “Example 2.”
Now it’s time to practise your skills in Self-Check 2.
1.8. Explore 3
Section 2: Perspective and Scale
Self-Check 2
- Draw a one-point perspective of the island counter shown in the photograph.

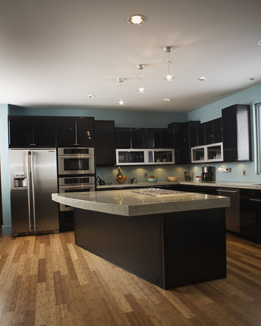
Brand X Pictures/Thinkstock
Answer
- The following television set was drawn in one-point perspective. The left side of the set is facing you.
It is now time to add new math terms to your Mathematics 20-3: Glossary Terms document.
In this lesson the new terms you will add are
- perspective
- one-point perspective
- orthogonal
- horizon
- vanishing point
You will need to put the vanishing point on the left of your drawing to orient the island as shown.
1.9. Connect
Section 2: Perspective and Scale
Connect
Going Beyond
In this lesson you explored one-point perspective. In a one-point perspective drawing, one side of an object is normally seen face on. To present a perspective drawing in which one corner of the object is “closest” to the viewer, two vanishing points are placed on the horizon. Use a search engine to learn how to draw a two-point perspective drawing.
Draw a rectangular box in two-point perspective so that the top of the box is visible.
Lesson 1 Assignment
Your lesson assignment contains some problems for you to solve using the knowledge gained during the lesson. Now you will have the chance to apply the concepts and strategies learned to a new situation. Show work to support your answers.
Open the Lesson 1 Assignment that you saved to your course folder and complete the questions.
1.10. Lesson 1 Summary
Section 2: Perspective and Scale
Lesson 1 Summary
In 1973, W. O. Mitchell’s book The Vanishing Point was published. The setting for this novel was patterned after the Eden Valley Reserve (part of Stoney Nakoda Nation) near Calgary. The novel deals with relationships between the First Nations people on the reserve and people in the wider community. Why do you think Mitchell chose The Vanishing Point as his title?
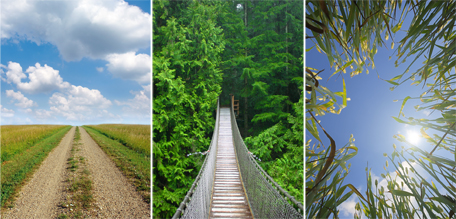
road: © JMB/9491797/Fotolia; foot bridge: © micahbowerbank/3773650/Fotolia; grass field: © Dreamframer/14438802/Fotolia
If you were designing a cover for Mitchell's book, which image would you choose? Where might the vanishing point be?
In this lesson you explored one-point perspective—the art of drawing a three-dimensional object so the object appears as your eyes see it.
1.11. Lesson 2
Section 2: Perspective and Scale
Lesson 2: Drawing Scale Diagrams
Focus
Creatas/Thinkstock
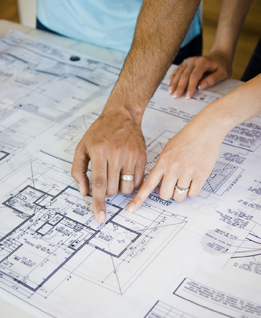
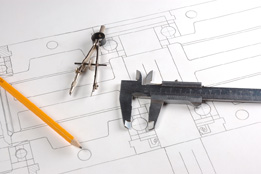
Architects, drafters, salespeople, home buyers, and contractors all make use of blueprints from a home's conception to its completion. Blueprints outline all the home’s features from the exterior to basement construction, framing, wiring, heating, and details for the interior design. Blueprints are drawn to scale so required materials can be ordered in the correct sizes and to ensure that overall dimensions and interior partitions can be easily understood.
In this lesson you will explore how to draw scale diagrams, of which blueprints are just one example. The scale diagrams will include representations of both two-dimensional and three-dimensional objects.
Lesson Question
In this lesson you will investigate the following question:
- How is a scale diagram of a two- or three-dimensional object drawn?
Assessment
Your assessment for this lesson may include a combination of the following:
- course folder submissions from the Try This and Share sections of the lesson
- your additions to the Mathematics 20-3: Glossary Terms
- Lesson 2 Assignment (Save a copy of your lesson assignment document to your course folder now.)
- the Project Connection
Materials and Equipment
- isometric dot paper
- ruler
- geometry set
- calculator
Time
This lesson has been designed to take 150 minutes; however, it may take more or less time depending on how well you are able to understand the lesson concepts. It is important that you progress at your own pace based on your own learning needs.
1.12. Launch
Section 2: Perspective and Scale
Launch
This section checks to see if you have the necessary background knowledge and skills required to successfully complete Lesson 2.
Complete the following Are You Ready? questions. If you have difficulty or any questions, visit Refresher for a review or contact your teacher.
1.13. Are You Ready?
Section 2: Perspective and Scale
Are You Ready?
In Module 3 and in previous mathematics courses, you solved equations involving ratios and proportions. Solving these types of equations is an essential skill when working with scale diagrams.
If you answered the Are You Ready? questions without problems, move on to Discover.
If you found the Are You Ready? questions to be difficult, complete Refresher to review these topics.
1.14. Refresher
Section 2: Perspective and Scale
Refresher

If you don't know the answers in Are You Ready?, or require more information, go to the Rates and Ratios applet to study equations involving ratio and proportion.
Go back to Are You Ready?, and try the questions again. Contact your teacher if you continue to have difficulty with the questions.
1.15. Discover
Section 2: Perspective and Scale
Discover
Have you used the zoom feature on a computer monitor? You may have used this device to enlarge small print. In Try This 1, you will identify patterns between the percentage of zoom and the change in an object's size.
Try This 1
- Set the zoom feature to 100%. Measure the width and height of the eagle image with a ruler—use millimetres (mm). Record the measurement in a chart similar to the one shown.
- Use “zoom” to enlarge and reduce the image to match the zoom setting in the chart. For each zoom setting, measure the height and width of the eagle image. Record all your observations.

iStockphoto/Thinkstock
Zoom Setting Width Height Ratio
Width
Height
Reduced Ratio
Width
Height
100%
(original)50% 25% 150% 200%
- Does the zoom feature change the drawing's overall shape? Why or why not? How do you know?
- Does the ratio between the width and the height change in the table? How do you know? Add another column to the chart so you can confirm your answer.

- How does “zoom” affect the dimensions of the original drawing?
![]() Save your responses to your course folder.
Save your responses to your course folder.
Share 1
Share your responses to the questions in Try This 1 with a classmate or with a group of people.
- How did the patterns observed in each table compare to yours? What patterns did you discuss that were new to you?
![]() If required, save a copy of your discussion in your course folder.
If required, save a copy of your discussion in your course folder.
Your new headings could look like this.
| Zoom Setting | Width | Height | Ratio
Width Height |
Reduced Ratio
Width Height |
1.16. Explore
Section 2: Perspective and Scale
Explore
In Discover you used the zoom feature on a computer to change the size of an object. You may have noticed the following:
- The overall dimensions of the eagle were always in the same proportion of
 no matter what the zoom was set to.
- When you set the zoom to 50%, the new image is the same shape as the original but its dimensions are
 the original's length. The new image is a scale image of the original. The scale is 50%,
  , or 1:2.
You may have noticed that the scale of a drawing or image may be represented in three ways: as a ratio, a fraction, or a percent.
As you read in Focus, scale drawings are important for the design and construction of homes. Scale drawings are also used in the design and building of many other objects, including automobiles and motorcycles. Scale diagrams and models are typically created before the actual real-life object is created.
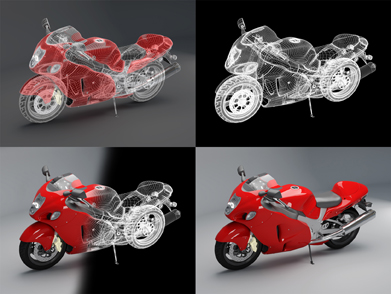
© rook76/10142377/Fotolia
Try This 2
Explore a scale model of an International Club tractor. Go to your favourite search engine, and type in the search terms “mad cat toys.” At the Mad Cat Toys website, choose the menu item “Scale Model Ratios,” and then choose “Open the Mad Cat Toys ScaleViewer.” Choose the “construction and farm” category and “International Club tractor.”
- Set the scale model to be at a 1:10 ratio of the actual tractor size. When the scale is 1:10, what is the length of the model tractor? What is the length of the actual tractor?

- Create a calculation you can use to find the actual length of the real-life tractor if you know the length of the model and the scale. Test your calculation using the height of the tractor.
- Predict what would happen to the length of the model when the scale is changed from 1:10 to 1:20. Check your prediction by entering the new ratio in the applet.
- Predict what would happen to the length of the model when the scale is changed from 1:10 to 1:5. Check your prediction by entering the new ratio.
- Use the information to explore other types of models.
![]() Save your responses to your course folder.
Save your responses to your course folder.
Share 2
Share and compare your responses to the questions in Try This 2 with a classmate or with a group of people. Then discuss the following question:
- How does changing the second number in the ratio affect the length of the model?
![]() If required, save a copy of your discussion in your course folder.
If required, save a copy of your discussion in your course folder.
1.17. Explore 2
Section 2: Perspective and Scale
Scale Model Example
iStockphoto/Thinkstock
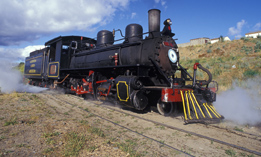
Model trains are often built using a scale called HO, which as a ratio is approximately 1:87. Luke wants to build a model of a particular locomotive that has an actual length of 93 ft. If Luke wants to build an HO model of this locomotive, what would its scale model length be to the nearest tenth of an inch?
Solution
As you work through Model Train Example—Solution, pay attention to the two proportions set up to help solve this problem. What do each of the proportions relate?
Another common use of scale diagrams is for creating maps. As you work through the following example, pay attention to the proportion used to relate the distances to the scale—notice how the units must be the same.
Example
A small corner of Prince Albert National Park is shown on the map. The scale is 1:125 000. What distance does 1 cm on the map represent?
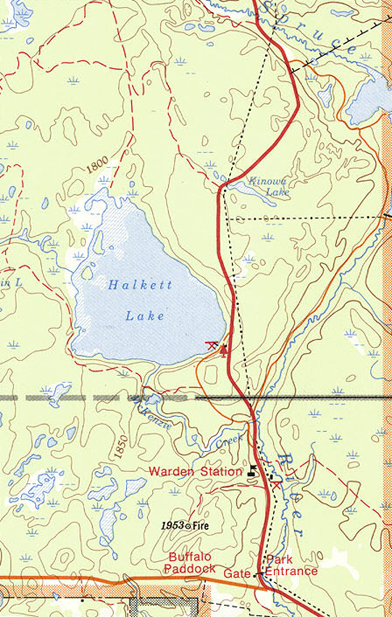
Atlas of Canada, (Ottawa: Natural Resources Canada, 2009),
<http://atlas.nrcan.gc.ca/auth/english/maps/archives/national_park/mcr_0210/#download>;
(17 November 2011).
Solution
The scale is 1:125 000.
1.18. Explore 3
Section 2: Perspective and Scale
Try This 3
Sometimes on a map, instead of a ratio such as 1:125 000, the scale is expressed as 1 cm = 1.25 km. If this is the case, think about how this data might change the calculation.
- Set up the proportion you would use. Check

- Solve the proportion to find the actual distance. Check
Scale is used on maps, blueprints, mechanical drawings, microscopic diagrams, model planes and trains, and photography. Now that you have been introduced to scale, it’s time for you to draw scale diagrams of some everyday two- and three-dimensional objects.

Comstock/Thinkstock
Example
An antique trunk is 40 cm wide, 100 cm long, and 60 cm high. Draw a scale diagram of this trunk on 1-cm isometric paper.
Solution
The trunk is 40 cm wide, 100 cm long, and 60 cm high.
- Choose a scale.
- If 1 cm on the isometric paper is equal to 10 cm for the actual trunk, the scale is 1:10.
- If 1 cm on the isometric paper is equal to 10 cm for the actual trunk, the scale is 1:10.
- Set up proportions using the scale 1:10 to find the length of each side in the scale drawing.
- Width of trunk in scale drawing:
- Length of scale diagram = 100 cm ÷ 10 = 10 cm.
- Height of scale diagram = 60 cm ÷ 10 = 6 cm.
- Width of trunk in scale drawing:
-
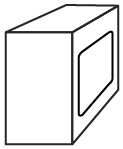
Draw the 3-D isometric image.
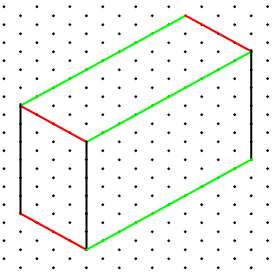
- Draw the height (shown in black) 6 cm high. This will be one corner of the box.
- Draw the width (shown in red) 4 cm long.
- Draw the length (shown in green) 10 cm long.
- Then complete the 3-D image of the trunk.
- Draw the height (shown in black) 6 cm high. This will be one corner of the box.
1.19. Explore 4
Section 2: Perspective and Scale
You will need to print one sheet of isometric paper for the following questions.
Self-Check 1
- Draw to scale the front, top, and side views of the antique trunk used in the example. Use a scale of 1:5. Answer
- Turn to page 227 of MathWorks 11 and answer question 3. Answer
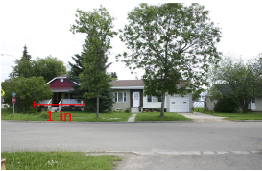
-
Tim is using Google maps to check out what his house looked like before his renovations began. Tim measures the width of his house on the computer screen and finds the width to be 1 in. If the actual width of the house on the photo's left side is 20 ft, what is the scale of the Google map image? Answer
It is now time to add new math terms to your Mathematics 20-3: Glossary Terms document.
In this lesson the new term you will add is
- scale
1.20. Connect
Section 2: Perspective and Scale
Connect
Project Connection
You have now worked with scale drawings and are ready to complete the “Draw Your Object” portion of the Module 5 Project found on page 231 of the textbook.
Lesson 2 Assignment
Your lesson assignment contains some problems for you to solve using the knowledge gained during the lesson. Now you will have the chance to apply the concepts and strategies learned to a new situation. Show work to support your answers.
You will need one sheet of isometric dot paper.
Open the Lesson 2 Assignment that you saved to your course folder and complete the questions.
1.21. Lesson 2 Summary
Section 2: Perspective and Scale
Lesson 2 Summary
Hemera/Thinkstock
In this lesson you were introduced to scale used in maps, blueprints, technical diagrams, and photographs. You discovered that scale can be expressed with units to reference, or scale may be outlined without units as a ratio or as a fraction.
As well as studying scale, you practised drawing scale diagrams. This lesson was just an introduction. In Lesson 3 you will spend more time exploring scale.
1.22. Lesson 3
Section 2: Perspective and Scale
Lesson 3: Constructing a Model to Scale in Three Dimensions
Focus
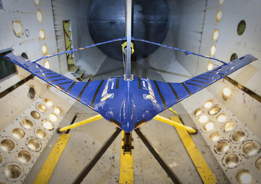
NASA Langley/Sean Smith
Models of future aircraft are tested in wind tunnels, such as the pictured one at NASA’s Langley Research Center. Constructing and placing scale models in wind tunnels at each stage of development helps aeronautical engineers determine the forces applied and the performance of their designs.
In this lesson you, too, will construct three-dimensional models to a given scale.
Lesson Question
In this lesson you will investigate the following question:
- How are three-dimensional models built according to a given scale?
Assessment
Your assessment for this lesson may include a combination of the following:
- course folder submissions from the Try This and Share sections of the lesson
- your contribution to Mathematics 20-3: Glossary Terms
- Lesson 3 Assignment (Save a copy of your lesson assignment document to your course folder now.)
Materials and Equipment
- ruler or geometry set
- scissors
- glue stick or tape
Time
This lesson has been designed to take 150 minutes; however, it may take more or less time depending on how well you are able to understand the lesson concepts. It is important that you progress at your own pace based on your own learning needs.
1.23. Launch
Section 2: Perspective and Scale
Launch
This section checks to see if you have the necessary background knowledge and skills required to successfully complete Lesson 3.
Complete the following Are You Ready? questions. If you have difficulty or any questions, visit Refresher for a review or contact your teacher.
1.24. Are You Ready?
Section 2: Perspective and Scale
Are You Ready?
When working with scale, you must be familiar with the units of linear measure in both SI and the imperial system. The following questions include both measures.
-
How many inches are there in 1 ft? Answer
- How many centimetres are there in 1 m? Answer
- Name three common items that are about 1 in wide. Answer
If you answered the Are You Ready? questions without problems, move on to Discover.
If you found the Are You Ready? questions difficult, complete Refresher to review these topics.
1.25. Refresher
Section 2: Perspective and Scale
Refresher
If you don’t know the answers to the questions in Are You Ready?, or if you require more information, go to Lesson 1 of Mathematics 10-3: Module 5 to review linear measure in the imperial system.

Go back to Are You Ready? and try the questions again. Contact your teacher if you continue to have difficulty with the questions.
1.26. Discover
Section 2: Perspective and Scale
Discover
Try This 1
Architects use a scaling ruler to directly calculate scale measurements. Click on Scale Rulers to download and print a file that contains two scale rulers.
For this activity you will need
- blank paper
 scale ruler page (from the file you just printed)
- straight edge or ruler
- pencil
- scissors
- tape
- Cut out the scale ruler pieces and assemble them to make one big ruler. Attach the paper ruler to the straight edge or ruler using tape.
- Using the ruler and the net of a rectangular prism, construct a model of the rectangular prism that is either half or double the original's size.
Hint: If you are stuck, watch Using a Scale Ruler, a short animation on how to use a scale ruler to scale up or scale down.
Share 1
With a partner, or with a group of people, share your answers from Try This 1. Then discuss the following question:
- How does the scaling ruler help you scale an object up or down quickly?
![]() If required, save a summary of your discussion in your course folder.
If required, save a summary of your discussion in your course folder.
1.27. Explore
Section 2: Perspective and Scale
Explore

Jeffrey Hamilton/Photodisc/Thinkstock
Three-dimensional models, made to scale, serve a variety of purposes. These purposes vary from engineering and design to the amusement of people. Have you ever wondered how they put those perfectly proportioned ships in bottles?
Most scale diagrams or models you have examined have been much smaller than the original items. Do an Internet search using the keywords “NAIT Avro Arrow video.” Watch the video to see how students from the Northern Alberta Institute of Technology (NAIT) in Edmonton helped restore a much larger model of the Avro Arrow. This plane is a proud part of Canada’s aviation history.
Try This 2
- The NAIT students worked on a full-scale model of the Avro Arrow. What is meant by the term full-scale?
- How would you represent full-scale with a ratio?
- What are some of the things the NAIT students might have learned, and what skills did they master by working on this Avro Arrow model?
![]() Save your responses to your course folder.
Save your responses to your course folder.
Share 2
Share your responses to the questions in Try This 2 with a classmate or with a group of people.
1.28. Explore 2
Section 2: Perspective and Scale
Example
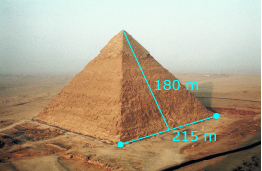
AbleStock.com/Thinkstock
It is not likely that a full-scale model of the Pyramid of Khafre at Giza will ever be built. This pyramid was built with a square base of approximately 215 m on each side and the slant height of each triangular face is approximately 180 m.
- If a 1:2000 scale model were constructed, how long, to the nearest millimetre, would each side of the square base be?
- To the nearest millimetre, what would the slant height be for each triangular face in the model?
Solution
| Description of Step |
|
|
To use the scale of 1:2000, you need to have all measurements in the same units—millimetres will work well.
Convert the side length to millimetres.
|
 |
 |
Identify the ratios that relate the scale to the actual model lengths.
|
s: 215 000 = 1:2000 | x: 180 000 = 1:2000 |
Set up a proportion and solve for s and x. Each side of the model’s square base would be about 108 mm and the slant height would be 90 mm. |
 |
 |
1.29. Explore 3
Section 2: Perspective and Scale
Try This 3
You saw how the dimensions of a 1:2000 square model of Khafre’s pyramid are calculated. Use the scale model dimensions from the example to build a scale model of the pyramid. You can modify the pyramid net provided or create the model from scratch.
You will need
- ruler
- geometry set
- tape or a glue stick
![]() Save your work to your course folder or somewhere safe. Your teacher may ask to view your model.
Save your work to your course folder or somewhere safe. Your teacher may ask to view your model.
Self-Check 1
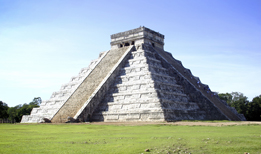
iStockphoto/Thinkstock
This photo is of Kukulkan Pyramid at Chichen Itza in Mexico. The height of the temple is 24 m and the square base is 55.3 m on a side. What scale would you use to construct a three-dimensional model of this Mayan temple so that the base of the model is 11.06 cm on each side? Answer
Throughout the history of people, Three-Dimensional Models have been made from a variety of materials.
images: PhotoObjects.net/Thinkstock
1.30. Connect
Section 2: Perspective and Scale
Connect
Going Beyond

PhotoObjects.net/Thinkstock
A cylindrical can of tomatoes is 75 mm wide and 110 mm tall. By modifying the net for a cylinder, construct the components of the can at 50% scale. You can use your scale ruler if you like. Answer
Lesson 3 Assignment
Your lesson assignment contains some problems for you to solve using the knowledge gained during the lesson. Now you will have the chance to apply the concepts and strategies that you have learned to a new situation. Please show work to support your answers.
Open your Lesson 3 Assignment that you saved to your course folder and complete the questions.
1.31. Lesson 3 Summary
Section 2: Perspective and Scale
Lesson 3 Summary
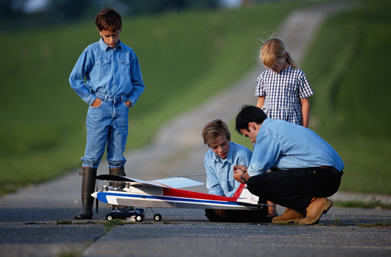
Photodisc/Thinkstock
Flying radio-controlled model aircraft is a popular pastime for people from all age groups. From the photo, can you identify the type of aircraft? What do you think is the scale of the model?
In this lesson you explored constructing a three-dimensional scale model.
One of your tasks was modifying a geometric net to accurately represent a given object.
1.32. Lesson 4
Section 2: Perspective and Scale
Lesson 4: Interpreting Scale Diagrams
Focus
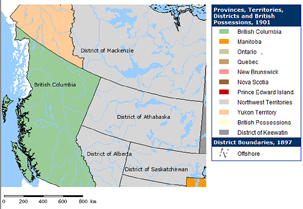
Credit: Atlas of Canada, (Ottawa: Natural Resources Canada, 1990), <http://atlas.nrcan.gc.ca/ > (24 November 2011).
If you look at early maps of Canada, you will notice that political divisions have changed. In 1901, the provinces of Alberta and Saskatchewan did not exist. Alberta and Saskatchewan were just two districts of the Northwest Territories, which stretched from Canada’s Arctic to the American border. As you can see from the map, the District of Saskatchewan spanned over 800 km from parts of present-day Alberta and Manitoba. Without the scale shown on the map, it would be impossible to judge distances or appreciate how large these districts were.
In this lesson you will explore the concept of scale in more detail. You will examine scale on maps and on other scale diagrams.
Lesson Question
In this lesson you will investigate the following question:
- How is proportional reasoning used to solve problems involving scale diagrams?
Assessment
Your assessment for this lesson may include a combination of the following:
- course folder submissions from the Try This and Share sections of the lesson
- your contribution to the Mathematics 20-3: Glossary Terms
- Lesson 4 Assignment (Save a copy of your lesson assignment to your course folder now.)
- the Project Connection
Materials and Equipment
- ruler
- calculator
Time
This lesson has been designed to take 150 minutes; however, it may take more or less time depending on how well you are able to understand the lesson concepts. It is important that you progress at your own pace based on your own learning needs.
1.33. Launch
Section 2: Perspective and Scale
Launch
This section checks to see if you have the necessary background knowledge and skills required to successfully complete Lesson 4.
Complete the following Are You Ready? questions. If you have difficulty or any questions, visit Refresher for a review or contact your teacher.
1.34. Are You Ready?
Section 2: Perspective and Scale
Are You Ready?
In Mathematics 10-3 and in Module 3 of this course, you explored changing from one unit of measurement to another. For example you changed pounds to kilograms, metres to millimetres, and yards to inches. Converting from one unit to another is an essential skill to master so you can solve problems involving scale.
- Convert 4 yd to feet. Answer
- Convert 12 km to centimetres. Answer
- Convert 0.1 mi to inches. There are 5280 ft in a mile. Answer
If you answered the Are You Ready? questions without problems, move on to Discover.
If you found the Are You Ready? questions difficult, complete Refresher to review these topics.
1.36. Discover
Section 2: Perspective and Scale
Discover
Have you ever played with Google Maps? If so, you’ve probably already looked at a satellite image of your home. How much detail were you able to see? In Try This 1 you will look up your home or a famous landmark using Google Maps to examine the effects of scale.
Try This 1
- Open up http://maps.google.ca/ and locate your home or another landmark by typing the address in the search engine. What is the scale of the first map that appears? If you were to write the scale as a ratio, what would it look like?

- Zoom in by pressing the + button once. Describe what happens to the scale. By how much does the scale increase or decrease? Why do you think this happens?
- As you zoom in, do you see more or less area of the neighbourhood?
- Predict what will happen if you press the + button one more time. Discuss your prediction in terms of scale and area displayed on the map. Check your prediction.
- Predict what will happen if you press the − button four times. Discuss your prediction in terms of scale and area displayed on the map. Check your prediction.
![]() Save your responses to your course folder.
Save your responses to your course folder.
Share
Share your responses to the questions in Try This 1 with a classmate or with a group of people. Work together to
- create a statement that describes how the zoom feature in Google Maps affects the scale of the map and the area in view
- test your statement using Google Maps
![]() If required, save a copy of your discussion in your course folder.
If required, save a copy of your discussion in your course folder.
1.37. Explore
Section 2: Perspective and Scale
Explore
In Discover you examined how changing the zoom affects the scale diagram or the scale map. You wrote the scale of the map as a ratio, but in Lesson 2 you saw that scale can be defined as a ratio, as a fraction, or as a percent.
There are many applications to using a zoom feature, such as reading maps or viewing objects through microscopes that use scale factors.
Try This 2
On this map of the Northwest Territories, a 1-cm distance on the map is equal to 200 km on the ground.
Natural Resources Canada
- Look at the map’s scale. This scale can also be written as a ratio and as a fraction. Why isn’t the scale written as 1:200 or
 ?
? 
- A scale written as a ratio must compare lengths in the same units. Convert 200 km into centimetres. Show your steps.
- Use the scale 1:20 000 000 to calculate how many miles would be represented by 1 in on the map. Round your answer to the nearest 10 mi.
- Set up a proportion using the map scale to find out how far (in inches) 1 in on the map represents in real life.
- Convert the number of inches on the ground to miles. Set up and use two separate proportions to do this conversion.
- Set up a proportion using the map scale to find out how far (in inches) 1 in on the map represents in real life.
![]() Save your responses to your course folder.
Save your responses to your course folder.
For another example involving proportional reasoning, turn to page 212 of MathWorks 11 and work through “Example 2.” Notice how a proportion is again used to help solve the problem.
1.38. Explore 2
Section 2: Perspective and Scale
Self-Check 1
- A map is drawn to a scale of 1:250 000. How many miles does 1 in on the map represent? Remember, there are 5280 ft in a mile. Round your answer to the nearest tenth of a mile. Answer
There are instances when a drawing or model is larger than the original. This is called a magnification. Microscope images, pictures, and diagrams are examples. When magnifying, the scale is greater than 1. For example, if the width of a scale drawing is 40 times the original, the scale would be 40:1 or ![]() .
.
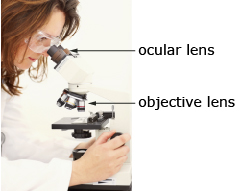
Hemera/Thinkstock
Example

istockphoto/Thinkstock
An amoeba is a tiny, one-celled organism frequently studied by biologists. You need a microscope to see most amoebas: the largest are only about 1 mm across. If an amoeba measuring 0.32 mm is observed through a microscope at 40x magnification, what size will its magnified image be?
If you are interested in learning more about amoebas, watch the video “Inside an Amoeba.”
Solution
|
→ | 40:1 = magnified image size:actual object size |
|
→ |  |
|
→ |  |
The size of the amoeba through the microscope would be 12.8 mm.
1.39. Explore 3
Section 2: Perspective and Scale
Self-Check 2
- The dollhouse in the photograph was built using a 1:18 scale. If it had been built to a 1:20 scale, would it be larger or smaller? Justify your answer. Answer
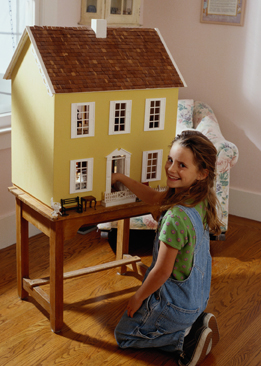
Photodisc/Thinkstock
- Turn to page 215 of MathWorks 11 and do questions 1 and 2 of “Build Your Skills.” Answer
- In 2011 the Canadian Mint circulated a twenty-dollar silver coin. The width of the coin was 27 mm. Print this enlarged image of a twenty-dollar silver coin, and then answer the following questions.
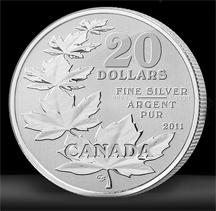
Coin image: © 2011 Royal Canadian Mint – All Rights Reserved /
Image de pièce© 2011 Monnaie royale canadienne – Tous droits réservés
It is now time to add new math terms to Mathematics 20-3: Glossary Terms.
In this lesson the new term you will add is
- magnification
1.40. Connect
Section 2: Perspective and Scale
Connect
Going Beyond
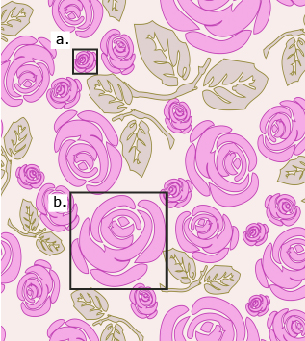
Hannah bought fabric for a shawl. She noticed that the roses at a and b are scale drawings of each other. View the Rose Drawing. You may wish to print the drawing to make the measurements needed for questions 1 and 2.
- If a is a scale drawing of b, what scale was used?
- If b is a scale drawing of a, what scale was used?
- How are the scales from questions 1 and 2 related?
iStockphoto/Thinkstock
Project Connection
You have now worked with scale models and are ready to complete Part 2 of “Complete Your Drawings and Build a Scale Model” of the Module 5 Project from page 247 of the textbook.
Exploded views will be discussed in Section 3. Pay close attention to how you assemble your model for the Module 5 Project—you will use the order in which you assembled your model when you create an exploded view of your object.
Lesson 4 Assignment
Your lesson assignment contains some problems for you to solve using the knowledge gained during the lesson. Now you will have the chance to apply the concepts and strategies learned to a new situation. Show work to support your answers.
Open the Lesson 4 Assignment that you saved to your course folder and complete the questions.
1.41. Lesson 4 Summary
Section 2: Perspective and Scale
Lesson 4 Summary
© Bruce McDonald
David Thompson is one of the world’s greatest explorers and cartographers (map makers). He arrived at Hudson Bay at the age of 14 and spent 28 years of his life exploring and mapping almost one-sixth of North America. His maps have been used for more than 200 years!
In this lesson you explored problems involving scale. Maps are just one of the many contexts in which scale is an essential component. In addition to scale, you reviewed converting between units and using proportions.
1.42. Section 2 Summary
Section 2: Perspective and Scale
Section 2 Summary

iStockphoto/Thinkstock
This photograph shows a bleak winter landscape and captures an image of a long, cold walk across the bridge. The sense of distance is created though one-point perspective. The bridge narrows as it approaches the far shore, just as elements farther away appear smaller.
In Lesson 1 you explored the elements of one-point perspective in photography and drawing. In Lessons 2 and 4, you examined the concept of scale. Using proportional reasoning, you solved a variety of problems involving scale in maps, diagrams, art, and three-dimensional models. In Lesson 3 you created three-dimensional scale models. The creation of a three-dimensional scale model was the central theme for the Module 5 Project: Produce a Set of Drawings and a Scale Model.