Module 8
| Site: | MoodleHUB.ca 🍁 |
| Course: | Biology 30 SS |
| Book: | Module 8 |
| Printed by: | Guest user |
| Date: | Friday, 19 December 2025, 2:34 AM |
Description
Created by IMSreader
Table of contents
- 1. Module 8
- 1.1. Big Picture
- 1.2. In this Module
- 1.3. Lesson 1
- 1.4. Page 2
- 1.5. Page 3
- 1.6. Page 4
- 1.7. Page 5
- 1.8. Lesson 2
- 1.9. Page 2
- 1.10. Page 3
- 1.11. Page 4
- 1.12. Lesson 3
- 1.13. Page 2
- 1.14. Page 3
- 1.15. Page 4
- 1.16. Page 5
- 1.17. Lesson 4
- 1.18. Page 2
- 1.19. Page 3
- 1.20. Lesson 5
- 1.21. Page 2
- 1.22. Page 3
- 1.23. Page 4
- 1.24. Lesson 6
- 1.25. Page 2
- 1.26. Page 3
- 1.27. Lesson 7
- 1.28. Page 2
- 1.29. Page 3
- 1.30. Page 4
- 1.31. Lesson 8
- 1.32. Page 2
- 1.33. Page 3
- 1.34. Lesson 9
- 1.35. Page 2
- 1.36. Page 3
- 1.37. Page 4
- 1.38. Lesson 10
- 1.39. Page 2
- 1.40. Page 3
- 1.41. Page 4
- 1.42. Page 5
- 1.43. Lesson 11
- 1.44. Page 2
- 1.45. Page 3
- 1.46. Page 4
- 1.47. Page 5
- 1.48. Module Summary/Assessment
- 1.49. Module Glossary
1. Module 8
Module 8—Populations, Individuals, and Gene Pools
Introduction
In this module you will be introduced to the gene pool, and you will learn how to quantify its makeup, determine whether it is changing, and determine what factors led to this change. You will apply your knowledge to determine what factors and conditions in a population change the gene pool and to analyze the effects of these factors.
Next, you will look at how the interactions and symbiotic relationships between organisms affect the structure of populations and communities. You will examine defence mechanisms that organisms use to survive predation and competition. You will study the concept of succession and how the species that make up communities change over time. You will apply your knowledge to discussing the relationships that exist between species and ecosystems and the effects these interactions have on population changes.
You will examine the factors that contribute to growth, and you will learn how growth within populations is measured. As part of your studies, you will learn about the two major types of growth patterns and the two reproductive strategies used by organisms for maximizing population growth. Finally, you will learn how biologists measure, interpret, and analyze the changes in populations over time.
This module relies on prior knowledge of genetics, ecosystems, and, to some degree, evolution. If you need to review these concepts prior to starting this module, read Chapters 3, 14, and 17 in your textbook.
In the Biology 30 Course Introduction, several resources, including The Key and Student Notes and Problems Workbook: Biology 30, were recommended to you for additional support towards your success. Continue to use these resources as you work through Module 8.
1.1. Big Picture
Module 8—Populations, Individuals, and Gene Pools
 Big Picture
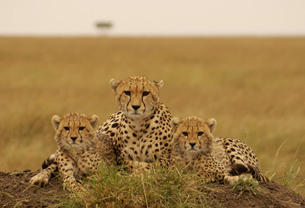
© Traveler/12606712/Fotolia
The beautiful, sleek predators shown in the pictures are cheetahs of the African Serengeti. Wouldn’t it be amazing to observe a family of wild cheetahs in Tanzania or Kenya? If you stay quiet and still, you may be able to watch the perfectly camouflaged mother and cubs in the tall, dry, yellow grass. They have their eyes on a herd of nearby antelope. You watch as the mother springs from the bush and uses her lightning speed and strong jaws to bring down the slowest of the fleeing herd of antelope as they disappear in a cloud of dust.
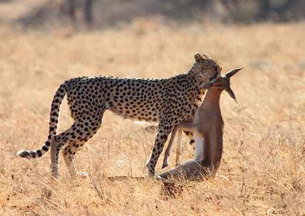
© Luc PATUREAU/1252507/Fotolia
Later, at your lodge, the naturalist tells you that cheetahs are considered “biologically extinct” because of a lack of variation in their gene pool. Apparently modern cheetahs are so genetically alike that skin grafts between individuals are not rejected—much like identical twins. The naturalist explains that because cheetahs are so similar, any micro-organism or environmental change that affects some will affect all, and it may be only a matter of time before the species becomes extinct. Their lack of diversity means that no individuals would survive the change.
You are concerned to hear that human activities, such as agriculture, mining, and urban development, have decreased the cheetahs' natural habitat and prevented different cheetah populations from interbreeding. The naturalist worries that without the cheetah, the populations of wildebeest, zebra, and antelope (all cheetahs' natural prey) will not be kept in check, leading to the starvation and disease that accompany high density.
How can biologists possibly know how much genetic variation exists in a population or whether the population is changing? How is it possible to even count cheetahs in the wild, considering how well camouflaged they are and how fast they move? How do biologists predict how cheetah numbers affect other species that share their habitats?
You start to realize that park wildlife managers need to understand a great deal about the genetic, physical, and reproductive characteristics of cheetahs and the relationships cheetahs have with other organisms with whom they share the Serengeti. You get a glimpse of the problems that result when human activities that make life better for people limit the survival of the other species sharing the planet.
This module will explore the following focusing questions:
- How do biologists quantitatively describe the genetic composition of a population’s gene pool?
- What are the five conditions of the Hardy-Weinberg principle that affect frequency of alleles in a population, resulting in microevolution?
- What happens when conditions of the Hardy-Weinberg principle are not met?
- What factors cause changes in the diversity of gene pool composition?
- How can the Hardy-Weinberg Equation, involving allele and genotype frequencies in populations, graphs, and population data, be used to study changes in population over time?
- What are the intended and unintended consequences of human activities and scientific and technological developments on gene pools?
- What are the relationships that exist between species, and how can they contribute to population changes?
- What are the defence mechanisms that protect prey, enable predators, and allow organisms to compete successfully?
- How do communities and their populations change or remain stable over time?
- What are the factors that influence population size?
- How do these factors influence population change?
- How can data be analyzed to study population dynamics?
- What terms can be used to describe population dynamics and to give the data meaning?
- What are the different types of population growth patterns?
- How do growth patterns illustrate these types of changes over time?
- What are the characteristics and reproductive strategies of r- and K-selected organisms?
To help you organize the concepts you learn in Module 8, and to provide you with a study aid for review before you complete the Module Assessment, you may choose to download the Concept Organizer for Module 8. Fill in this concept organizer with the ideas you master as you work through each lesson, or prepare the organizer when you have completed Module 8. You can use keywords, point form, or any amount of detail that meets your needs. You may choose to work from the file on your computer, print the document and work from the paper copy, or copy the outline onto a large sheet of poster paper. After you have prepared your concept organizer, you may wish to check your work with the concept organizer provided in the Module Summary. The concept organizer provided outlines some of the key topics that you should include in each lesson of your concept organizer. This is a great tool to review and use for study purposes, but using this organizer is completely your choice.
Your Module Assessment will involve the application of your knowledge about the genetic composition of a population, and how it changes, and the way populations grow and relate to other species (including humans) that make up the communities in which they live. When you have completed all the lessons, you will need to complete one of the Module Assessment task options. For more details about the Module Assessment and the evaluation criteria, visit the Module Assessment section.
1.2. In this Module
Module 8—Populations, Individuals, and Gene Pools
In This Module
Inquiry Question: How does the biology of populations differ from the biology of individual organisms?
How can an individual’s contributions to the gene pool of a population and the interactions within a population and between populations result in changes in communities?
There are eleven lessons in Module 8. Most of the lessons in Module 8 are designed to take you approximately 80 minutes to complete; however, because of the significance of certain concepts, some lessons may take longer to complete. The suggested lesson times do not include the time needed to complete such activities as “Try This,” “Watch and Listen,” assignments, practice questions, review, or research.
This unit involves Chapters 19 and 20, or pages 676 to 747, in your textbook.
Lesson 1: Hardy-Weinberg Principle—the Gene Pool
This is a significant lesson in your studies and may require a longer period of time to complete. In this lesson you will study the concepts of a population’s gene pool and gene frequency. You will learn how to calculate frequencies using the Hardy-Weinberg equation.
You will consider the following focusing questions:
- How do biologists quantitatively describe the composition of a population’s gene pool?
- What are the five conditions of the Hardy-Weinberg principle that affect frequency of alleles in a population’s gene pool, resulting in microevolution?
- What happens when conditions of the Hardy-Weinberg principle are not met?
Lesson 2: Causes of Change in the Gene Pool
In this lesson you will examine stability and change in populations and the factors (natural and artificial) that cause frequencies in the gene pool to change.
You will consider the following focusing question:
- What factors cause changes in the diversity of gene pool composition?
Lesson 3: Hardy-Weinberg Calculations
In this lesson you will learn the Hardy-Weinberg equation and apply the equation to population calculations.
You will consider the following focusing questions:
- How can the Hardy-Weinberg equation, involving allele and genotype frequencies in populations, graphs, and population data, be used to study changes in population over time?
- How do we analyze and interpret this data to make predictions and decisions about population management?
Lesson 4: Human Activity, Biotechnology, and Gene Pool Change
In this lesson you will examine the positive and negative roles of humans in bringing about gene pool change and evolution of natural species.
You will consider the following focusing question:
- What are the intended and unintended consequences of human activities and scientific and technological developments on gene pools?
Lesson 5: Species Interactions and Symbiotic Relationships
In this lesson you will learn to identify various interactions between species and explain the types of symbiotic relationships that exist between species.
You will consider the following focusing questions:
- What relationships exist between species and ecosystems?
- What effects do these interactions have on population changes?
Lesson 6: Role of Defence
In this lesson you will examine how organisms compete in every-day relationships and how they protect themselves from members of other species.
You will consider the following focusing question:
- What are the defence mechanisms within predation and competition?
Lesson 7: Populations and Communities Changing Over Time—Succession
In this lesson you will explore the features and types of succession that change the species composition of communities over time.
You will consider the following focusing question:
- How do communities and their populations change or remain stable over time?
Lesson 8: Factors Influencing Growth
In this lesson you will explore the factors that influence the growth of a population and determine whether or not the population size increases, decreases, or remains stable.
You will consider the following focusing questions:
- What are the factors that influence population size?
- How do these factors influence population change?
Lesson 9: Measuring Growth
In this lesson you will explore the type of data that can be collected about population sizes, how data can be interpreted, and how the results of these studies can be used to manage natural populations.
You will consider the following focusing questions:
- How can data be analyzed to study population dynamics?
- How can population data be expressed to give the data meaning?
Lesson 10: Growth Patterns
In this lesson you will discover the many different growth patterns for natural populations. You will examine and compare them to the unique pattern of human population growth.
You will consider the following focusing questions:
- What are the different types of population growth patterns?
- How do growth patterns illustrate these types of changes over time?
Lesson 11: r- and K-Selected Growth Patterns
In this lesson you will examine the characteristics and reproductive strategies of two categories of population types.
You will consider the following focusing question:
- What are the characteristics and reproductive strategies of r- and K- selected organisms?
1.3. Lesson 1
Module 8—Populations, Individuals, and Gene Pools
Lesson 1: Hardy-Weinberg Principle—the Gene Pool
 Get Focused
© Silverpics/6286431/ Fotolia
In Unit C you focused on how individuals inherit their genes. In Unit D you will focus on how each living organism is part of a functioning population.
The Old Order Amish are a human population that immigrated to the United States from Switzerland in the 1800s in an attempt to escape modern technology and culture. They live apart in closed rural colonies, reproducing within their own communities and living much the same as farmers did 100 years ago. The Amish are of interest to population geneticists because of the prevalence of Ellis-van Creveld syndrome, a homozygous recessive condition that results in polydactyly, or extra digits on the hands and/or feet. Polydactyly is much more common in the Old Order Amish than in any other human population.
population: organisms of a particular species in a particular place at a particular time
frequency: number/total
Unlike the extra finger or toe that can be clearly seen in polydactyly, most of the time it is difficult to see the slight variations that exist between members of a population. Similarly, if there were two alleles for a gene, a dominant and recessive allele, it would be difficult to determine which allele or which genotype is most common in the population because the recessive allele is hidden in heterozygotes. It would also be difficult to determine whether the frequency of one genotype is increasing or decreasing, and what that might mean for the population’s success and survival.
Population biologists track this information. By knowing the frequency of alleles, genotypes, and phenotypes in a population, biologists can determine how a population is changing. A biologist might look at frequencies and ask the following questions:
- Why are there more and more homozygous recessives and fewer individuals with the dominant phenotype?
- Does it mean the population is being pressured by disease or predators?
- Is the population evolving in response to climate change? Why is one allele increasing over the other? Why is the other allele disappearing?
The ability to quantitatively measure the composition of a gene pool is an important skill for a biologist.
In this lesson the following focusing questions will be examined:
- How do biologists quantitatively describe the composition of a population’s gene pool?
- What are the five conditions of the Hardy-Weinberg principle that affect frequency of alleles in a population’s gene pool, resulting in microevolution?
- What happens when conditions of the Hardy-Weinberg principle are not met?
 Module 8: Lesson 1 Assignment
Download a copy of the Module 8: Lesson 1 Assignment to your computer now. You will receive further instructions on how to complete this assignment later in the lesson.
The other questions in this lesson are not marked by the teacher; however, you should still answer these questions. The “Self-Check” and “Try This” questions are placed in this lesson to help you review important information and build key concepts that may be applied in future lessons.
After a discussion with your teacher, you must decide what to do with the questions that are not part of your assignment. For example, you may decide to submit to your teacher the responses to “Try This” questions that are not marked. You should record the answers to all of the questions in this lesson and place those answers in your course folder.
Remember that you also have the option of trying additional questions from the textbook for further practice. Consult with your teacher for the answers to these questions. The Key will also provide you with many Diploma-Exam-style multiple-choice, numerical-response, and written-response questions that will be an excellent review of the module. Practising your responses to these types of questions is good preparation for the Diploma Exam.
1.4. Page 2
Module 8—Populations, Individuals, and Gene Pools
 Explore
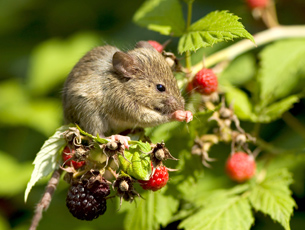
© Eduard Kyslynskyy/shutterstock
Describing Gene Pools
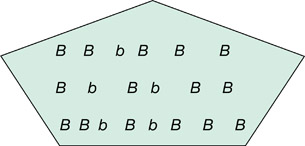
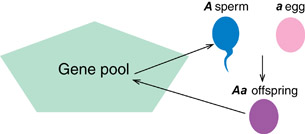
When people are interested in the genetic composition of a population, they are interested in its gene pool. Consider a population of only ten field mice on the southern Alberta prairies. Assume that mice have two different alleles for coat colour, brown (B) and white (b). The genotypes for the mice are shown in the diagram below.
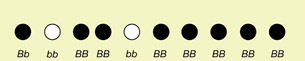
Imagine that each mouse can throw its two alleles for coat colour into a basket—this is the gene pool of the population.
The gene pool can be described in three ways:
- by its genotype frequencies
- by its phenotype frequencies
- by its allele frequencies
Frequency is measured by dividing the number of a particular subgroup by the total group. The symbol f indicates frequency. The following examples show how to calculate genotype, phenotype, and allele frequency in the population for these field mice.
Genotype Frequency: How common is each genotype in the population?
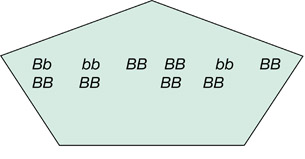
Note: The shorthand f(BB) will be used to replace the long-hand "frequency of the BB genotype.”
Phenotype Frequency: How common is each phenotype in the population?
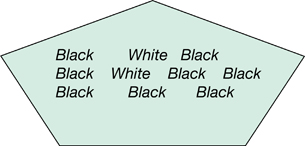
Note: The shorthand f(Black) will be used to replace the long-hand “frequency of the brown phenotype.”
Allele Frequency: How common is each allele in the population?
Note: The shorthand f(B) will be used to replace the long-hand “frequency of the B allele.” Remember that there are ten individuals, so there are 20 alleles in total.
For population geneticists, the most useful way to describe a gene pool is by its allele frequencies. Do you know why?
 Self-Check
SC 1. In a population of ten mice, suppose three have the homozygous dominant genotoype, two are heterozygotes, and five have the homozygous recessive genotoype. What is the frequency of each genotype in the population? What is the frequency of the dominant and recessive alleles?
Self-Check Answers
SC 1.
Genotype Frequencies
3/10 mice are AA, so f(AA) = 0.3.
2/10 mice are Aa, so f(Aa) = 0.2.
5/10 mice are aa, so f(aa) = 0.5.
Allele Frequencies
(Reminder: Ten mice have two alleles each, so there are a total of 20 alleles in the gene pool.)
3 mice are AA, so they have 6 A alleles.
2 mice are Aa, so they have 2 A alleles and 2 a alleles.
5 mice are aa, so they have 10 a alleles.
1.5. Page 3
Module 8—Populations, Individuals, and Gene Pools
 Module 8: Lesson 1 Assignment
Retrieve the copy of the Module 8: Lesson 1 Assignment that you saved to your computer earlier in this lesson. Complete Part A. Save the completed assignment in your course folder. You will receive instructions later in this lesson about when to complete Part B and when to submit your assignment to your teacher.
Hardy-Weinberg Equilibrium (HWE)
In the Amish population, the recessive allele for polydactyly is much more common than in other North American populations. One wonders whether the allele for polydactyly will increase in North American populations and why. Do the frequencies of alleles stay the same generation after generation in a population, or can they change?
Consider any population that has two different alleles for one gene—for example, A and a. It would seem logical that if each breeding couple in a population removes two alleles from the gene pool in order to reproduce and then returns them to the gene pool in the form of offspring, the relative frequencies of each allele in a gene pool should not change from generation to generation. In other words, the population should stay in equilibrium.
© A74.FR Ben Fontaine/3339382/Fotolia
Godfrey Hardy and Wilhelm Weinberg are famous for making just that observation: allele frequencies should stay the same generation after generation—a situation they called Hardy-Weinberg equilibrium. Hardy and Weinberg realized that this can only hold true if certain conditions exist.
Conditions Necessary to Maintain Hardy-Weinberg Equilibrium
- The population must be closed. In other words, there can be no immigration of individuals (and alleles) into the population or emigration of individuals (and alleles) out of the population. In other words, there must be no gene flow. Natural and artificial barriers (mountain ranges, highways, canyons, large bodies of water, urbanization, clear-cutting) prevent organisms from mixing and adding to or removing their genes from a population’s gene pool.
- The population must be large enough that chance events will not alter the frequencies. (Missing one penny out of five is a much bigger event statistically than missing one penny out of a thousand.)
- There must be random mating (no picking favourite phenotypes or genotypes as mates). Although most complex animals go through some sort of mating ritual that allows them to select a certain kind of mate, simple organisms like bacteria, fungi, or wind- and water-pollinated plants are examples of those where mates are not selected.
- There can be no net mutations. There are always mutations, but the mutation rate from B to b must be equal to the mutation rate from b to B in order to stay in HWE.
- There can be no natural selection. The environment cannot favour the survival of one phenotype over the other.
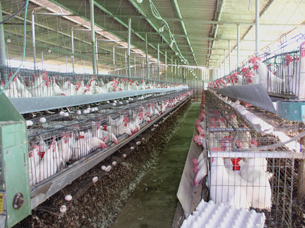
So, which populations are in Hardy-Weinberg equilibrium? If you look carefully at the list of conditions for HWE above, you can see it would be difficult, if not impossible, to think of a natural population that meets all these conditions. The photo of the chicken barn above depicts a population in HWE.
If HWE is just a hypothetical situation, why are we interested in these five conditions that lead to HWE? We use HWE as a test to see if populations are undergoing change. If any of the five conditions listed do not exist, then the population is undergoing genetic change, or microevolution, and the relative frequencies of the alleles must be changing. Microevolution, or a change in allele frequencies, can’t result in new species all by itself, but it can change the genetic characteristics of a population substantially as one allele becomes increasingly common.
Hardy-Weinberg Equilibrium: a principle that states that allele frequencies in a population will remain the same over time as long as the population is large, there is no gene flow, natural selection is not occurring, there is no change in mutation rate, and no mate selection is occuring
If allele frequencies do change, it indicates that microevolution is occurring in the population.
gene flow: movement of alleles into or out of a population by immigration or emigration
natural selection: the process by which organisms with heritable traits survive in a particular environment, passing on their successful traits to the next generation
Those selected have greater reproductive fitness that either increases fertility or decreases mortality.
microevolution: a change in the frequency of alleles in the gene pool that results in a change in the characteristics of the population; does not result in a new species
 Read
Read
To review these concepts, read “Introducing the Hardy-Weinberg Principle” on pages 680 to 682 of your textbook. You may wish to make summary notes or include some example problems and their solutions in your course folder.
 Watch and Listen
To review and summarize the information of this lesson, watch “The Hardy-Weinberg Principle: Minding Your p's and q's.” Although you may wish to watch the entire video for interesting examples, pay particular attention to the following sections:
- “Population and Gene Pools”
- “Population Genetics”
- “Bio Review: Calculations”
- “Bio Simulation: Allele Frequency”
 Try This
TR 1. Identify two kinds of populations that would exhibit the five conditions of HWE.
TR 2. Look at question 4 on page 700 of the textbook. Note that 11% of the Canadian population is lactose intolerant. Would this be the same in other countries? Why?
1.6. Page 4
Module 8—Populations, Individuals, and Gene Pools
 Reflect on the Big Picture
© Joss/281349/Fotolia
© Lianem/8912279/Fotolia

© khz/648576/Fotolia
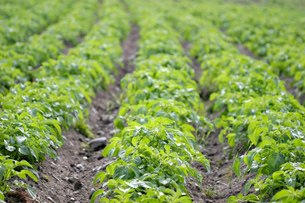
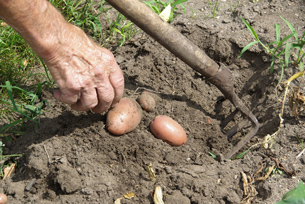
How important is allele variation in a population? Agriculture today represents a major departure from the early attempts of our ancestors at gathering local plants to provide scarce carbohydrates, vitamins, minerals, and medicines. A great variety of local herbs, roots, and berries were required to provide all the nutrients needed for survival, and early farming depended on the existence of many varieties that were suitable to the different habitats that existed. Today, the industrial monoculture farm uses the opposite practice by growing one particular variety of one species on a massive, economically efficient scale. For example, of the hundreds of varieties of potatoes that used to be grown on Earth, the vast majority grown today are of a few varieties that meet the massive consumer demand for a potato suitable for making French fries.
Wheat, rice, and livestock are raised in the same way—consumers demand a consistent product, resulting in a monoculture. The result is that genes for unprofitable varieties have, in many cases, disappeared.
If industrial-scale monoculture efficiently provides human populations with food, then perhaps it isn’t a problem. Apply your understanding of Unit C and your work in this lesson to reflect on the following questions:
- What would happen if the effects of climate change or the emergence of new plant diseases affected some of the crop?
- Would the entire crop and our food supply be affected because of the lack of variants that could survive the new threats?
- Do enough varieties of organisms still exist that their population could survive in a changed environment?
 Self-Check
SC 2. A population of 20 deer was introduced to an island where no deer had previously lived. Although there were several bucks (males of breeding age), one was much larger and stronger and was able to fight off the other bucks. The large buck was able to breed with the ten or so females in the breeding population. This same scenario repeated itself for three years in a row. Is this population in Hardy-Weinberg equilibrium? Why?
SC 3. State a reason why the following populations might NOT be in Hardy-Weinberg equilibrium.
- populations growing within range of radiation from the 1986 Chernobyl nuclear accident in Ukraine
- A mixed population of hooked-beaked and straight-beaked birds inhabited an island. With falling sea levels, a small group of birds were able to establish a colony on a nearby island. Almost all of those birds were, coincidentally, straight-beaked.
- Poplar trees are typically wind pollinated. In the absence of wind during flowering, many of the ovules are fertilized by pollen from the same flower.
- Evening scented stocks are flowers that give off a beautiful fragrance towards nightfall. Some flowers are more fragrant than others and attract more bees.
- In very strong winds, poplar pollen from very distant populations can be brought in and end up pollinating local plants.
Self-Check Answers
SC 2. No, it is not.
- The population is small.
- There is mate selection, not random mating.
- There is natural selection in that the strongest, largest deer (the most adapted) gets to breed and pass on his genes.
SC 3.
- change in mutation rate
- small population
- non-random mating
- natural selection
- open population (gene flow)
 Module 8: Lesson 1 Assignment
Retrieve the copy of the Module 8: Lesson 1 Assignment that you saved to your computer earlier in this lesson. Complete Part B. Save your completed assignment in your course folder. Submit your completed Module 8: Lesson 1 Assignment to your teacher for assessment.
1.7. Page 5
Module 8—Populations, Individuals, and Gene Pools
 Lesson Summary
In Lesson 1 you investigated the following focusing questions:
- How do biologists quantitatively describe the composition of a population’s gene pool?
- What are the five conditions of the Hardy-Weinberg principle that affect frequency of alleles in a population’s gene pool, resulting in microevolution?
- What happens when conditions of the Hardy-Weinberg principle are not met?
A gene pool is described by how common each allele is in the population. The term used is frequency, and it is calculated by counting the number of the recessive or dominant alleles in the gene pool and dividing that number by the total number of alleles. When calculating frequencies, it is important to remember that each individual in the population carries two alleles.
When gene pool allele frequencies remain the same over time, the population is in Hardy-Weinberg equilibrium. Conditions needed for HWE are
- a closed population
- a large population
- no net change in mutation rate
- random mating
- no natural selection
If these conditions aren’t met, allele frequencies will change and, by definition, the population will evolve. Therefore, the conditions for evolution are
- an open population (gene flow)
- a small population (genetic drift)
- change in mutation rate
- non-random mating
- natural selection
Lesson Glossary
Consult the glossary in the textbook for other definitions that you may need to complete your work.
frequency: number/total
gene flow: movement of alleles into or out of a population by immigration or emigration
Hardy-Weinberg Equilibrium: a principle that states that allele frequencies in a population will remain the same over time as long as the population is large, there is no gene flow, natural selection is not occurring, there is no change in mutation rate, and no mate selection is occuring
If allele frequencies do change, it indicates that microevolution is occurring in the population.
microevolution: a change in the frequency of alleles in the gene pool that results in a change in the characteristics of the population; does not result in a new species
natural selection: the process by which organisms with heritable traits survive in a particular environment, passing on their successful traits to the next generation
Those selected have greater reproductive fitness that either increases fertility or decreases mortality.
population: organisms of a particular species in a particular place at a particular time
1.8. Lesson 2
Module 8—Populations, Individuals and Gene Pools
Lesson 2—Causes of Change in the Gene Pool
© Melissa Schalke/496028/ Fotolia
 Get Focused
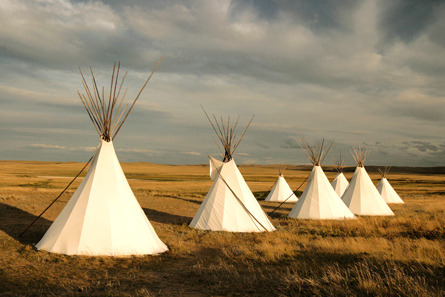
The human population living on the Canadian prairies thousands of years ago was very different from the human population living on the prairies today. The Aboriginal populations that lived in those times were genetically adapted to an extreme hunter-gatherer existence that meant they could survive in some of the world’s harshest conditions. Their genes provided them with physical adaptations to deal with their environment. Their genes also played a part in the development of traditional knowledge and skills and the social cohesion necessary for group support and defence. In this harshly competitive environment, those without the alleles needed for survival did not live to pass on their genes.
Today, a similar snapshot of a Canadian prairie population would look quite different for obvious reasons. Human technology and immigration from all over the world have played their parts in changing the face of the population.
The gene pools of all natural populations change over time, regardless of whether the population is animal, plant, fungal, or microbial. Gene pool change (microevolution) shows adaptation—a positive thing when you consider that the alternative is extinction.
You will investigate the following focusing question:
- What factors cause changes in the diversity of gene pool composition?
 Module 8: Lesson 2 Assignment
Download a copy of the Module 8: Lesson 2 Assignment to your computer now. You will receive further instructions on how to complete this assignment later in the lesson.
You must decide what to do with the questions that are not marked by the teacher.
Remember that these questions provide you with the practice and feedback that you need to successfully complete this course. You should respond to all of the questions and place those answers in your course folder.
Remember that you also have the option of trying additional questions from the textbook for further practice. Consult with your teacher for the answers to these questions. The Key will also provide you with many Diploma Exam style multiple-choice, numerical-response, and written-response questions that will be an excellent review of the module. Practising your responses to these types of questions is good preparation for the Diploma Exam.
1.9. Page 2
Module 8—Populations, Individuals and Gene Pools
 Explore
© ClimberJAK/13948057/ Fotolia
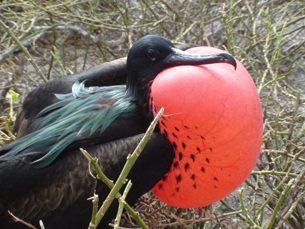
The male great frigate bird in the photo is demonstrating a courtship ritual that makes it clear that he is available for breeding and would be an excellent choice for a discriminating female seeking a mate.
His ability to advertise by puffing out his brightly coloured chest is probably due to a dominant allele. Assume that the frequency of this allele is 0.5—that is, it makes up half the gene pool in this particular population. Reflect on the factors that could increase the frequency of this allele in the gene pool.
Because microevolution is simply a change in the frequency of alleles, there are five factors that lead to population change and microevolution:
- an open population with gene flow in and out through immigration and emigration
A lack of natural geographic barriers, such as mountain ranges, or barriers due to human intervention, such as highways, allow organisms to flow in and out of populations. When organisms move, they can bring with them new or different allele combinations, resulting in changes in allele frequencies. Organisms that swim or fly may have an advantage in gene flow.
genetic drift: a change in allele frequencies caused by chance events in a small gene pool, such as inbreeding caused by isolation of a small non-representative group or a few non-breeding individuals (bachelors)
Founder effect and bottleneck effect are examples of genetic drift.
founder effect: a type of genetic drift that occurs when a small population that is not representative of the main population migrates away
Allele frequencies of the two groups will be dissimilar.
bottleneck effect: a type of genetic drift similar to the founder effect; occurs when a natural disaster thins the population to a small group that happens to be unrepresentative of the original group
Allele frequencies of the two groups will be dissimilar.
- a small population whose frequencies can be greatly affected by chance events (genetic drift)
Small and isolated populations suffer from inbreeding, where members become more alike as the frequency of one allele increases over the other. Isolated, inbred populations are prone to rapid evolutionary change as a result. Chance events, such as a situation where one individual or group doesn’t breed at all, can have major effects in tiny populations, changing allele frequencies drastically and causing microevolution of the gene pool. This situation is found in the founder effect and the bottleneck effect.
- mate selection (non-random mating)
Most complex animals spend a lot of energy going through mating rituals and courtship displays designed to attract a certain phenotype of mate. The traits that attracted a mate will then appear in the next generation, increasing the frequency of the successful alleles. However, many organisms don’t select mates. Simple organisms like protists or wind- and water-pollinated plants are examples of organisms that mate randomly.
- changes in mutation rates (Random mutations of DNA can cause B alleles to become b, and vice versa.)
If the rate of mutation from one to the other is the same, no change in frequency occurs. If, for some reason, the rate is different, the frequency of alleles changes and microevolution occurs.
- natural selection: In a given environment, individuals with certain phenotypes, and certain alleles, are more likely to survive and produce many offspring.
The gene pool of the offspring generation will have a higher frequency of these successful alleles as a result. A phenotype that is naturally selected either increases fecundity (the number of offspring) or decreases mortality.
mate selection (non-random mating): the process of choosing mates based on the presence of certain traits or phenotypes and, thus, genotypes
Traits are usually displayed in some form of courtship ritual.
fecundity: fertility
mortality: death; may be due to kill-off (predation) or die-off (disease, starvation, or exposure)
When environmental change happens, another phenotype becomes desirable, and adaptation occurs as allele frequencies shift. However, if the initial population has little variation and does not have any members that show the new desired phenotype, the population may become extinct. Evolution from one form to another can only occur if the new form is present in the initial population.
These are the five mechanisms by which population change or microevolution occurs. Notice that they are the exact opposite of the five conditions for Hardy-Weinberg equilibrium.
 Read
Read
Read “The Causes of Gene Pool Change” on pages 689 to 696 of your textbook to understand these processes. You may wish to make summary notes or a chart of the ideas presented.
 Watch and Listen
To review and summarize the information of this lesson, watch “Gene frequencies, Natural Selection, and Speciation: The Burgess Ghosts.” Although you may wish to watch the entire video for review, pay particular attention to the following sections:
- “Bio Simulation: Hardy-Weinberg Principle”
- “Bio Reports: Mechanisms for Evolution”
- “Mechanisms and Rate of Speciation”
 Self-Check
SC 1. Compare and contrast the following terms.
- the founder effect and the bottleneck effect
- natural selection and genetic drift
- non-random mating and natural selection
Self-Check Answers
SC 1.
- The founder effect is a change in allele frequencies due to the separation or migration of a small population that is not genetically representative of the original population. The bottleneck effect is similar in that the new population is not representative, but the separation is due to a catastrophe, leaving few survivors.
- Natural selection causes changes in allele frequencies, as does genetic drift. In natural selection, the environmental conditions cause increased survival of suitable genotypes versus unsuitable genotypes. In genetic drift, the allele frequency changes because the original population has been fragmented.
- Mate selection refers to sexual selection where one phenotype may attract more mates, increasing the allele frequencies for the desired trait(s). This is similar to natural selection in that those with a given phenotype are being selected. In natural selection, it is the environment that selects; in mate selection, it is the mate that selects.
 Try This
TR 1. Answer question 19 on page 701 of the textbook. Provide an example of an advantage to the heterozygote condition.
TR 2. Provide three examples of impediments to gene flow that are also geographical barriers.
TR 3. The bottleneck effect can occur after a natural disaster. Give three examples of a natural disaster that could result in this type of genetic drift.
TR 4. “Launch Lab: Pick Your Plumage” on page 677 in the textbook allows you to select mate phenotypes/genotypes of sage grouse during their mating displays and see the results. Pick out three characteristics that the female may be using to select the best mate. Remember that mate selection is a cause of gene pool change (microevolution).
TR 5. Wildlife preserves can be notorious for causing genetic drift due to inbreeding in their small, isolated populations. Suggest at least one method wildlife managers could use to prevent the negative effects of genetic drift and lost biodiversity in wildlife preserves.
1.10. Page 3
Module 8—Populations, Individuals and Gene Pools
 Reflect and Connect
This lesson has examined some historical examples of gene pool change. Are there current examples?
The human immunodeficiency virus (HIV) causes acquired immune deficiency syndrome (AIDS), which is fatal without treatment. However, not all people infected with HIV go on to develop AIDS. Scientists have discovered that the gene that codes for a cell receptor for HIV has a recessive allele that makes the receptor non-functional. This means that people who are homozygous for this recessive allele will not develop AIDS even though they are infected with HIV. Population geneticists are wondering what will happen to the frequency of this recessive allele in the future. The Lesson 2 Assignment will investigate this question.
Before you begin the Module 8: Lesson 2 assignment, you may wish to answer the “Review” questions on page 697.
 Module 8: Lesson 2 Assignment
Retrieve the copy of the Module 8: Lesson 2 Assignment that you saved to your computer earlier in this lesson. Complete the assignment. Save your completed assignment in your course folder. You will receive instructions later in this lesson on when to submit your assignment to your teacher.
© Ryan Jaime/10082931/ Fotolia.com
 Discuss
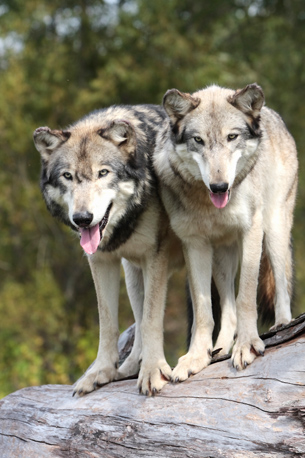
When populations become small, much of the variation in the gene pool is lost, which makes them more susceptible to extinction if the environment changes. The grey wolf suffered such a fate and nearly disappeared from Montana’s Glacier National Park.
With the guidance of your teacher, and working with fellow students in groups, prepare discussion material for a debate regarding the advantages and disadvantages of introducing the grey wolf back into Montana’s Glacier National Park. Half of the class should take the role of local community members and ranchers; the other half should take the role of wildlife managers and proponents of wildlife. Prepare your positions by listing each of the arguments you will make. For each argument, list what you expect your opponent to counter with. Have a rebuttal ready for each of the anticipated opposing arguments. Your teacher may choose to carry out the debate in class or by using the discussion board tool. You may choose to do a web search to research the topic or use other sources. More information on the grey wolf plight is found in “Figure 19.10” on page 691 of your textbook.
 Self-Check
SC 2. Which gene pool would most likely demonstrate microevolution?
- a breeding population of 3000 white swans on Slave Lake
- a forest population of red deer after the 1986 Chernobyl nuclear accident in Ukraine
- a population of mule deer that includes some that have recently joined the population after fleeing from widespread forest fires in central BC
- a small population of Acacia trees isolated on an island by rising ocean levels
SC 3. Which correctly matches a term to its description?
- gene flow: a chance change in allele frequencies when small populations become isolated
- natural selection: a particular phenotype of mate is more often chosen, changing the frequency of the alleles in the gene pool
- change in mutation rate: several new alleles arise by mutation or a change in the rate of mutation from B to b and b to B
- genetic drift: chance changes in allele frequencies that occur in small populations
Self-Check Answers
SC 2.
- This does not demonstrate microevolution because the population is quite large and chance changes due to small populations (genetic drift) are unlikely to be a factor. This population will tend to favour equilibrium.
- This population would likely show microevolution, but not necessarily. Nuclear contamination will certainly increase mutation rates, but if mutation from one allele to the other is equal, then allele frequencies may not change substantially. If mutation occurs more in one direction, microevolution will occur.
- Deer entering the population are immigrants and are participating in gene flow. If the immigrants are coincidentally different in phenotype/genotype than the original population, then allele frequencies will change, and microevolution will occur.
- The isolation of this tiny breeding population will likely cause a change in allele frequencies if the isolated population happens to be coincidentally slightly different in allele frequency than the original population. Also, if the rising water levels make a different set of environmental conditions on the island, then those individuals naturally selected on this island may be different from those that are naturally selected in the mainland population.
SC 3. Answers c and d are correct.
Answer a describes genetic drift, not gene flow.
Answer b describes non-random mating or mate-selection, not natural selection.
Module 8: Lesson 2 Assignment
Submit your completed Module 8: Lesson 2 Assignment to your teacher for assessment.
1.11. Page 4
Module 8—Populations, Individuals and Gene Pools
 Lesson Summary
This lesson focused on the following question:
- What factors cause changes in the diversity of gene pool composition?
Gene pools are said to be changing when the frequency of the dominant and recessive alleles are changing. Another term meaning “gene pool change” is microevolution. Microevolution will occur if any of the following are taking place in the population:
- genetic drift: chance changes in allele frequencies due to small populations
Genetic drift typically decreases variation in a population. The founder effect and bottleneck effects are examples of genetic drift.
- natural selection: Organisms with certain phenotypes/genotypes have a selective advantage over others in a particular environment. Natural selection typically decreases diversity, especially in very competitive environments because one phenotype is much more successful and produces more young, passing on the favoured allele(s). Heterozygotes typically have the same advantage as the homozygous dominant genotype, unless there is a heterozygote advantage.
- change in mutation rates: a change in allele frequencies caused by a greater rate of mutation from one allele to the other
Changes in mutation rates typically decrease variation in a population. Mutations resulting in new alleles will increase variation.
- non-random mating (mate selection): choosing mates based on their phenotypes
These observable traits are usually displayed for prospective mates during formal courtship rituals. As a result, one allele is preferred over the other, which, after mating, translates to an increase in that allele in the offspring produced from that mating. Mate selection typically reduces variation in a population.
- gene flow: Immigration and emigration increase diversity within populations, but decrease diversity/variation between populations.
If one allele becomes heavily favoured over the other, then there is a loss of variation in the population. In general, the more variation there is in a population gene pool, the better the population’s chances of surviving when environmental conditions change. Without plenty of variation in the gene pool, rapid environmental change commonly results in extinction.
Lesson Glossary
Consult the glossary in the textbook for other definitions that you may need to complete your work.
bottleneck effect: a type of genetic drift similar to the founder effect; occurs when a natural disaster thins the population to a small group that happens to be unrepresentative of the original group
Allele frequencies of the two groups will be dissimilar.
fecundity: fertility
founder effect: a type of genetic drift that occurs when a small population that is not representative of the main population migrates away
Allele frequencies of the two groups will be dissimilar.
genetic drift: a change in allele frequencies caused by chance events in a small gene pool, such as inbreeding caused by isolation of a small non-representative group or a few non-breeding individuals (bachelors)
Founder effect and bottleneck effect are examples of genetic drift.
mate selection (non-random mating): the process of choosing mates based on the presence of certain traits or phenotypes and, thus, genotypes
Traits are usually displayed in some form of courtship ritual.
mortality: death; may be due to kill-off (predation) or die-off (disease, starvation, or exposure)
1.12. Lesson 3
Module 8—Populations, Individuals, and Gene Pools
Lesson 3—Hardy-Weinberg Calculations
© Vyacheslav Osokin/9330657/Fotolia
 Get Focused
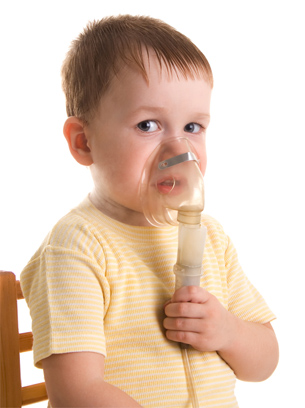
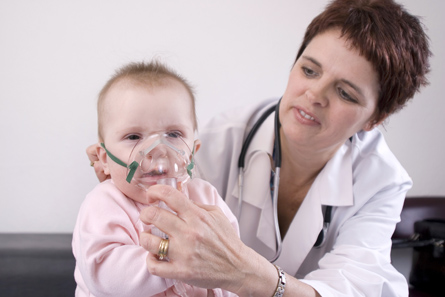
Cystic fibrosis, or CF, is an inherited autosomal recessive disease where the body produces abnormally thick, sticky mucus in the lungs, leading to difficulty breathing, respiratory infections, and failure to grow and thrive. Thick mucus blocks the ducts of the pancreas so fat-digesting enzymes cannot reach the intestine, leading to poor weight gain and inability to absorb fat-soluble vitamins.
CF is caused by a mutant allele of the CFTR gene. Those with the disease have inherited two copies of the mutant allele, one from each parent. CF occurs once in every 2500 Caucasian births. In the past, victims of CF did not live long enough to reproduce. With intensive therapy, lung transplants, and medication, those with CF are now living long enough to have babies and pass on the CF allele. For people with CF, in 1969, the median age of survival in North America was 14 years; in 2005, it was 36 years. Although this is great news for people with CF and for their families, population geneticists are interested in what this means for the frequency of the CF allele and the incidence of the disease in future populations.
We know that one in 2500 Canadians are born with CF (are homozygous recessive) and one in 25 carry the gene (are heterozygous). It would be interesting to know what the frequency of the recessive CF allele is relative to the normal dominant allele. Can we calculate these frequencies? Furthermore, can we find out if these frequencies are changing with the improved survival of CF patients? The answer is found in the Hardy-Weinberg principle.
In this lesson the following focusing questions will be examined:
- How can the Hardy-Weinberg equation, involving allele and genotype frequencies in populations, graphs, and population data, be used to study changes in population over time?
- How do we analyze and interpret this data to make predictions and decisions about population management?
frequency: how common something is; usually expressed as a decimal percentage; e.g., an incidence of “2 in 5” gives the same information as a frequency of 0.4 or 40%
Hardy-Weinberg equation: an equation used to determine the frequency of genotypes: p2 + 2pq + q2 = 1, where p = frequency of the dominant allele and q = frequency of the recessive allele
If the frequency of genotypes is known, the equation can be used to work backwards to find the frequency of alleles in the gene pool.
 Module 8: Lesson 3 Assignment
Download a copy of Module 8: Lesson 3 Assignment to your computer now. Part 2 of the assignment involves a study of the action of natural selection and the Hardy-Weinberg conditions. You will also do some eating, so you might want to read the assignment now to select your “materials” for the lab. You will receive further instructions on how to complete this assignment later in the lesson.
In addition to your lesson work, any summary notes, sample calculations, diagrams, charts, or tables should be stored in the course folder for your teacher’s feedback and as study notes to help you prepare for exams.
You must decide what to do with the questions that are not marked by the teacher. Remember that these questions provide you with the practice and feedback that you need to successfully complete this course. You should respond to all of the questions and place those answers in your course folder.
Remember you also have the option of trying additional questions from the textbook for further practice. Consult with your teacher for the answers to these questions. The Key will also provide you with many diploma exam-style multiple-choice, numerical-response, and written-response questions that will be an excellent review of the module. Practising your responses to these types of questions is good preparation for the diploma exam.
1.13. Page 2
Module 8—Populations, Individuals, and Gene Pools
 Explore
The Hardy-Weinberg Equation
In addition to describing the conditions for equilibrium and microevolution, Hardy and Weinberg developed an equation that determines the frequency of alleles in a population and the frequencies of each genotype. For the following explanation, assume that one gene has two alleles: the dominant allele is A, the recessive is a.
Symbols Used in the Hardy-Weinberg Equation
The symbol f will be used as a short form of the word frequency.
Because A and a together make up all the alleles in the gene pool, p + q = 1, or 100%.
If you know the allele frequencies of a gene pool, you can predict the frequency of each genotype in the population by using the following Hardy-Weinberg equation. Or, if you know even some of the genotype frequencies, you can use some simple algebra to find both the allele frequencies and the remaining genotype frequencies.
p2 + 2pq + q2 = 1, where
p2 = the frequency of the homozygous genotype in the population = f(AA)
2pq = the frequency of the heterozygous genotype in the population = f(Aa)
q2 = the frequency of the homozygous recessive genotype in the population = f(aa)
Because the three genotypes together make up the whole population, p2 + 2pq + q2 = 1.
Some tips for doing Hardy-Weinberg calculations are provided below.
- Don’t get psyched out because this is math—the hardest thing you have to do is use the calculator to find the square of a number or a square root.
- Remember that an “individual” is diploid, so it has two symbols: AA or Aa or aa. An allele is only one symbol: A or a. If you’re asked to find a genotype frequency, it’s either p2, 2pq, or q2. If you’re asked to find an allele frequency, it’s either p or q. For example, “68% of bears in this population have the recessive phenotype of black fur” is q2, not q.
- Remember that those individuals who have the dominant phenotype include both homozygous dominants (AA) and heterozygotes (Aa). So, if 40% of the population has the dominant phenotype, then p2 + 2pq = 0.4, not p2 = 0.4.
- Remember that p + q = 1 or p2 + 2pq + q2 = 1. So, if you don’t know q, just subtract: 1 – p to get q. If you only know p2 + 2pq, but you don’t know q2, just subtract: 1 – (p2 + 2pq) = q2.
 Read
Read
Read carefully through “Sample Problems” 1 and 2 on pages 682 and 683 of the textbook, and work out the problems yourself using a calculator, pen, and paper.
1.14. Page 3
Module 8—Populations, Individuals, and Gene Pools
 Read
Read
Read pages 681 to 685 of your textbook to review these concepts and calculations. It can be challenging, but practising problem solving will ensure your mastery of this material. Answer the questions on page 683 of your textbook and discuss your work with your teacher.
 Watch and Listen
You have viewed parts of the following videos in the previous lessons in this unit. You may wish to view all of these videos as a review or concentrate on the sections listed:
- Gene Frequencies, Natural Selection and Speciation: “The Burgess Ghosts”
- The Hardy-Weinberg Principle: “Minding Your p’s and q’s”
Remember that your success in this concept depends on your ability to successfully solve problems. Practice is essential to mastery.
 Self-Check
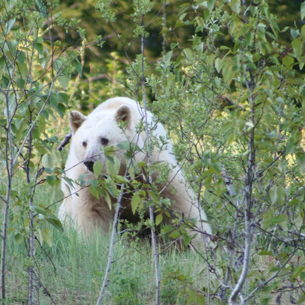
© Roberta Taylor
The “Spirit Bear” or Kermode bear is a pure white mutant of the American black bear that is found on Princess Royal Island off the central BC coast. First Nations all along the coast believe in the special powers of the bear and hold it in high regard. The following problems study the frequency of the normal dark allele and the recessive white allele. For the purposes of these problems assume A is the allele for black fur and a is the allele for white fur.
For each of the four Self-Check questions, first decide which of the following Hardy-Weinberg symbols you’ve been given in the question. Then, decide which symbol you want to find. Then, use p + q = 1 and p2 + 2pq + q2 = 1 to solve for your answer.
p q p2 2pq q2
f(A) f(a) f(AA) f(Aa) f(aa)
SC 1. If 45 of 75 bears in a local Princess Royal Island population have the recessive phenotype of white fur, what is the frequency of the recessive allele in the bear’s gene pool?
SC 2. What percentage of the population of bears are heterozygotes?
SC 3. How many bears are pure-breeding for the black phenotype?
SC 4. If ten years ago, only 24 of 77 bears were white, has microevolution occurred? Justify your answer.
Self-Check Answers
SC 1.
Given
The population of bears with the recessive phenotype is 45/75 or 0.6; therefore, these bears have the genotype of aa. The frequency of aa or f(aa) is symbolized by q2, so you’re given q2 = 0.6.
Required
The frequency of the recessive allele, or f(a), so you want to find q.
Solution
Find the square root of q2 to get q = 0.77.
Answer
q = 0.77
If the questions had asked for the % frequency, your answer would be that 77% of the alleles in the gene pool are recessive.
SC 2.
Given
The population of bears with the recessive phenotype is 45/75 or 0.6; therefore, these bears have the genotype of aa. So, you’re given q2 = 0.6.
Required
the percentage of bears of the heterozygous genotype (Aa) in the population, so you want 2pq
Solution
Square root q2 to get q. (q = 0.77)
p + q = 1, so 1 − q = p (p = 0.23)
2pq = 2(0.23)(0.77) = 0.35
Answer
The percentage of bears in this population that are heterozygotes is 35%.
SC 3.
Given
The population of bears with the recessive phenotype is 45/75 or 0.6; therefore, these bears have the genotype of aa. q2 = f(aa) So, you’re given q2 = 0.6.
Required
frequency of bears that are pure-breeding for the black phenotype, or f(AA), so you want p2
Solution
The square root of q2 gives you q.
q = 0.77
p + q = 1, so 1 − q = p
p = 0.23
p2 = f(AA) = 0.05
Answer
0.05
If the questions had asked for % frequency, then 5% of the 75 bears are pure-breeding for black hair. Therefore, 6 of the 75 bears are pure-breeding for black fur.
SC 4. By definition, microevolution has occurred if the allele frequencies (p and q) have changed, so you have to find p and q for these two dates and compare them.
Given
bears with white fur ten years ago = f(aa) or q2 = 24/77 = 0.31
Required
the frequency of the allele for white fur ten years ago = q
Solution
q2 = 0.31
q = 0.56
q ten years ago = 0.56
question 3 told us that q now = 0.77
Answer
Yes, microevolution has definitely occurred because the frequency of the allele for white fur has increased from 0.56 to 0.77.
1.15. Page 4
Module 8—Populations, Individuals, and Gene Pools
 Reflect and Connect
© Lisa Eastman/6050238/Fotolia
It is possible to determine the characteristics of the Canadian cystic fibrosis gene pool. The incidence of CF in Canada is 1/2500 people, so
- f(aa) = q2 = 0.0004
- the frequency of the recessive CF allele f(a) = q = 0.02
- the frequency of the dominant normal allele (1 − q) = p = 0.98
- the frequency of the homozygous dominant genotype p2 = 0.96
- the frequency of heterozygotes (carriers) f(Aa) = 2pq = 0.039
The data tells us that 98% of the alleles in the Canadian gene pool are normal and 2% are CF alleles. About 4% of the population are carriers of the CF gene. Data is not available to determine how frequencies have changed since medical technologies made it possible for CF patients to live long enough to reproduce, but we can certainly guess that the frequency of the CF allele has risen and microevolution is occurring. Of the five possible reasons for this evolution, natural selection is the closest explanation. But is it nature that’s selecting or the environment created by humans and our technology? This is called artificial selection. Although artificial selection is grouped with natural selection as a cause of evolution, there is debate as to whether or not it is a cause of evolution.
Before submitting your Module 8: Lesson 3 Assignment, you may wish to review pages 678 to 688 of your textbook, which is the section on the Hardy-Weinberg principle. Your teacher may suggest questions, other than questions 1, 2, 3, and 8, from page 688 that you could use as review. Consult with your teacher for answers to the questions that you decide to complete.
 Module 8: Lesson 3 Assignment
Go to the Module 8: Lesson 3 Assignment that you saved to your computer at the start of this lesson. Complete Part 1.
When you've finished Part 1, complete Lesson 3: Lab. All of your answers to the lab go in Part 2 of the Lesson 3 Assignment.
Submit your completed Module 8: Lesson 3 Assignment to your teacher for assessment
1.16. Page 5
Module 8—Populations, Individuals, and Gene Pools
 Lesson Summary
This lesson focused on the following questions:
- How can the Hardy-Weinberg equation, involving allele and genotype frequencies in populations, graphs, and population data, be used to study changes in population over time?
- How do we analyze and interpret this data to make predictions and decisions about population management?
The Hardy-Weinberg equation is a tool that is used to determine if genetic change (microevolution) is actually occurring in a population.
- p represents the frequency (number/total) of the dominant allele in the gene pool.
- q represents the frequency of the recessive allele in the gene pool.
- p + q = 1 because the dominant alleles plus the recessive alleles make up the whole gene pool.
- p2 represents the frequency of the homozygous dominant genotype in the population = f(AA).
- 2pq represents the frequency of the heterozygous genotype = f(Aa).
- q2 represents the frequency of the homozygous recessive genotype = f(aa).
- p2 + 2pq + q2 = 1 because f(AA) + f(Aa) + f(aa) = all the individuals of the population.
Lesson Glossary
Consult the glossary in the textbook for other definitions that you may need to complete your work.
frequency: how common something is; usually expressed as a decimal percentage; e.g., an incidence of “2 in 5” gives the same information as a frequency of 0.4 or 40%
Hardy-Weinberg equation: an equation used to determine the frequency of genotypes: p2 + 2pq + q2 = 1, where p = frequency of the dominant allele and q = frequency of the recessive allele
If the frequency of genotypes is known, the equation can be used to work backwards to find the frequency of alleles in the gene pool.
1.17. Lesson 4
Module 8—Populations, Individuals, and Gene Pools
Lesson 4—Human Activity, Biotechnology, and Gene Pools

© Yuri Arcurs/1247529/Fotolia
 Get Focused
A specialized brain, an opposable thumb, and the capacity for speech are a winning combination that have allowed humans to change the world. The technologies humans have developed to meet our need for food, shelter, and safety seem to be limitless. Our species has thrived, and, with the use of technology, our habitat has extended into the farthest reaches of the globe. We are, however, becoming increasingly concerned about the intended and unintended consequences of our gain. Do practices and technologies that make life easier for us make life harder for the natural populations around us?
Increasingly, we are becoming aware that we are not separate from ecological communities that surround us. When we affect our environment, we affect our own survival. However, the same specialized human brains and dexterous opposable thumbs that produced technologies that may have harmed natural systems can be used to create technologies that restore balance and create a sustainable Earth.
Biotechnologies have the capacity to do a great deal of good, but the issues are complex. In this lesson you will study examples of human activities and technologies that were developed with good intentions, but that had unforeseen consequences.
In this lesson the following focusing question will be examined:
- What are the intended and unintended consequences of human activities and scientific and technological developments on gene pools?
 Module 8: Lesson 4 Assignment
Download a copy of the Module 8: Lesson 4 Assignment to your computer now. You will receive further instructions on how to complete this assignment later in the lesson.
Any summary notes should be stored in the course folder for study as you prepare for exams.
You must decide what to do with the questions that are not marked by the teacher.
Remember that these questions provide you with the practice and feedback that you need to successfully complete this course. You should respond to all of the questions and place those answers in your course folder. Remember, you also have the option of trying additional questions from the textbook for further practice. Consult with your teacher for the answers to these questions. The Key will also provide you with many diploma exam-style multiple-choice, numerical-response, and written-response questions that will be an excellent review of the module. Practising your responses to these types of questions is good preparation for the diploma exam.
1.18. Page 2
Module 8—Populations, Individuals, and Gene Pools
 Explore
The term double-edged sword is used to describe something that has two opposite effects. Many human technologies are double-edged swords in that they have positive and negative effects. As you read the section below and the assigned readings, consider how you, as a member of society, can evaluate the usefulness of these technologies. Consider the advantages and disadvantages of each from ethical, legal, economic, societal, and scientific or technological perspectives. Try to decide if the benefits of the intended consequences are worth the risks of the unintended consequences.
-
Antibiotic resistance: Not many people think of bacteria as natural populations, but bacteria certainly qualify. Bacteria are among the oldest and most successful populations on the planet. Antibiotics, which kill bacteria, were the wonder drugs of the last century—cutting mortality in humans and livestock dramatically. Although antibiotics have only been used in the past 100 years, many humans are hosts to superbug bacterial populations that are resistant to antibiotics. How did this happen? The theory of natural selection tells us that bacterial populations are composed of variants that are sensitive to antibiotics and variants that are resistant. With each successive generation of antibiotic use, those bacteria that were sensitive to the antibiotic were destroyed, leaving those variants that were resistant.
antibiotic resistance: the ineffectiveness of an antibiotic that results if a bacterial cell has alleles that make it resistant to being destroyed by antibiotics
Each dose of antibiotics will allow these bacteria to survive and pass on their resistant traits to the next generation—more of each generation are resistant until the resistant allele is the most common; at this point, the antibiotic is no longer effective.
Knowing how natural selection works, could we have predicted this unintended consequence of antibiotic use? What does widespread antibiotic resistance mean for our ability to control disease in the future? Remember to evaluate the usefulness of antibiotics and the advantages and disadvantages from ethical, legal, economic, societal, and scientific or technological perspectives.

© dinostock/6320879/Fotolia
-
Biotechnology: Square, frost-proof tomatoes? Bacteria that make human insulin? Goats that secrete cancer-fighting human interferon in their milk? As you discovered in Unit C, biotechnology, which is the manipulation of genes to benefit humanity, can be as simple and low-tech as artificial selective-breeding programs that produce bigger crop yields and livestock. Or biotechnology can be as complex as the use of recombinant DNA techniques to insert desirable genes from one species into another, producing transgenic organisms. The intended use of these technologies was to make organisms with combinations of traits that would make them more profitable for the producer and more desirable to you, the consumer. The unintended consequences are complicated.
biotechnology: manipulation of genes or traits
transgenic organism: an organism that has genes from more than one species
As you evaluate these technologies, consider what happens when genes introduced into one species jump to another species. Do corporations have the right to patent and own genes or, for that matter, recombinant organisms? Is the benefit of increased profit and the promise of more convenient food to feed a hungry planet worth the risk of altering the course of evolution?
-
monoculture: the cultivation of a single cropShrinking gene pools: Cloning techniques allow scientists to make exact genetic copies of organisms. The agriculture industry clones plants and livestock to produce genetically uniform products with qualities consumers want. Pharmaceutical industries clone organisms that can cheaply produce expensive drugs. Monoculture is a related practice of growing vast expanses of a single crop with the exclusion of varieties that aren’t commercially profitable. You can probably predict what happens when genetic variation is removed from a population—the entire population can be wiped out by the same bacterium, pest, parasite, or environmental challenge. Unless conditions are kept optimal, the whole population is at risk. Fragile, cloned, and monocultured crops and livestock are protected with heavy use of antibiotics, pesticides, and fungicides, which have harmful health effects when they find their way into our bodies—the price we pay for a perfect and abundant food supply.
-
invasive species: species that are introduced to an area and that out-compete the indigenous species in its trophic level for nutrients and/or prey; are less affected by limiting density-dependent andIntroduction of foreign invasive species: When it comes to colonization of new territories, human history is riddled with stories of good intentions gone wrong. As a local example, wild boars have recently been proclaimed as pests in central Alberta. Boars are large, furry, wild pigs that were brought from Europe to satisfy a growing Canadian market for boar meat. The animals are being raised on farms as domestic livestock. However, traditional fencing is no match for boars, and they have escaped in large numbers, eating crops and sometimes menacing livestock or people. They have few predators because of their size (and tusks!) and have acclimated nicely to Alberta's climate, breeding in the wild at an impressive rate. Do an Internet search using the keywords “Alberta wild boars” to learn more about wild boars. Or you may wish to research other examples, such as the introduction of rabbits into Australia or purple loosestrife into Alberta.
density-independent factors
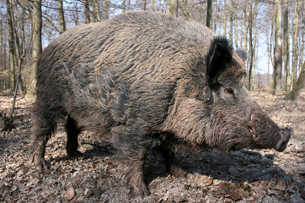
© Panton/13683114/Fotolia
 Read
Read
To further understand the impact of human activity and explore classic examples of intended and unintended consequences of human activity on gene pools, read “Human Activities and Genetic Diversity” on pages 695 to 696 of the textbook.
 Watch and Listen
To review these concepts, try the “Evolution: Mutation and Selection” gizmo. Your teacher may need to provide you with a password.
 Self-Check
SC 1. Complete questions 1, 2, and 3 from “Thought Lab 19.2: Maintaining Genetic Diversity in the Whooping Crane” on page 696 of the textbook.
Self-Check Answers
SC 1.
- Reduced genetic diversity is one hypothesis. The near extinction of the whopping crane was due to loss of habitat, excessive hunting, avian disease, and lead poisoning. All of these factors would likely favour one allele over the other, thus reducing variation in the gene pool. This could also be an an example of the bottleneck or founder effect in which the population could go through a population-crashing event, such as a natural catastrophe or emigration. The small, isolated population that continues would show inbreeding and, therefore, genetic drift, which reduces diversity in the population.
- The fact that pairs bond for life is a problem for whooping crane captive breeding programs. If only one of the cranes that make up a pair is captured, the other will not mate, so its alleles are essentially removed from the gene pool. If one mate dies while in captivity or becomes incapable of breeding, then the other member of the pair will not breed. In this case, the alleles of both cranes are removed from the gene pool.
- If it is found that the whooping crane population is very similar genetically, this is detrimental to survival for the species. With more genetic variation in a population, there is a greater chance that at least some birds will have characteristics that allow them to survive environmental change.
 Try This
Livestock Genetics
TR 1. Is it desirable to farmers that livestock populations remain in Hardy-Weinberg equilibrium? Explain.
TR 2. Are small, genetically similar populations of livestock likely to experience the negative effects of inbreeding and genetic drift? Why or why not?
Self-Check
SC 2. Read pages 695 to 696, “Human Activities and Genetic Diversity,” in order to complete this question.
List four human activities that have had consequences for gene pools of natural populations. State how each has affected genetic diversity in a target population. State whether the effect was intended or unintended.
| Human Activity | Effect on Genetic Diversity | Intended or Unintended Effect |
Self-Check Answers
SC 2. The following are possible answers. There may be others.
| Human Activity | Effect on Genetic Diversity | Intended or Unintended Effect |
fencing of land bordering highways |
decreased due to reduced gene flow/habitat fragmentation |
unintended |
conversion of forest to agriculture |
decreased due to strong selection pressure in destroyed habitat |
unintended |
over-hunting |
decreased due to selection of specific phenotypes and reduced population |
unintended |
creation of wildlife corridors across highways |
increased due to restored gene flow |
intended |
wildlife corridor: a route used by wildlife to move from one territory to another
Wildlife corridors are often part of a migratory pattern.
To review Lessons 1 to 4, you may want to review pages 678 to 699 of the textbook. In this section it is important to be able to understand and to apply the Hardy-Weinberg principle and to complete calculations based on data. Review and practice are essential to success. The questions on page 700 to 701 of the textbook provide an excellent review of Lessons 1 to 4. Your teacher can advise you as to which questions will suit your needs. Your teacher will also provide solutions to these questions.
 Module 8: Lesson 4 Assignment
Through your reading in the textbook and through the questions proposed in this lesson, you should now have a good understanding of how the actions of humans have implications for other populations.
Retrieve your copy of Module 8: Lesson 4 Assignment that you saved to your computer earlier in this lesson. Complete the assignment. Save a copy of your completed assignment in your course folder. Submit your completed Module 8: Lesson 4 Assignment to your teacher for assessment.
1.19. Page 3
Module 8—Populations, Individuals, and Gene Pools
 Lesson Summary
This lesson focused on the following question:
- What are the intended and unintended consequences of human activities and scientific and technological developments on gene pools?
Technologies developed to meet human needs often have consequences for the gene pools of natural populations—some intended and some not intended.
Intended Consequences
- Effective technologies (e.g., medical, pharmaceutical, surgical) increase survival of people with genetic diseases.
- Transfer of desirable genes into crops and livestock using recombinant DNA techniques improves yields and profitability.
- Crops and livestock are cloned to create a uniform and economically profitable food or drug product.
- Monoculture produces vast quantities of food efficiently.
- Cloning of endangered or possibly extinct organisms is done to preserve rare alleles from extinction.
- Creation of wildlife corridors across highways or through industrial and urban development increases gene flow and maintains diversity in populations.
- Creation of wildlife preserves allows threatened species and their alleles to avoid extinction.
- Introduction of foreign species can be used as a biological method of killing pests.
Unintended Consequences
- Use of antibiotics selects for resistant alleles. Bacterial populations become immune to antibiotics.
- Agriculture, dam construction, road building, urban sprawl, logging, and industrialization result in habitat destruction and fragmentation, leading to rapid selection of one form, reducing genetic diversity.
- Technologies (e.g., medical, scientific) that increase survival of people with genetic diseases increase the frequency of disease alleles in the population.
- Monoculture of very few varieties means that alleles for many varieties are lost from the gene pool—the species becomes less adaptable in the face of disease, pests, or environmental change. Monocultured crops use huge quantities of petrochemicals, fertilizers, pesticides, herbicides, and fungicides with human health costs.
- Over-hunting and poaching can threaten extinction and reduce diversity by removing “desirable” alleles from the gene pool; e.g., the biggest and strongest animals are valued most by hunters. Weakened gene pools result.
- Creation of wildlife preserves can lead to genetic drift if either the founder or the bottleneck effect is in play. Wildlife preserves lead to inbreeding, which can also result in genetic drift reducing diversity and causing the population to be less adaptable if the environment changes.
- Genes introduced into crops and livestock by biotechnology can “jump” to wild species, changing the gene pool substantially. For example, the gene for herbicide resistance could jump from corn to weed species.
- When a foreign species is introduced, it often out-competes native species in its trophic level, which disrupts food chains and ecosystems.
Lesson Glossary
Consult the glossary in the textbook for other definitions that you may need to complete your work.
antibiotic resistance: the ineffectiveness of an antibiotic that results if a bacterial cell has alleles that make it resistant to being destroyed by antibiotics
Each dose of antibiotics will allow these bacteria to survive and pass on their resistant traits to the next generation—more of each generation are resistant until the resistant allele is the most common; at this point, the antibiotic is no longer effective.
biotechnology: manipulation of genes or traits
invasive species: species that are introduced to an area and that out-compete the indigenous species in its trophic level for nutrients and/or prey; are less affected by limiting density-dependent and density-independent factors
monoculture: the cultivation of a single crop
transgenic organism: an organism that has genes from more than one species
wildlife corridor: a route used by wildlife to move from one territory to another
Wildlife corridors are often part of a migratory pattern.
1.20. Lesson 5
Module 8—Populations, Individuals, and Gene Pools
Lesson 5: Species Interactions and Symbiotic Relationships
 Get Focused
left: © Pavol Kmeto/2741524/Fotolia; right: © Red/5164739/Fotolia
If you had to compete against your friends to find food in the wild, how do you think you would do? Which of your phenotypes, and therefore alleles, would give you the advantage? As food became more scarce, would the selection for those alleles become stronger or weaker? Often, the ability to survive competition within a species is due to several phenotypes acting together to make a more fit individual. This could include a combination of better eyesight, faster reflexes, and the intelligence to learn from previous mistakes—to say nothing of patience. What if you had to compete against another predator species for the same food? Could you catch more fish than a bear? Could you defend yourself from a bear just to get the opportunity to fish? If no predators were present, would the fish population suffer in any way from the absence of predators?
This lesson will look at the relationships that exist between individuals of different species. Some relationships are positive for both species. In other relationships between species, the outcome is fatal for one individual. In most cases, the result can be positive for that individual’s population as a whole.
In this lesson the following focusing questions will be examined:
- What relationships exist between species and ecosystems?
- What effect do these interactions have on population changes?
 Module 8: Lesson 5 Assignment
Download a copy of the Module 8: Lesson 5 Assignment to your computer now. You will receive further instructions on how to complete this assignment later in the lesson.
In addition to your lesson work, any summary notes, diagrams, charts, or tables should be stored in the course folder for your teacher’s feedback and study as you prepare for exams.
The other questions in this lesson are not marked by the teacher; however, you should still answer these questions. The Self-Check and Try This questions are placed in this lesson to help you review important information and build key concepts that may be applied in future lessons.
After a discussion with your teacher, you must decide what to do with the questions that are not part of your assignment. For example, you may decide to submit to your teacher the responses to Try This questions that are not marked. You should record the answers to all of the questions in this lesson and place those answers in your course folder.
Remember, you also have the option of trying additional questions from the textbook for further practice. Consult with your teacher for the answers to these questions. The Key will also provide you with many diploma exam-style multiple-choice, numerical-response, and written-response questions that will be an excellent review of the module. Practising your responses to these types of questions is good preparation for the Diploma Exam.
1.21. Page 2
Module 8—Populations, Individuals, and Gene Pools
 Explore
© Catabu/925214/Fotolia
What is meant when it is said that two organisms have a “relationship” in a biological community? It might be tempting to say that, like human relationships, ecological relationships can be “good” or “bad.” However, all relationships must be positive in some way or, through the evolutionary process, the relationship would have led to species extinction.
The ladybug—a major predator in the insect world—is the archenemy of aphids. Aphids are parasites that suck the nectar, the sugary juice that runs through phloem tubes, from plants. Aphids benefit at the expense of the host plant. If the infestation of aphids is severe enough, the host plant will weaken and may die.
You may think of the ladybug as a simple predator preying on the aphids; however, by eating the aphids, the ladybug is also protecting the plant. In return, the plant indirectly provides the ladybug with a steady supply of food. This is an example of mutualism, a relationship in which both organisms benefit.
Reflect on the relationship between humans and the ladybug. People benefit when a ladybug protects food crops from aphids, but humans do nothing to harm or benefit the ladybug in return. This is an example of commensalism.
parasite: the organism in a symbiotic relationship that benefits by living on or in another organism (host) as a source of food or means of reproduction
The host is harmed in this relationship.
host: the organism in a type of symbiotic relationship that provides food or a means to complete reproduction for the parasitic organism of another type of species
mutualism: a type of symbiosis involving two organisms of different species in which both benefit or depend on the relationship to survive
commensalism: a type of symbiosis in which one species benefits and the other is not affected one way or another
symbiotic relationship: any close relationship in which individuals of different species live together in a feeding or protective relationship
predator-prey: a relationship in which one organism (predator) hunts and kills another organism (prey) for food
The example involving a crop plant, aphids, ladybugs, and humans demonstrates all three kinds of symbiotic relationships that can bring species together for life.
The relationship between predator and prey is complex. Although the relationship does not sound particularly positive for the prey organism, predators do perform a service for the prey population. Recall the cheetah in the Big Picture section of this module. As a predator, the cheetah is much more likely to kill the old, weak, sick, and young simply because it is easier for the cheetah to catch those kinds of animals. By selecting poorly adapted individuals or individuals with inferior alleles, predators improve the genetic stock of the prey population. Because superior prey contribute to the development of superior predators, prey and predators co-evolve. The predator-prey population cycles described under the heading “Producer-Consumer Interactions” on pages 719 to 723 of your textbook show how intimately the two populations control one another.
 Read
Read
Read from the beginning of “Section 20.2” to “Succession: Community Change over Time” on pages 717 to 725 of the textbook. You might create a table to record terms, definitions, and examples as a way to summarize this material for your course folder.
 Watch and Listen
As you watch the video “Interactions and Relationships Among Organisms: 'The Intricate Web of Life,'” you will see many excellent examples of the relationships that shape the interactions of organisms in nature. You may wish to supplement your notes as you consider these questions:
- What happens when human activity, such as habitat destruction, results in the removal of a partner from a mutualistic or commensal relationship? How many species are affected?
- What happens if a parasite is too successful? How does the parasite limit its own survival?
- How can existing relationships in nature be used as technologies to serve human needs (e.g., introducing ladybugs into crops as a biological control mechanism)?
- How does competition between members of a species during times of scarcity act to improve the species’ gene pool?
- What happens when human activity removes predators from ecosystems? How does the gene pool of the prey species change?
- What relationship exists between humans and the thousands of plant and fungal species used to make medicine?
 Self-Check
SC 1. Both human hunters and animal predators keep prey populations in check, but human hunters tend to have a negative effect on the prey gene pool, whereas animal predators have a positive effect. Write a comparative explanation of why this is the case.
SC 2. Create a chart like the following and fill in the empty boxes using examples that you read on pages 712 to 725 of the textbook.
Example |
Relationship |
Population That Increases |
Population That Decreases |
Population That Remains Stable |
| commensalism | ||||
| tapeworm and human | ||||
| plant species that produces root toxins that kill plants of the same species nearby | ||||
| interspecific competition | ||||
| predator/prey | ||||
Acacia tree and stinging ants of Latin America |
||||
| viceroy and monarch butterflies |
Self-Check Answers
SC 1. Hunters tend to kill the biggest and most genetically fit organisms in the population. These animals should be breeding to improve the genetic composition of their population. When these animals are killed, the remaining gene pool is weaker.
SC 2.
Example |
Relationship |
Population That Increases |
Population That Decreases |
Population That Remains Stable |
| Remora fish waiting near the mouth of the shark for scraps | commensalism | Remora | shark | |
| tapeworm and human | parasitism | tapeworm | ||
| plant species that produces root toxins that kill plants of the same species nearby | interspecific competition | toxin-producing species | other species | |
| coyote and hawk | interspecific competition | either | either | |
coyote and mouse |
predator/prey | coyote | mouse | |
Acacia tree and stinging ants of Latin America |
mutualism | both | ||
| viceroy and monarch butterflies | mimicry | both |
1.22. Page 3
Module 8—Populations, Individuals, and Gene Pools
 Try This
Refer to the predator-prey cycle graph in “Figure 20.12” on page 721 of the textbook to answer these questions.
TR 1. If there were no legend with this graph, how would you know which line represents predator and which line represents prey? Hint: Which would always have the highest numbers? (Think about food pyramids.)
TR 2. How long would it take for an excess of prey to translate to an excess of predators? (Remember that high food supply expresses itself as more babies. Remember also that the gestation period for most predators is many months, so the young are born the following season.) What is the length of the lynx-hare cycle in years?
 Reflect and Connect
You have examined many types of living relationships in this lesson. These relationships involve individuals living together so that at least one member benefits. As you reflect on the types of relationships you have studied, consider the unique human relationship of the hunter and the gene pool of the hunter’s prey described in the following Discussion section.
 Discuss
In the Try This questions above you identified how some hunting practices may adversely affect the quality of a prey species’ gene pool. Prepare at least two suggestions of how hunting regulations could be modified to correct this problem. An Internet search of Alberta hunting regulations will give you some background into what aspects of hunting are controlled. Post your work on the discussion board, and comment on the suggestions of other students. Summarize the best ideas of the group and put the summary in your course folder.
 Module 8: Lesson 5 Assignment
In the assignment for Module 8: Lesson 5 you will examine several examples of living relationships and answer a series of questions on each scenario. Complete the Module 8: Lesson 5 Assignment now.
Submit your completed Module 8: Lesson 5 Assignment to your teacher for assessment.
1.23. Page 4
Module 8—Populations, Individuals, and Gene Pools
 Lesson Summary
This lesson focused on the following questions:
- What relationships exist between species and ecosystems?
- What effects do these interactions have on population changes?
Relationships between organisms occur when an organism’s struggle for survival is affected by another organism. In some cases, alliances form that benefit both species; in some, the success of one species is, by definition, the death of the other. The relationships of interest in this lesson are the three kinds of symbiosis: parasitism, commensalism, and mutualism.
A symbiotic relationship ties two specific species together for life, usually in a feeding relationship. In mutualism, the relationship is positive for both species. In commensalism, one species benefits and the other species is unaffected. In parasitism, one member of the pair benefits while the other is harmed.
Another important relationship is that of predator and prey. Predator and prey population cycles keep each other at the carrying capacity of the environment: high prey numbers produce more predators that eat more prey, reducing prey densities back to normal. Predators improve the prey gene pool by hunting down the sick, the weak, and the poorly adapted, sieving out the poor alleles and leaving a stronger, more genetically fit prey population. Most human hunters weaken prey gene pools by killing the superior members of the population, eliminating the best alleles from the population. In predator-prey population cycles, there is always more prey than predators, and the numbers of predators follow the trend of the prey species.
Lesson Glossary
Consult the glossary in the textbook for other definitions that you may need to complete your work.
commensalism: a type of symbiosis in which one species benefits and the other is not affected one way or another
host: the organism in a type of symbiotic relationship that provides food or a means to complete reproduction for the parasitic organism of another type of species
mutualism: a type of symbiosis involving two organisms of different species in which both benefit or depend on the relationship to survive
parasite: the organism in a symbiotic relationship that benefits by living on or in another organism (host) as a source of food or means of reproduction
The host is harmed in this relationship.
predator-prey: a relationship in which one organism (predator) hunts and kills another organism (prey) for food
symbiotic relationship: any close relationship in which individuals of different species live together in a feeding or protective relationship
1.24. Lesson 6
Module 8—Populations, Individuals, and Gene Pools
Lesson 6—Role of Defence
 Get Focused
© Paul Zizka/2930492/fotolia
If you were to spend a weekend hiking through the backcountry of Banff National Park, you’d probably see pika, mountain goat, elk, and perhaps a grizzly bear as it makes its way across the alpine meadow. Sometimes it is difficult to remember that each species you see is a winner—a species that has out-competed all others that have attempted to share its niche. What defensive traits have made these species winners in their environment?
niche: a position or role taken by an organism within its community

© Baudot/shutterstock
The grizzly bear’s structural defences are easy to spot: its massive size, its powerful claws, and the presence of huge sharp teeth, are all obvious. Behavioural defences, like standing up on hind legs, bristling of hair to make it appear larger, baring of teeth, growling, laying back of ears, and mock-charging, all indicate danger to would-be competitors or predators. What other kinds of defences do organisms use to protect themselves (and their alleles) from elimination by competition or predation?
In this lesson the following focusing question will be examined:
- What are the defence mechanisms within predation and competition?
 Module 8: Lesson 6 Assignment
Download a copy of the Module 8: Lesson 6 Assignment to your computer now. You will receive further instructions on how to complete this assignment later in the lesson.
In addition to your lesson work, any summary notes, diagrams, charts, or tables should be stored in the course folder for your teacher’s feedback and study as you prepare for exams.
The other questions and activities in this lesson are not marked by the teacher; however, you should still attempt all of the work offered here. These questions are designed to help you review important information and build key concepts that may be applied in future lessons.
After a discussion with your teacher, you must decide what to do with the questions that are not part of your assignment. For example, you may decide to submit to your teacher the responses to “Try This” questions that are not marked. Regardless of what you submit, you should record the answers to all the questions in this lesson and place those answers in your course folder.
Remember, you also have the option of trying additional questions from the textbook for further practice. Consult with your teacher for the answers to these questions. The Key will also provide you with many Diploma Exam-style multiple-choice, numerical-response, and written-response questions that will be an excellent review of the module. Practising your responses to these types of questions is good preparation for the Diploma Exam.
1.25. Page 2
Module 8—Populations, Individuals, and Gene Pools
 Explore
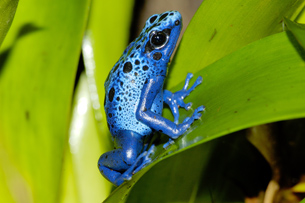
© Greg/575933/Fotolia
The frog in the photo has a wonderful array of weaponry to protect itself from the many snakes that surround it. Its bright colour acts as a warning flag to predators. If eaten, the toxin in its skin and blood will poison its predator in minutes. Its sticky, finger-like digits attach to anything, allowing it to easily escape predators or catch a meal.
Although you may be familiar with the defences animals have evolved, you probably don’t often think of plants as having structural defences, other than obvious spines or thorns. However, like snakes and insects that produce venom, a lot of producers have also evolved chemical defences against consumers. Some plants produce chemical toxins that can poison herbivores who feed on them. For example, Delphinium glaucum, a beautiful, tall, purple-flowered spike often seen in gardens, grows naturally on pasture land in the foothills of southern Alberta. This plant is responsible for the death of much livestock and wildlife every year.
Most poisonous substances and medically active drugs are extracted from plants, acting as reminders that these compounds are present to discourage consumers from eating them. The antibiotics extracted from plants and fungi are there to protect the plant from bacterial infection. Perhaps the best way to avoid being eaten is simply to taste terrible or, like a skunk, to smell terrible.
The strategy works as long as the consumer has a good sense of taste and smell, and a good memory. The roots of some plants secrete toxins that inhibit the growth of neighbouring plants. This mechansism reduces interspecific and intraspecific competition for water, minerals, and light. Similarly, when wolves, bears, or dogs mark their territory with their urine, they are warding off competition for food and mates—the chemical compounds in their urine giving clear warning that this territory has been claimed.
structural defences: physical parts of the organism that either protect the organism from being consumed or allow the organism to compete better for scarce resources
chemical defences: toxic, bad-tasting, or bad-smelling chemicals secreted by an organism that either discourage consumers from eating it, poison consumers, or prevent competitors from growing or living nearby
interspecific competition: when members of two different species compete for scarce resources and survival; competition only occurs when there are too many organisms and not enough resources
intraspecific competition: when members of the same species compete against each other for scarce resources and survival; causes microevolution because one phenotype or allele will have better survival than another.
The scarcer the resources, the more extreme the competition and the faster microevolution occurs.
behavioural defences: actions and gestures that are meant to communicate that the organism is dangerous and should be avoided or is harmless and not threatening
protective colouration: bright colours that give clear warning to potential attackers
cryptic colouration (camouflage): colours or patterns that allow an organism to blend into its environment and avoid being seen
mimicry: when a harmless organism has the same bright colouration of an organism that has protective colouration
Behavioural defences are fascinating. Think of the arched back of a cat to create a large, threatening silhouette; a bear standing on its hind legs, or a dog or wolf with its hair standing on end. Sometimes aggression is not the best policy: adopting submissive behaviours (belly up, tail down, no eye contact) might be a better strategy for avoiding attack.
Protective colouration provides a selective advantage when bright colours signal clear warnings to would-be predators or herbivores. By looking dangerous, an organism can scare off predators. Cryptic colouration or camouflage is the opposite of protective colouration. Blending with the surroundings allows prey organisms to hide from predators or allows predators to sneak up on prey.
These defence mechanisms become important when an organism is competing with others in its own species (intraspecific competition) to escape from predators or to attack prey. Because most structural, chemical, and behavioural defensive traits are coded in genes, those members of the population who outlive the rest of their group are naturally selected to pass the successful alleles for these genes to the next generation.
Similarly, when two species with similar niches (e.g., coyote and wolf) are undergoing interspecific competition for scarce prey, it is their species-specific defence mechanisms that will determine whether it is coyote or wolf that is squeezed out of the niche. If the organism can outwit or outlive its competitors in its own species long enough to reproduce, then the alleles for those winning traits appear in the next generations. The alleles of the losers do not appear in future generations; if selection is strong enough, these alleles may be lost from the gene pool forever.
It is worth emphasizing that when food and habitat are plentiful, an organism doesn’t need to be particularly “talented” in defending itself or finding food. But, when resources are scarce, intraspecific competition starts and allele selection and microevolution occur. Sometimes the variation between members of the population is not even visible; however, when scarcity becomes extreme, even the tiniest structural, chemical, or behavioural advantage can make the difference between survival and death.
Those that have the alleles that provide an advantage will live to reproduce, changing the population’s allele frequencies and bringing about gene pool change or microevolution. In the same way, competition between organisms from different species in the same habitat, competing in the same trophic level, is not a problem as long as food and other resources are plentiful—both competitors can co-exist nicely. However, when scarcity occurs (e.g., due to drought, severe winters, disease, or overcrowding) interspecific competition will result in a winner and a loser, and competitive exclusion occurs.
 Read
Read
You may wish to review “Interspecific Competition” on pages 718 to 719, and “Defenses Against Consumers” on pages 722 to 723 in the textbook. A chart with terms, definitions, and examples is a good method of adding this information to your course folder.
 Try This
Read the following two statements. Although both of these indicate chemical defences, what is the difference between the two strategies?
- Some species of plants produce toxins that prevent the plants from being eaten by herbivores.
- Some species of plants secrete chemicals into the ground that prevent other plants of its own species from growing near it.
 Self-Check
Describe the following as being either: (a) chemical defence, (b) cryptic colouration, (c) protective colouration, or (d) mimicry.
- When elephants begin to eat the leaves of the thorn tree, the tree releases a bitter-tasting substance into the leaves, which prevents elephants from consuming the whole tree.
- The beautiful red, blue, and yellow tree frogs of Costa Rica produce some of the most poisonous venoms of the natural world.
- The dusty, golden-brown coyote is difficult to spot against the dry grasses of the prairie.
- A harmless sea snake has almost the identical bright markings as the highly venomous coral snake.
Self-Check Answers
- a
- c
- b
- d
 Module 8: Lesson 6 Assignment
Your Module 8: Lesson 6 Assignment is a practical investigation of plant competition—both intraspecific and interspecific. The assignment follows “Investigation 20.A: Interspecific and Intraspecific Competition Among Seedlings” on page 720 of your textbook. The purpose is to learn what happens when many individuals are trying to survive with the scarce or limited resources (growing conditions) that you will create.
Part 1 of the investigation is helpful in allowing you to see how slight, and perhaps invisible, variations between members of the same species allow one member to compete and survive better than its neighbours. It is a simple experiment in natural selection, where only those variants of the species that have the genes it takes to compete effectively will survive to pass on those genes. In Part 2 you will look at competition between members of different species for the scarce resources offered in the growing pot. You will see how one species is perhaps genetically far better adapted to compete under the particular growing conditions you have set.
Retrieve the copy of the assignment that you saved to your computer earlier in this lesson. Complete the assignment. When you finish, be sure to save your work in your course folder and submit your assignment to your teacher.
1.26. Page 3
Module 8—Populations, Individuals, and Gene Pools
 Lesson Summary
In Lesson 6 you focused on answering the following question:
- What are the defence mechanisms within predation and competition?
All species rely on defences of some kind to increase their chances of survival. Defences can take the following forms:
- structural characteristics (e.g., thorns, claws)
- chemical characteristics (e.g., plant toxins, venoms)
- behaviours (e.g., territoriality, roaring)
- colouration (e.g., protective colouration, mimicry, and cryptic colouration)
These defences allow organisms to compete intraspecifically against others in their own species for survival. The best competitors, those with superior defences, will live to pass the genes for these successful defences to the next generation, thereby improving the population’s gene pool.
Interspecific competition occurs when organisms from two different species are both attempting to fill a trophic level. If there is no scarcity, both species may in fact share the niche. However, competition and the defences that allow an organism to compete well, only become important during periods of scarcity. Lack of food, water, space, and other resources means that nature must select a few winners from many competitors, and it is then that gene pool change occurs.
Lesson Glossary
Consult the glossary in the textbook for other definitions that you may need to complete your work.
behavioural defences: actions and gestures that are meant to communicate that the organism is dangerous and should be avoided or is harmless and not threatening
chemical defences: toxic, bad-tasting, or bad-smelling chemicals secreted by an organism that either discourage consumers from eating it, poison consumers, or prevent competitors from growing or living nearby
cryptic colouration (camouflage): colours or patterns that allow an organism to blend into its environment and avoid being seen
interspecific competition: when members of two different species compete for scarce resources and survival; competition only occurs when there are too many organisms and not enough resources
intraspecific competition: when members of the same species compete against each other for scarce resources and survival; causes microevolution because one phenotype or allele will have better survival than another
The scarcer the resources, the more extreme the competition and the faster microevolution occurs.
mimicry: when a harmless organism has the same bright colouration of an organism that has protective colouration
niche: a position or role taken by an organism within its community
protective colouration: bright colours that give clear warning to potential attackers
structural defences: physical parts of the organism that either protect the organism from being consumed or allow the organism to compete better for scarce resources
1.27. Lesson 7
Module 8—Populations, Individuals, and Gene Pools
Lesson 7—Populations and Communities Changing Over Time—Succession
 Get Focused
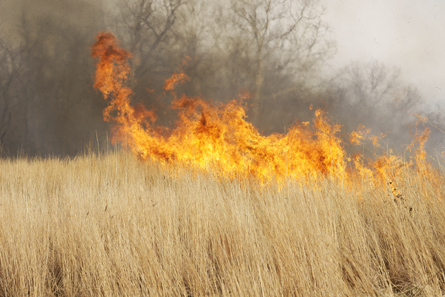
© Bryan Eastham/6764477/Fotolia
Two hundred years ago it was possible to stand on a hill in parts of southern Alberta and see nothing but bison for ten kilometres in any direction. The vast herds were drawn to the verdant grasses that sprang up through the ashes after spring prairie fires. Prairie fires occured when spring lightning storms ignited the dry, yellow, grasses uncovered by melting snow. Fire would sweep across the prairie, returning the nutrients in the grass back to the soil, and clearing away dead matter so that light could germinate the new crop of wild grass seeds.
The bison came by the thousands to feast on the rich, new grass. The Aboriginal people depended on the buffalo to supply them with food and hides that would keep them alive for another year. When the fires of spring didn’t come, the bison stayed away. The indigenous tribes then had to travel to find the herds, or find alternative food sources.
Today, fires are not left to spread uncontrollably, and the wild prairie has been replaced in places by forest. Without fire, wild grasses were replaced by wild roses and thistles, and then wild raspberry bushes. Later, bushes like Saskatoon berry, dogwood, and hazelnut would move in to replace them. Still later, small trees like high-bush cranberry, pin cherry, and chokecherry would take over. Eventually, a forest of large aspen poplars would appear and remain indefinitely until the land was cleared for agriculture, urban development, or industry.
In this lesson the following focusing question will be examined:
- How do communities and their populations change or remain stable over time?
 Module 8: Lesson 7 Assignment
Download a copy of the Module 8: Lesson 7 Assignment to your computer now. You will receive further instructions on how to complete this assignment later in the lesson.
The other questions and activities in this lesson are not marked by the teacher; however, you should still attempt all of the work offered here. These questions are designed to help you review important information and build key concepts that may be applied in future lessons.
Remember, you also have the option of trying additional questions from the textbook for further practice. Consult with your teacher for the answers to these questions. The Key will also provide you with many Diploma Exam-style multiple-choice, numerical-response, and written-response questions that will be an excellent review of the module. Practising your responses to these types of questions is good preparation for the Diploma Exam.
1.28. Page 2
Module 8—Populations, Individuals, and Gene Pools
 Explore
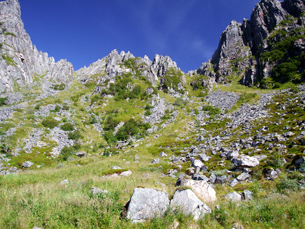
© Marek Slusarczyk/1416110/Fotolia
The changes that a community goes through as it ages are known as succession. For every biome, or microclimate within a biome, there is a predictable, ordered, succession of plant and animal species that will play their parts and then disappear. This is a process that begins with the first pioneer species that invades the soil or rock and continues to the final, stable climax species that represents the completed succession.
Communities are named for their climax species of plant life (e.g., aspen forest or black spruce forest). The photo depicts primary succession after a rockslide destroyed all life in the area. The slow process of making soil through freeze-thaw fracture has allowed the pioneer species of lichens to be replaced with mosses and small plants. This process will eventually result in the rockslide area being returned to the original spruce forest. A secondary succession (e.g., after the clear-cutting of a forest) in this same area would take much less time because the succession would begin from soil and small organisms, rather than rock.
succession: the orderly replacement of one species with another over time; occurs after a disruption, such as fire
pioneer species: the first species of plant to invade a cleared site in a succession
climax species: the last species of plant in the succession; is used to name the succession
primary succession: a succession that begins with bare rock; soil-building organisms (e.g., lichen) are pioneers
secondary succession: a succession that begins with soil
When the producer species change during a succession, the animal species change along with it. In the “Get Focused” section, the grasslands of the prairie would support herbivores (like bison, seed-eaters like mice and gophers) and predators (like hawks and coyotes). If the fires of spring no longer occurred and an aspen forest secondary succession proceeded, bush-browsers and berry-eaters like rabbits, white-tailed deer, and black bear would replace the animals seen early in the succession.
If you were living off the land and needed to hunt or gather to stay alive, would you know what animals are found in which landscapes? This practical knowledge about which animal species go along with which plant species and where to find them is firmly rooted in the traditional knowledge of First Nations peoples.
 Read
Read
To understand the characteristics and types of succession with interesting examples, read “Succession: Community Change over Time” on pages 725 to 726 and page 728 in the textbook. You may find that a chart with terms, definitions, and examples is the best way to summarize this information for your course folder.
 Watch and Listen
For scientists, succession is a challenging phenomenon to study because most succession takes longer than a human lifetime to complete. To understand the characteristics of succession, watch “Succession: Communities in Transition.” The following sections are of particular significance to your study:
- “Bio Probe: Succession in Study Area 1”
- “Biotic versus Abiotic Factors”
- “Bio Bit: Succession”
- “Model of Succession”
- “Change in Communities”
- “Bio Fact: Disturbed Areas”
- “Factors Affecting Succession”
- “Fire as an Agent of Change”
As you view the video, consider the following questions:
- Why do successions occur?
- Why are the earlier species replaced rather than added to by other species?
- Why are the species involved in one succession different than those found in another?
You may wish to supplement the work in your course folder based on the video.
 Module 8: Lesson 7 Assignment
Part 1 of your assignment involves research into clear-cutting versus selective logging practices. Clear-cutting invovles the random removal of vegetation using large machinery. This practice has major consequences for succession, control of runoff, and the disappearance of wildlife associated with the climax forest. Selective logging is more time-consuming and invovles the selection of specific trees to be harvested.
Retrieve your copy of the Module 8: Lesson 7 assignment that you saved to your computer earlier in the lesson. Complete Part 1 and save it to your course folder.
 Try This
To review the types and conditions of succession, complete the following table for your course folder.
As plant species change during a succession, so do the species of animals that live off these producers. With each new producer that appears, new herbivores and carnivores migrate into the area to take advantage of the food source. For example, after a fire, the pioneer species of grass favours seed eaters like mice, gophers, and the hawks that eat them. But, when small shrubs start to appear, browsers like rabbits are likely to replace the mice, gophers, and hawks. This is a typical example of succession in central Alberta.
Complete the chart below by adding the related consumer examples to the stages of succession. This first row has been completed for you. If you need ideas about possible consumers, conduct an Internet search using search phrases such as “Alberta food chains” or “Alberta successions.” Add the chart to your course folder.
| Producer Succession | Consumer Succession |
|---|---|
Grass (pioneer species) |
mice/gophers/hawks |
Low shrubs and berries |
|
High shrubs |
|
Aspen poplar trees (climax community) |
|
1.29. Page 3
Module 8—Populations, Individuals, and Gene Pools
 Self-Check
Succession and Biodiversity
You will recall the significance of biodiversity from Biology 20 and from previous lessons in this module. Consider how succession might affect the amount of biodiversity by completing the following questions.
Use “Figure 20.21” on page 726 of your textbook to answer the following questions.
SC 1. What is the effect of time on biodiversity in a succession? Why does this occur?
SC 2. Why is the number of species that can survive at the beginning of the succession so low?
SC 3. How many years did it take to complete this succession?
SC 4. Which of the following is true of a secondary succession?
- The succession starts from bare rock.
- The pioneer species could be lichen.
- The climax species is the final species.
- The succession could occur after a volcanic event.
SC 5. Which of the following is NOT characteristic of succession?
- Succession is the orderly replacement of one species by another over time.
- Succession occurs when one species changes the environment so that the first species can no longer survive there.
- Succession is a natural process in which communities age.
- Succession occurs when one species out-competes another species for a specific niche.
Self-Check Answers
SC 1. Biodiversity increases rapidly at the beginning of the succession. The slope flattens as the climax community appears. As each species colonizes the area, the accumulation of dead organic matter increases the nutrient- and moisture-holding abilities of the soil and shades seedlings from intense light and heat. Many more species prefer these conditions to the original harsh and barren conditions at the beginning of the succession, so there is more biodiversity.
SC 2. This is a primary succession, meaning it is starting from rock. Soil must be made first through the process of freeze-thaw fracturing of rock and accumulation of organic matter from dead pioneer producers. Conditions are harsh and exposed. Until adequate soil is formed, the number of plant species that can survive will be very low.
SC 3. approximately 150 years.
SC 4. c. The climax species is the final species.
SC 5. d. Succession occurs when one species out-competes another species for a specific niche. .
 Module 8: Lesson 7 Assignment
Alberta’s forests are important for much more than pulp and paper or timber industries. Many Canadian forests are part of Canada’s National Parks or are nature preserves that were made to protect wild organisms from human activity. One of the keys to protecting threatened species is to prevent habitat change, including changes caused by forest fires.
Every summer you hear about the forest fire hazard and updates in the news about where forest fires are burning out of control. Although some fires are set by human carelessness, fires caused by lightning storms combined with hot, dry conditions are a normal part of nature that renews soils and begin the cycle of succession again and again. Unfortunately, forest fires break out without warning when those who can control the spread of fire are ill-prepared to fight it. Some districts have adopted a “controlled burn” policy as the answer to this problem.
Retrieve the Module 8: Lesson 7 Assignment you downloaded earlier. Complete Part 2 of the assignment and save a copy to your course folder. Once completed, you may then submit the assignment to your teacher for assessment.
 Reflect and Connect
In Lessons 5 to 7 you have been examining interactions in ecological communities. You have analyzed the types of living relationships and competition within and between species. You have looked at the characteristics and types of succession. Apply your knowledge to the questions on page 730 of your textbook. Your teacher may suggest particular questions for your review.
1.30. Page 4
Module 8—Populations, Individuals, and Gene Pools
 Lesson Summary
In this lesson the following focusing question was examined:
- How do communities and their populations change or remain stable over time?
Communities change over time in the process of succession. Ecological disturbances (both those caused by humans and natural) can destroy communities and return them to rock or to soil. Primary succession begins from bare rock and may be the result of avalanche, rockslide, or glacial melting. Primary successions take a very long time because of the time needed for building soil. The pioneer species of lichens help in this process.
Secondary succession begins from soil, where life still exists as roots, seeds, and other organisms. It occurs after fire has destroyed a community or when human settlements or agricultural fields are abandoned. In either case, a predictable pattern of invasion and replacement of species will occur, ending in a stable climax community.
The species that make up a particular succession are specific to that climate and geography. The first species to invade is the pioneer species, and the last species is the climax species, which the community is named after. Animal species present change in succession as well; as producer species change, so does the presence of animal species that depend on them.
Lesson Glossary
Consult the glossary in the textbook for other definitions that you may need to complete your work.
climax species: the last species of plant in the succession; is used to name the succession
pioneer species: the first species of plant to invade a cleared site in a succession
primary succession: a succession that begins with bare rock; soil-building organisms (e.g., lichen) are pioneers
secondary succession: a succession that begins with soil
succession: the orderly replacement of one species with another over time; occurs after a disruption, such as fire
1.31. Lesson 8
Module 8—Populations, Individuals, and Gene Pools
Lesson 8—Factors Influencing Growth
 Get Focused
Elk Island Bison
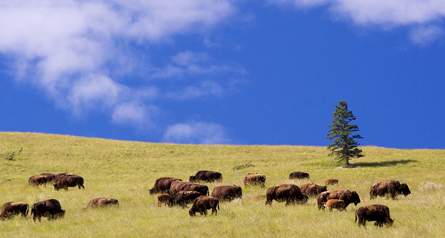
© thepoeticimage/43322/ Fotolia
The bison, which once dominated the plains of Alberta, represent a species that is perfectly adapted to its environment. However, when European settlers discovered that bison hides made beautiful coats and robes, and that there was a huge market for these products in Europe, the bison were hunted until its population size bordered on extinction. To protect the remaining bison from hunters, excessive predation, and disease, reserves such as Elk Island National Park in central Alberta were created as safe havens.
In open populations, individuals are free to roam—they may immigrate or emigrate. What happens when natural populations are enclosed with fences for their own protection so that immigration and emigration are not possible?
While it is true that enclosing the bison allows wildlife managers to monitor the birth and death rates, keep the number of predators at a reasonable level, and monitor for the presence of disease, it also creates problems. In natural populations, individuals come and go, bringing with them “fresh” alleles that keep variation in the population high, prevent inbreeding and genetic drift, and ensure enough variation to protect the population from extinction in the event of environmental change. The wildlife managers of enclosed game parks and conservation reserves have the difficult job of balancing the benefits of maintaining a large population size with the risks of losing genetic diversity.
In this lesson the following focusing questions will be examined:
- What are the factors that influence population size?
- How do these factors influence population change?
 Module 8: Lesson 8 Assignment
Download a copy of the Module 8: Lesson 8 Assignment to your computer now. You will receive further instructions on how to complete this assignment later in the lesson.
Summary notes, diagrams, charts, or tables should be stored in the course folder for your teacher’s feedback and study as you prepare for exams.
The other questions in this lesson are not marked by the teacher; however, you should still answer these questions. The “Self-Check” and “Try This” questions are placed in this lesson to help you review important information and build key concepts that may be applied in future lessons.
After a discussion with your teacher, you must decide what to do with the questions that are not part of your assignment. For example, you may decide to submit to your teacher the responses to “Try This” questions that are not marked. You should record the answers to all of the questions in this lesson and place those answers in your course folder.
Remember, you also have the option of trying additional questions from the textbook for further practice. Consult with your teacher for the answers to these questions. The Key will also provide you with many Diploma Exam-style multiple-choice, numeric-response, and written-response questions that will be an excellent review of the module. Practising your responses to these types of questions is good preparation for the Diploma Exam.
1.32. Page 2
Module 8—Populations, Individuals, and Gene Pools
 Explore
© filtv/6880678/Fotolia
Determining Population Growth
Looking at the rate at which Canada’s natural landscape is being converted to residential housing might convince you that the Canadian population is growing rapidly, but is this true? What factors cause populations to increase, or decrease, in size?
In your social studies curriculum you’ve likely learned that the Canadian population is indeed growing. You know that Canadians are living longer—the rate of death (mortality) has fallen due to good health care, nutrition, and a high standard of living. With a growing Canadian population, you would expect the birth rate (natality) to be high, but your studies have likely shown you that Canadian birth rates are, in fact, quite low. Low birth rates are considered to be an economic problem because, in future years, the size of the work force will not be large enough to maintain a thriving economy—especially with the large number of retiring baby boomers. If birth rates are low, how can the population still be growing?
The answer is immigration. Like all open populations, individuals in Canada come and go—some immigrate to Canada to find work or build a new life while others emigrate to other countries. In Canada there is a strong immigration policy intended to build a work force that has been depleted by low birth rates.
Common descriptors for population studies include the following:
- Population size (N). There are four determiners: births (natality), deaths (mortality), immigration, and emigration.
- Natality and immigration. These increase population size.
- Mortality and emigration. These decrease population size.
- Change in population size or population growth. Consider the formula (DN) = (natality + immigration) – (mortality + emigration)
mortality: number of deaths; due to starvation (competition), predation, or disease
natality: number of births; tends to increase with food supply and decrease with competition
immigration: number of individuals entering the population from outside; can be due to abiotic factors (e.g., escape from fire, drought, flood, climate change) or biotic factors (e.g., increased competition)
emigration: number of individuals that leave the population; due to the same reasons as immigration
 Read
Read
Your study of population growth and interactions will involve math and graphing. Remember that practising these skills is essential to your success. Read from “Population Growth” on page 707 of the textbook to the end of “Carrying Capacity” on page 712 in your textbook. Study the examples carefully and summarize this information for your course folder.
 Self-Check
To get practice in using your formula for population growth (DN), try the following questions and check your work.
SC 1. A breeding flock of trumpeter swans near Grande Prairie is made up of 50 pairs. This year there were 165 live hatchlings, no new birds joined the flock, five animals were shot, and eight did not return this spring from their southern migration.
Determine quantitatively how the population of trumpeter swans has changed.
SC 2.
- ΔN of a hypothetical wild elk population is dropping. Suggest four reasons why this might be the case.
-
population determiners: four factors that change the numbers of individuals in the population: natality, mortality, immigration, and emigrationThe elk habitat referred to in part a was being developed for oil and gas exploration. Biologists observed that elk were unwilling to cross the many secondary roads that were being built to support the petroleum industry. Explain, using the four population determiners, how growth of the elk population would be affected.
 Self-Check Answers
SC 1.
ΔN = (natality + immigration) − (mortality + emigration)
ΔN = (165 + 0) − (5 + 8) = 152
SC 2.
a. DN is population growth.
ΔN = (natality + immigration) – (mortality + emigration). Therefore, the drop in ΔN could be due to the following:
- decreased birth rate
- increased death rate
- decreased immigration
- increased emigration
b. If the elk won’t cross roads, this will interfere with their normal movements to find food, water, and mates, thus decreasing the size of their habitat. Natality will likely fall and mortality will likely rise. Immigration will be prevented (reducing population size), but emigration may also be prevented (increasing population size). If this population usually undergoes a yearly migration to breeding or feeding grounds, then restricting its movement in this way will definitely cause ΔN to drop.
Try This
To practise the concepts you have learned, complete the “4.11 Population Size” drag-and-drop activity. Click on the link, and then select the activity from the menu on the left.
 Reflect and Connect
The goal of wildlife management is to keep the size of wild populations at desirable levels. Wildlife managers protect wildlife populations from external influences and control population size by altering food supply, habitat, density of predators, and prevalence of disease. If population sizes exceed what the habitat can sustain, wildlife managers are responsible for setting hunting “bag” limits. In the Module 8: Lesson 8 Assignment you will look at the job of wildlife management using your knowledge of determiners of population size.
 Module 8: Lesson 8 Assignment
Retrieve your copy of the Module 8: Lesson 8 Assignment that you saved to your computer earlier in this lesson. Complete the assignment. Save your completed assignment in your course folder. Submit your completed Module 8: Lesson 8 Assignment to your teacher for assessment.
1.33. Page 3
Module 8—Populations, Individuals, and Gene Pools
 Lesson Summary
This lesson focused on the following question:
- What are the factors that influence population size?
- How do these factors influence population change?
The four factors that determine population size are termed determining factors and include natality, mortality, immigration, and emigration. Natality and immigration increase population size; mortality and emigration decrease population size. Population size is represented as N.
Change in a population is symbolized as ∆N. The formula for change in population size is ∆N = (natality + immigration) – (mortality + emigration).
The determiners of population size influence population change because immigration and emigration can add or remove alleles from a population. Populations with restricted immigration and emigration, such as game reserves and wildlife parks, will have reduced genetic variability, show more genetic drift, and be less able to survive environmental change.
Lesson Glossary
Consult the glossary in the textbook for other definitions that you may need to complete your work.
emigration: number of individuals that leave the population; due to the same reasons as immigration
immigration: number of individuals entering the population from outside; can be due to abiotic factors (e.g., escape from fire, drought, flood, climate change) or biotic (e.g., increased competition)
mortality: number of deaths; due to starvation (competition), predation, or disease
natality: number of births; tends to increase with food supply and decrease with competition
population determiners: four factors that change the numbers of individuals in the population: natality, mortality, immigration, and emigration
1.34. Lesson 9
Module 8—Populations, Individuals, and Gene Pools
Lesson 9—Measuring Growth
 Get Focused
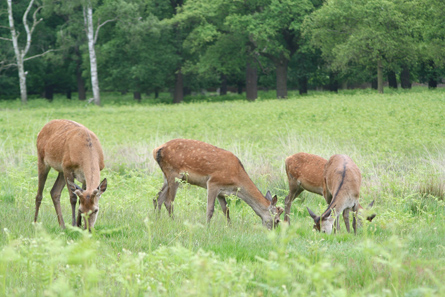
© Christopher Hall/760379/Fotolia
White-tailed deer are browsers. They love the tender buds of shrubs and young trees that make up the transition area between fields and forests. The clearing of forest for residential subdivisions has actually favoured white-tailed deer to a degree because there is more of this transitional browse around the edges of the development, increasing the deer’s food supply.
At the same time that white-tailed deer populations are increasing in size, natural predators of deer, such as coyotes, have been forced out of this habitat by human activity and conflict with human populations. Also, while hunting remains a major means of controlling deer numbers, unlike in early Aboriginal times and times of the early settlers, hunting is no longer the major method humans use to acquire meat. Present-day society largely depends on meat from domestic cows, pigs, and poultry.
With high food supply and without many predators, the density of white-tailed deer is high enough in some areas of North America that they can be considered pests. Today’s hunting regulations are based on research of population numbers done by government branches and independent agents. The resulting yearly hunting regulations are designed to help control the size of natural herds.
The increased density of deer and man’s development of roadways into their habitat have resulted in increased numbers of deer-vehicle collisions as deer attempt to cross highways and roads in their migratory patterns. Many devices have been developed to reduce deer-vehicle collisions, such as fences in National Parks and road reflectors. Another device sends out a very high-pitched sound from cars travelling rural roads. The sound is irritating enough to deer that they are apparently deterred from crossing the road. This may minimize vehicle-deer collisions, but the device can also prevent deer from moving through their natural territories and following their normal migration patterns.
Elk, moose, and other organisms with large, natural territories experience similar population growth patterns where humans have created obstacles to movement, such as roads and railroads.
Wildlife managers study population sizes of wildlife and control their numbers. These studies use effective methods of measuring and expressing the growth of populations.
In this lesson the following focusing questions will be examined:
- How can data be analyzed to study population dynamics?
- How can population data be expressed to give the data meaning?
 Module 8: Lesson 9 Assignment
Download a copy of the Module 8: Lesson 9 Assignment to your computer now. You will receive further instructions on how to complete this assignment later in the lesson.
In addition to your lesson work, any summary notes, sample problems, diagrams, charts, or tables should be stored in the course folder for your teacher’s feedback and study purposes as you prepare for exams.
You must decide what to do with the questions that are not marked by the teacher.
Remember that these questions provide you with the practice and feedback that you need to successfully complete this course. You should record the answers to all of the questions and place those answers in your course folder.
You also have the option of trying additional questions from the textbook for further practice. Consult with your teacher for the answers to these questions. The Key will also provide you with many Diploma Exam-style multiple-choice, numeric-response, and written-response questions that will be an excellent review of the module. Practising your responses to these types of questions is good preparation for the Diploma Exam.
1.35. Page 2
Module 8—Populations, Individuals, and Gene Pools
 Explore
How do field biologists count organisms that run, swim, burrow, or fly away? What about organisms that are too dangerous to get close to or are too small to see? One of the biggest problems that field biologists face is how to get accurate population counts. Counting exact numbers is often difficult, so estimations of population size have to be made. In this lesson, you will learn some of the sampling methods used in field studies and how to do some of the simple calculations that give these population numbers meaning for wildlife managers who analyze the data.
 Read
Read
density (Dp): the number of individuals in a given unit of area (land) or volume (air or water)
![]()
growth rate (gr): the change in the number of individuals in a unit of time
gr will be positive if the population size is increasing, and negative if it is decreasing.
per capita growth rate: the rate of change per individual
![]()
Cgr can also be positive or negative depending on whether the initial N is.
For an introduction to the methods and calculations involved in studying population growth, read from the introduction on page 704 to the beginning of “Factors That Affect Distribution Patterns” on page 705. Then read “The Rate of Population Growth” from page 708 to page 711.
Pay close attention to the important concepts of density (Dp), growth rate (gr), and per capita growth rate (cgr) as different ways of expressing how the population has changed. Take note of the reasons for using each of the three expressions. You need to be comfortable calculating each of these variables: Dp, gr, and cgr. Create a clear and easily accessible table in your course folder for the formulas and their definitions. Examples are a helpful study tool.
Remember that in the Diploma Exam you will encounter many of these problem-solving situations. Whenever possible, practise solving problems from the text or from this lesson. If you are having any difficulty, consult your teacher
Read
clumped distribution: organisms grouped together; occurs in highly competitive environments
random distribution: no pattern exists in organism distribution; occurs in environments with little competition
uniform distribution: organisms are equally spaced apart; occurs in artificial environments (e.g., agricultural crops)
It is tempting to assume that the density of a species in a particular area might represent that individuals are spread out evenly to fairly distribute the resources available. However, some species live clumped together in tightly knit cooperative groups. Some organisms are loners that require large territories that separate them from others of their kind. Some organisms rely on the forces of nature such as wind or water to disperse them, and so are randomly distributed in their environment. Uniform distribution, where individuals are evenly spaced in an area, is rarely observed in nature.
Read “Factors That Affect distribution Patterns” on pages 705 to 707 of the textbook to learn more about the concept of distribution.
Make careful notes on the significance of each distribution pattern and what conditions lead to each pattern. Diagrams are also a good way to store this information in your course folder.
 Self-Check
SC 1. The population size of microscopic Paramecia in a 1-L hay infusion needed to be determined. By using a depression slide (a microscope slide with a well in the center) at medium power and averaging the results of three 1-mL samples, it was found that there were, on average, four Paramecia/mL of hay infusion. What was the population (N) in the entire 1-L infusion?
SC 2. Refer back to “Get Focused” at the start of this lesson. Will the lack of competition and natural selection in white-tailed deer populations increase or decrease the genetic diversity of the gene pool? Explain your answer.
SC 3. There is a lovely white daisy with fern-like leaves that adds brightness and cheer to the roadside ditches of rural Alberta. Unfortunately, it is an inadvertently introduced species and is very invasive, competing vigorously with indigenous wild species. Your job is to provide data on the spread of the species, beginning with a population count of a 1-km2 parcel of land.
- How would you count the daisies? (Refer to samples on pages 704 and 705 in your textbook.)
- Would you do one sampling or several? Why?
- Would it be more informative to express the count as N (population size) or as density? Why ?
Self-Check Answers
SC 1. N = 4 Paramecia/mL X 1000 mL = 4000 Paramecia
SC 2. It depends. If conditions have been highly competitive up until recently, then the allele frequencies of poorer alleles will now increase in the gene pool. However, if no particular phenotype has been selected for in some time, all genotypes will have equal reproductive fitness. Allele frequencies may not change significantly.
SC 3.
- Create a small quadrat sample of 1 m2 and count the number of daisies within the quadrat. Randomly choose the location of several quadrats (ten) and average the results. Extrapolate that number to the number of 1-m2 parcels in the count area. Example: the average of ten quadrats was 4 plants/m2. 4/m2 x 1 000 000 m2/km2 = 4 000 000 plants. Therefore N = 4 000 000 plants.
- Plants do not show uniform distribution, so averaging the results of randomly selected samples improves the statistical validity.
- Density gives a visual idea of what the area looks like. N = 4 000 000 plants doesn't mean much to an observer, but 4 plants/m2 is much easier to visualize.
1.36. Page 3
Module 8—Populations, Individuals, and Gene Pools
 Discuss
On the discussion board, brainstorm with other students and/or your teacher as to what technologies might assist field biologists in their counts of dangerous animals, highly mobile species (e.g., insects, migratory organisms), aquatic organisms, and very small species. Assume your work will be supported with a finite and reasonable amount of time and money. List several of these technologies in your course notes. Reflect on the technologies suggested by other students and adjust your response as required.
 Self-Check
SC 4. Complete questions 5, 6, and 7 on page 709 of your textbook.
SC 5. Assume you have been asked to study a black spruce population in a bog area consisting of 100 km2. Your team has counted the black spruce in five randomly chosen 1-km2 sample areas (called quadrats) within the study area. You will find the counts for each of the five sample quadrats in the chart below. Determine N (total population size) for black spruce in the 100-km2 parcel of land, and Dp (the average density) of black spruce trees per 1 km2.
| Sample (1 km2) | N black spruce |
|---|---|
| 1 | 14 |
| 2 | 0 |
| 3 | 8 |
| 4 | 6 |
| 5 | 2 |
Self-Check Answers
SC 4.
- Growth rate tells you how fast the population is increasing (or decreasing). Per capita growth rate indicates how much of the change each individual in the initial population is responsible for.

SC 5.
- Average/km2 = 14 + 0 + 8 + 6 + 2 = 30 trees/km2 / 5 = 6 trees/km2
- N = 6/km2 × 100 km2 = 600 black spruce trees
 Reflect on the Big Picture
Reflect on the significance of knowing the size of populations when considering the concepts that you have learned in this module. Each concept assumes that someone has gone out into the habitat and actually counted the organisms being studied or that random sampling techniques have been used. For example, in Hardy-Weinberg calculations in a population of 15 black bears living in an area of 100 km2, two of the bears have the homozygous recessive genotype that produces the white Spirit Bear phenotype. The assumption is that a field biologist actually went out and either counted the bears directly or used the random sampling technique to estimate the size of the total black bear population and the number of Spirit Bears within that population. When the wildlife manager determines that the Spirit Bear population has risen by 4% over five years, we know that the wildlife manager applied the formula gr to determine this number.
Population studies are often based on data about the numbers of individuals that have certain phenotypes or alleles. Without the work of field biologists, much of the analysis of genetic change and evolution cannot be carried out. As you reflect on the concepts of quantitative analysis in population studies, consider the significance of population counts and their significance in understanding and managing populations and population change.
Self-Check
SC 6. To review the concepts of this lesson and prepare for your assessment, complete the “Procedure” questions from “Thought Lab 20.1: Distribution Patterns and Population Size Estimates,” on page 706 of your textbook.
Self-Check Answers
SC 6.
1. clumped and random
2. Assume each transect is 10 cm × 1 cm = 10 km2. Area of transect = 10 km2
3. Pattern 1: 6, 5, 3
Pattern 2: 9, 5, 8
Pattern 3: 9, 20, 5, 14, 8, 3
4. Pattern 1: average/transect = 3.7 moose
Pattern 2: average/transect = 7.3 moose
Pattern 3: average/transect = 54/6 = 8 moose
5. Dp = average #/area
Pattern 1: 3.7 moose/10 km2 = 0.37 moose/km2
Pattern 2: 7.3 moose/10 km2 = 0.73 moose/km2
Pattern 3: 8 moose/10 km2 = 0.8 moose/km2
6. Pattern 1: N = 3.7 moose/10km2 transect × 12 transects/population = 44 moose
Pattern 2: N = 7.3 moose/10 km2 transect × 12 transects/population = 87.6 moose
Pattern 3: N = 8 moose/10 km2 transect × 12 transects/population = 96 moose (3)
Self-Check
SC 7. Describe each of the following as random, clumped, or uniform distribution.
- usually seen in artificial or agricultural species
- occurs where resources are abundant and there is little competition
- occurs where organisms are territorial
Self-Check
SC 7.
- uniform distribution
- random distribution
- clumped distribution
You are now ready to apply your understanding to the following assignment.
 Module 8: Lesson 9 Assignment
In this assignment you will have the opportunity to analyze data on moose populations that was collected by field biologists working for the Fish and Wildlife Division of the Alberta Government. You will be given the data to analyze in much the same way that wildlife managers do. You will also be asked to draw conclusions and make recommendations on the basis of the analyzed data.
Retrieve your copy of Module 8: Lesson 9 Assignment that you saved to your computer earlier in this lesson. Complete the assignment and save your completed assignment in your course folder. Submit your completed Module 8: Lesson 9 Assignment to your teacher for assessment.
1.37. Page 4
Module 8—Populations, Individuals, and Gene Pools
 Lesson Summary
This lesson focused on the following questions:
- How can data be analyzed to study population dynamics?
- How can population data be expressed to give the data meaning?
All population calculations are based on reliable counts of numbers of organisms and their phenotypes and/or genotypes. Simple formulas and methods to consistently and accurately count and analyze population counts are essential.
- Most organisms can be counted by extrapolation from an average of small-density samples.
- Density is determined by
 .
.
- Change in population is calculated by Nfinal – Ninitial.
- Growth rate gives information about how fast the population is changing.
 (gr can be positive or negative)
- Per capita growth rate gives information about how much of the change each initial individual is responsible for.
 (cgr can be positive or negative)
- Populations can be distributed randomly where there is low competition, organisms can be clumped in the presence of significant competition, and organisms can be distributed uniformly if there is territoriality or if the population is artificial (e.g., agriculture).
Lesson Glossary
Consult the glossary in the textbook for other definitions that you may need to complete your work.
clumped distribution: organisms grouped together; occurs in highly competitive environments
density (Dp): the number of individuals in a given unit of area (land) or volume (air or water)
![]()
growth rate (gr): the change in the number of individuals in a unit of time
![]()
gr will be positive if the population size is increasing, and negative if it is decreasing.
per capita growth rate (cgr): the rate of change per individual; the amount of change each individual in the initial population is responsible for
![]()
cgr can be positive or negative depending on what the initial N is.
random distribution: no pattern exists in organism distribution; occurs in environments with little competition
uniform distribution: organisms are equally spaced apart; occurs in artificial environments (e.g., agricultural crops)
1.38. Lesson 10
Module 8—Populations, Individuals, and Gene Pools
Lesson 10—Growth Patterns
 Get Focused
© Oleg Kozlov/45426/Fotolia
© Werg/6014942/Fotolia
Exponential Versus Logistic Growth Patterns
From your work in Unit B, consider how many offspring a woman might be capable of having in her lifetime. There are approximately 30 years from the first ovulation in puberty until menopause. Ovulation occurs every 28 days, so there are about 12 opportunities a year to produce an egg. That’s 30 years × 12 ovulations/year = 360 ovulations or opportunities to reproduce in a woman’s lifetime.
However, there are nine months of gestation for the offspring and, if the mother is nursing, she may not ovulate for a few months after the birth. Assuming she’s capable of having one child each year for those 30 years, each woman has the potential to produce 30 offspring in her 80-year lifespan. This number doesn’t take factors such as multiple births, miscarriages, missed ovulations, malnutrition, maternal and child mortality, sterility, or other factors into consideration. However, it is still a very impressive figure.
With close to seven billion people on the planet and approximately half of them female, you can see how human population size could significantly increase if conditions were favourable! The human population growth graph on page 733 of your textbook may convince you that it already has. Humans, however, do not typically produce 30 offspring, and they reproduce at a much slower rate than their biotic potential might permit.
As impressive as the biotic potential of humans is, it pales in comparison to a typical female field mouse. At one month of age, the female mouse is capable of breeding and having a litter of ten young after a gestation period of 20 days. After giving birth, the female mouse ovulates and can breed again 24 hours later. Even though she may only live five months in the wild due to predation, the biotic potential of a wild mouse is staggering: four months (120 days) of breeding, producing one litter of ten pups every 20 days = a potential to produce 60 offspring in her five-month lifespan. Achieving this potential is common in mice. This amazing reproductive potential or fecundity reminds us of how necessary predators (like coyote, fox, hawks, the domestic cat) and, possibly, poisons (like Warfarin) are in controlling mouse populations.
Biotic potential is one of many factors responsible for how fast a population grows. The different rates of growth seen in various species produce two different growth patterns that have been observed in nature. In this lesson you will be introduced to both patterns.
In this lesson the following focusing questions will be examined:
- What are the different types of population growth patterns?
- How do growth patterns illustrate these types of changes over time?
 Module 8: Lesson 10 Assignment
Download a copy of the Module 8: Lesson 10 Assignment to your computer now. You will receive further instructions on how to complete this assignment later in the lesson.
In addition to your lesson work, any summary notes, sample problems, diagrams, charts, or tables should be stored in the course folder for your teacher’s feedback and your study as you prepare for exams.
You must decide what to do with the questions that are not marked by the teacher. Remember that these questions provide you with the practice and feedback that you need to successfully complete this course. You should record the answers to all of the questions and place those answers in your course folder.
Remember, you also have the option of trying additional questions from the textbook for further practice. Consult with your teacher for the answers to these questions. The Key will also provide you with many Diploma Exam-style multiple-choice, numeric-response, and written-response questions that will be an excellent review of the module. Practising your responses to these types of questions is good preparation for the Diploma Exam.
1.39. Page 2
Module 8—Populations, Individuals, and Gene Pools
 Explore
J curve: population growth with a brief lag phase and a steep increase in the growth curve
S curve: a logistic growth pattern with a lag phase, growth phase, and stationary phase in which limiting factors become significant
exponential growth: a growth pattern exhibited by a population that doubles with each generation; results in a J-shaped curve; begins with a lag phase, followed by a steep rise
density-independent factors: abiotic factors that limit a habitat’s carrying capacity (e.g.,fire, flood, frost); the impact is not affected by the density of the population
lag phase: the first phase of a growth graph showing little increase in population numbers
carrying capacity (K): the theoretical maximum population size that the environment can sustain over an extended period of time; may change as the quality of the habitat changes; the population is at carrying capacity when it levels off during logistic growth
logistic growth: a population increase resulting in an S-shaped curve; begins with slow growth, steepens to exponential growth, and then levels to a carrying capacity due to competition because of environmental resistance
exponential phase: the second phase of a growth graph in which population size increases significantly because limiting factors are not yet significant
density-dependent limiting factors: biotic factors that limit a habitat’s carrying capacity (e.g., parasites, disease, increase in predators, lack of water, food, or territory); the impact increases with the density of the population
environmental resistance: the combined effects of factors that limit population growth; prevents a population from growing at its biotic potential; determines the carrying capacity of the environment
stationary phase: the third stage of a population growth graph in which population size stabilizes because of the balance between environmental resistance and biotic potential
Exponential Versus Logistic Growth Patterns
When a population is introduced into a new area and population growth is plotted on a graph, one of two shapes can result: a J curve or an S curve. Although it may seem strange that all of Earth’s organism’s fall into one of the two patterns of growth, that does appear to be the case.
If a population has a constant birth rate through time and is minimally limited by food or disease, it is an example of exponential growth. In exponential growth, the birth rate is constant despite the size of the population. The only factors that limit exponential growth are density-independent factors such as climate (e.g., temperature, water, wind, light), natural disasters, or other abiotic factors.
Examples of organisms that reproduce in this way are bacteria, most insects, and fast-growing plants like dandelions. For example, bacteria always double themselves (by binary fission) with each generation. They are reproducing at their biotic potential. An easy way to predict the population size for organisms that double with each generation is to use the exponential term 2n, where n is the number of generations involved. For example, bacteria that are in their 7th generation will have 128 individuals from one original organism.
The population growth curve of exponentially reproducing species has certain distinct phases. Initially, in the first few generations following introduction to a new environment, population growth is slow and the curve stays fairly flat. This portion of the graph is called the lag phase. Thereafter the population size can increase dramatically from generation to generation, forming an ever-steepening J-shaped curve. As time goes on, the difference in population size from one generation to the next becomes quite astounding. Applied to bacterial populations with a generation time of 20 minutes, it would not take long for the progeny of one bacterial cell to cover the face of Earth!
However, in most natural populations both food and disease factors become significant as conditions become more crowded. In natural conditions there is an upper limit to the number of individuals that any habitat can support. Ecologists refer to this number as the carrying capacity of the environment, symbolized as K. Populations that increase in number to K are examples of logistic growth and form an S-shaped curve if they are introduced into a new environment.
Unlike species that grow exponentially, in logistic growth the birth rate does change over time. If a logistically growing species is introduced into a new environment and the changes in population size are graphed, you wouldn’t see much difference between the logistic growth curve and the growth curve of an exponentially growing species. Initially, food and space are plentiful and nothing limits growth rate. The growth curve will show the same lag phase as the J curve and then a steep exponential phase, where resources are abundant and organisms reproduce at their biotic potentials.
At this point however, the J and S curves begin to diverge. In logistic growth, density-dependent limiting factors become an issue as the population grows. The habitat’s food sources become depleted, nesting space and territory become scarce, wastes accumulate, and disease becomes significant, spreading faster as individuals become more crowded. Predators become more numerous, and life becomes more dangerous.
The effect of all these density-dependent factors is called environmental resistance, and it indicates that the habitat can not sustain this rate of growth. With environmental resistance, birth rate begins to fall and the growth curve begins to flatten, unlike exponential growth in which the birth rate never changes. Consequently, the curve drops and eventually flattens into a steady population size that the habitat is able to support—a number called the carrying capacity of the environment. At this point the S-shaped curve enters the stationary phase.
The population stays at carrying capacity because of the continued action of density-dependent limiting factors, like food supply, disease, predation, waste accumulation, and lack of space. The only factor that could cause the population size to change would be a fluctuating carrying capacity of the environment. For example, if the habitat were degraded (perhaps by human activity or natural catastrophe) and the environment could no longer support the same number, carrying capacity would find a lower level.
Logistic growth is found in any species that changes its reproductive rates depending on the availability of resources and the action of density-dependent limiting factors.
 Read
Read
To understand and study graphs representing the concepts of exponential and logistic growth patterns, read from “Factors That Affect Population Growth” on page 709 of the textbook to “Life Strategies” on page 712. Include in your notes drawings of the J- and S-curve graphs showing the characteristic shapes of both kinds of growth. Label the two graphs with the distinct phases of growth.
Save these notes in your course folder. You will note that interpreting graphs is an important skill in Biology 30. If you use The Key to prepare for the diploma exam, you will have the opportunity to see many types of questions based on graphs, or you can go to the Alberta Education website to view samples of Diploma Exam questions.
1.40. Page 3
Module 8—Populations, Individuals, and Gene Pools
 Watch and Listen
Understanding these concepts and their graphs is essential in Biology 30. You may wish to review these concepts by watching “Patterns of Population Growth and Management: Conserving Our Future.” You should pay particular attention to the following segments:
- “Population Growth Curves”
- “Bio Review: J-shaped Population Growth Curve”
- “Natural Populations”
- “Bio Review: S-shaped Population Growth Curve”
- “Effect of Environment on Yeast Populations”
 Self-Check
Bacterial Growth
In suitable abiotic conditions and with adequate food, E. coli bacteria (part of your normal intestinal flora) undergo binary fission every 20 minutes. Thus, with each generation, populations double and each generation is only 20 minutes long. Typically, bacteria introduced onto a growth medium will go through the following phases:
- lag phase—slow growth
- exponential growth—doubling with each generation
- death phase—population crashes due to competition for food and accumulation of toxins
SC 1. Using your calculator (using 2n as a function)
- fill out the following table
- graph the results (it is only necessary to plot every second generation on the graph)
If necessary, ask your teacher how to calculate the data for the table.
Exponential Population Growth in E.coli Bacteria |
|
Generation # |
Population (N) |
1 |
|
2 |
|
3 |
|
4 |
|
5 |
|
6 |
|
7 |
|
8 |
|
9 |
|
10 |
|
13 |
|
14 |
|
15 |
|
16 |
|
17 |
|
18 |
|
19 |
|
20 |
|
Assume the environment (the Petri dish containing the nutrient medium) can only support 1 million bacterial cells. Respond to the following questions.
SC 2. At what generation has the population outstripped its environment and will begin to crash? If generation 1 was time 0, at what time did the population crash?
SC 3. Draw a graph showing the growth curve. Label axes correctly and provide a title. Label the graph with lag phase, exponential phase, and death phase.
SC 4. With each successive generation, what happens to the difference between N of the previous population and N of the current population?
SC 5. A population of lilies is growing exponentially with a generation time of three days. The water lilies threaten the species living below the surface by cutting off sunlight. At this point in time, the lilies cover half the pond. How long before the whole pond is covered?
Self-Check Answers
SC 1.
Exponential Population Growth in E.coli Bacteria |
|
Generation # |
Population (N) |
1 |
2 |
2 |
4 |
3 |
8 |
4 |
16 |
5 |
32 |
6 |
64 |
7 |
128 |
8 |
256 |
9 |
512 |
10 |
1024 |
13 |
2048 |
14 |
4096 |
15 |
8192 |
16 |
16 384 |
17 |
32 768 |
18 |
65 536 |
19 |
524 288 |
20 |
1 048 576 |
SC 2. 20, approx 3:42
SC 3. Discuss your graph with your teacher, who will make suggestions for improvement. Graphing is an important skill in Biology 30.
SC 4. The differential increases dramatically.
SC 5. 3 days
Watch and Listen
Exponential and Logistic Growth Simulation
Conduct an Internet search using the terms “otherwise, logistic, exponential, applet” to give you access to two excellent and easy-to-use applets that will simulate exponential and logistic growth. Both allow you to manipulate birth rates to see how the graphs of logistic and exponential growth differ.
 Try This
This Population Density Factors Activity will help you check your understanding of density-dependent and density-independent factors.
1.41. Page 4
Module 8—Populations, Individuals, and Gene Pools
 Reflect and Connect
Based on the concepts of this lesson, reflect on whether the distinction between logistic and exponential growth is always clear.
Mice, as discussed in the beginning of this lesson, have amazingly high, near-exponential reproductive rates. When graphed, their growth will show a very steep, almost J, curve. But mice too will eventually respond to famine and environmental resistance and come to a carrying capacity with their environment.
Mosquitoes might be considered an exponentially reproducing species. As long as there are pools of water in ditches and ponds and temperatures stay below freezing, mosquitoes will lay thousands of eggs, reproducing exponentially at biotic potential. But even mosquitoes’ reproductive rates are limited by whether or not they can obtain a blood meal from warm-blooded sources (such as humans, elk, or deer) to incubate the eggs they carry within them.
Consider humans. Human reproductive rates respond to density-limiting factors such as lack of food. All mammals, including humans, will produce fewer eggs and sperm when body fat content becomes low, sometimes preventing reproduction entirely. In Unit B you discovered why many anorexic women or female elite athletes may not have a menstrual cycle. The human growth curve should, therefore, have the S shape of a logistic growth pattern. However, the human growth curve is a distinct J. Environmental resistance does not appear to have any significant effect. This is largely due to human's ability to use technology to produce more food and combat disease. It remains to be seen whether the curve will flatten into an S shape as the carrying capacity is determined or whether it will continue through to the usual conclusion of J curves—a population crash. Fortunately, the most recent data shows that the human growth curve is getting somewhat flatter—perhaps more a result of birth control and higher education levels than the effects of environmental resistance.
 Discuss
You have studied the graph on page 733 of your textbook, which shows the human growth curve. Can human population growth continue like this indefinitely? Does the word carrying capacity even apply to Homo sapiens? Has human society seen evidence of environmental resistance? Are density-dependent and density-independent factors at work now? What are the consequences to Earth? Develop, present, and defend your position on Earth’s carrying capacity of Homo sapiens on the discussion board. Work with other students and your teacher in developing more ideas. File you work in your course folder.
 Module 8: Lesson 10 Assignment
Retrieve the Module 8: Lesson 10 Assignment you downloaded earlier. Complete all three parts (Part A, B, and C) and save a copy of the completed assignment to your course folder. Submit the completed assignment to your teacher for assessment.
 Self-Check
SC 6. Which of the following would not be an example of environmental resistance?
- drought
- increase in predators
- disease due to waste accumulation
- lack of food
- lack of nesting sites
- organisms with a high biotic potential
- organisms with a low biotic potential
- organisms reproducing at their biotic potential
- organisms that have many offspring at a time
- stationary phase: high b, low d
- lag phase: low b, high d
- exponential phase: high b, low d
- lag phase: b and d are equal
- exponential growth and population crash
- logistic growth and J curve
- exponential growth and carrying capacity
- exponential growth and S curve
- Density of hares was highest in the control group.
- Removing predators doubled the population density.
- When population density rises, environmental resistance offered by lack of food and increased predators are equally important in controlling density.
- The combined effect of removing both food and predators was greater than the sum of both effects.
Self-Check Answers
SC 6. E
SC 7. C
SC 8. C
SC 8. A
SC 9. D
1.42. Page 5
Module 8—Populations, Individuals, and Gene Pools
 Lesson Summary
This lesson focused on the following questions:
- What are the different types of population growth patterns?
- How do growth patterns illustrate these types of changes over time?
In this lesson you have discovered that the biotic factors affected by population density are called density-dependent factors. Examples are food, water, oxygen, space, parasitism, and predator populations. The abiotic factors that affect population density are called density-independent factors. Examples are climate, temperature, storms, drought, frost, wind, and precipitation.
You were introduced to the term biotic potential, symbolized by r, which is, given unlimited resources, the highest rate of reproduction. Populations growing at biotic potential form a J curve and have exponential growth rates, while populations growing in environments with limited resources will not exceed a population size known as the carrying capacity, symbolized by K. These populations growing in environments with limited resources will display an S-shaped or logistic growth curve.
By analyzing the parts of population graphs and their trends, scientists can explain changes in population growth, such as reasons for declining population size, and predict the future of populations and the impact their growth might have on the environment.
Lesson Glossary
Consult the glossary in the textbook for other definitions that you may need to complete your work.
biotic potential (r): highest per capita growth rate possible
carrying capacity (K): the theoretical maximum population size that the environment can sustain over an extended period of time; may change as the quality of the habitat changes; the population is at carrying capacity when it levels off during logistic growth
density-dependent limiting factors: biotic factors that limit a habitat’s carrying capacity (e.g., parasites, disease, increase in predators, lack of water, food, or territory); the impact increases with the density of the population
density-independent factors: abiotic factors that limit a habitat’s carrying capacity (e.g., fire, flood, frost); the impact is not affected by the density of the population
environmental resistance: the combined effects of factors that limit population growth; prevents a population from growing at its biotic potential; determines the carrying capacity of the environment
exponential growth: a growth pattern exhibited by a population that doubles with each generation; results in a J-shaped curve; begins with a lag phase, followed by a steep rise
exponential phase: the second phase of a growth graph in which population size increases significantly because limiting factors are not yet significant
fecundity: the ability of an organism to be fertile or to reproduce
J curve: population growth with a brief lag phase and a steep increase in the growth curve
lag phase: the first phase of a growth graph showing little increase in population numbers
logistic growth: a population increase resulting in an S-shaped curve; begins with slow growth, steepens to exponential growth, and then levels to a carrying capacity due to competition because of environmental resistance
S curve: a logistic growth pattern with a lag phase, growth phase, and stationary phase in which limiting factors become significant
stationary phase: the third stage of a population growth graph in which population size stabilizes because of the balance between environmental resistance and biotic potential
1.43. Lesson 11
Module 8—Populations, Individuals, and Gene Pools
Lesson 11—r- and K-Selected Growth Patterns
 Get Focused
© Yevgeniy Zateychuk/3395120/Fotolia
Consider the dandelion: a lovely yellow flower with a bad reputation. Dandelions can be seen bursting through lawns in the spring to create colour and cheer. Unfortunately, Canadians consider dandelions a weed, and often uses herbicides in an attempt to get rid of them before they out-compete the grass species in lawns.
Many other cultures look forward to dandelion season to harvest the dents du lion (lion’s teeth) leaves as one of the first edible species of spring, providing vitamins and minerals after a long winter without fresh vegetation. The plants produce their flower rapidly, the petals fall away, and the fluffy seed heads are dispersed by wind to far-away places where competition won’t be a limiting factor. The entire life cycle is completed in three weeks.
This short life cycle ensures reproduction is completed before frost, drought, heat, or flooding is able to prevent it. Unstable abiotic factors like these require a life strategy that produces as many offspring as possible, as quickly as possible, and with little or no investment of energy into parenting or ensuring the survival of offspring by the plants. Is this typical of all organisms? Are there other strategies?
In this lesson the following focusing question will be examined:
- What are the characteristics and reproductive strategies of r- and K-selected organisms?
r-selected organisms: species that have r-selected strategies, such as a short life span, early reproductive age, large numbers of offspring, and little parental care
K-selected organisms: species that have K-selected strategies, such as longer life span, later reproductive age, few offspring, and parental care
 Module 8: Lesson 11 Assignment
Download a copy of the Module 8: Lesson 11 Assignment to your computer now. You will receive further instructions on how to complete this assignment later in the lesson.
In addition to your lesson work, any summary notes, sample problems, diagrams, charts, or tables should be stored in the course folder for your teacher’s feedback and your study as you prepare for exams.
You must decide what to do with the questions that are not marked by the teacher. Remember that these questions provide you with the practice and feedback that you need to successfully complete this course. You should record the answers to all of the questions and place those answers in your course folder.
Remember, you also have the option of trying additional questions from the textbook for further practice. Consult with your teacher for the answers to these questions. The Key will also provide you with many Diploma Exam style multiple choice, numerical response, and written response questions that will be an excellent review of the module. Practising your responses to these types of questions is good preparation for the Diploma Exam.
1.44. Page 2
Module 8—Populations, Individuals, and Gene Pools
 Explore
The Amazing Race
In your imagination, visualize a competition in which all species of the planet are challenged to the following two tasks to complete in order to win the competition:
- Make as many offspring as possible, but your offspring must survive long enough to reproduce.
- Spread yourselves as far and wide over the planet as possible.
Each entrant is given $1000 in ATP energy currency that can be used to complete the tasks. How each species spends the “money” is entirely up to them, but each body system employed in the quest requires more energy. The strategy used by each species to complete the tasks is called reproductive strategy.
What would go into developing a reproductive plan?
- Would the type of environment you’re in make a difference to your strategy? (stable versus unstable)
- Is it better to reproduce at biotic potential (r) or just enough to remain at carrying capacity (K)?
- Should you attempt to improve your offspring’s survival by nurturing them, or should you just concentrate on producing the maximum number of offspring?
- Should you begin reproducing as soon as possible in your life cycle, or should you wait until later, when you’re more mature?
- Is it better to reproduce only once a year, when conditions are good, or continually?
r-selected strategy: takes advantage of favourable conditions; characterized by early reproduction and high reproductive rate with little investment in offspring survival
K-selected strategy: takes advantage of stable conditions; characterized by few offspring with much investment and nurturing to increase offspring survival
Of course you know that the strategies used by species to survive are not chosen; rather, they are the result of the organism’s environment selecting for the most suitable random mutations. The successful alleles/phenotypes become more common in the gene pool and eventually become typical of the species’ reproductive strategy. However, biologists have noticed that two major reproductive strategies have emerged: the r-selected strategy and the K-selected strategy. It is these two strategies that are the subject of this lesson.
 Read
Read
Read “Life Strategies” on pages 712 to 713, and “Sharing the Biosphere” from page 731 to the end of “Earth’s Carrying Capacity” on page 736 in the textbook. Make notes in your course folder on your readings, including examples of age pyramids.
 Watch and Listen
The video “Patterns of Population Growth and Management: Conserving Our Future” reviews many of the concepts that you have learned in this module and also the r- and K-selected strategies that you have learned in this lesson. You should concentrate on the following segments as you watch the video:
- “Population Growth Curves”
- “Bio Review: J-Shaped Growth Curve”
- “Natural Populations”
- “Bio Review: S-shaped Population Growth Curve”
- “Survivorship Curves”
 Self-Check
SC 1. Complete the following table in your course folder using your reading assignment of pages 712 to 713 of the textbook.
| Variables | r-selected Species | K-selected Species |
|---|---|---|
| Lifespan of the Organism (long or short?) | ||
| Reproductive Age (when does it become fertile? early in life or later?) | ||
| Number of Offspring Over Lifetime, and Number of Offspring with Each Reproduction | ||
| Growth Rate (close to biotic potential (r) or to close to carrying capacity (K)?) | ||
| Nurturing of Offspring (is there care and education/training of the young or are they left to survive on their own?) | ||
| Size of Organism (small or large?) | ||
| Stability of Environment (stable or unstable?) | ||
| Show Logistic Growth (S-shaped growth curve) or Exponential Growth (J-shaped growth curve)? |
 Self-Check Answers
SC 1.
| Variables | r-selected Species | K-selected Species |
|---|---|---|
Lifespan |
short |
long |
Reproductive Age |
early |
late |
Number of Offspring |
many |
few |
Growth Rate |
close to r |
close to K |
Nurturing of Offspring |
no |
yes, often extended |
Size of Organism |
small |
large |
Stability of Environment |
unstable—high potential of disruption from density-independent factors (climate) |
stable |
Show Logistic Growth (S-shaped growth curve) or Exponential Growth (J-shaped growth curve?) |
exponential growth pattern—J-shaped growth curve |
logistic growth pattern—S curve |
1.45. Page 3
Module 8—Populations, Individuals, and Gene Pools
Growth Curves, Reproductive Strategies, and Population Change
In this lesson you’ve learned that species that use the r-selected reproductive strategy reproduce exponentially and have J-shaped growth curves. Similarly, species that use the K-selected reproductive strategy reproduce logistically and have S-shaped growth curves. These concepts can be related to population change, which was the focus of the first part of the unit.
Natural selection favours the members of a population that have phenotypes/alleles that are best suited for survival in an environment. But where on the population growth curve does natural selection begin to have its effect? Think about the following statement: “There are no winners without a competition.” Competition in natural populations only begins when the going gets tough—specifically, when food starts to run out, nesting space and territory is limited, wastes accumulate, disease breaks out, and predator numbers climb. These density-dependent limiting factors set the stage for survival of the fittest.
Look at the logistic growth curve and consider where on this curve competition and selection for superior alleles begins. This is where population change or microevolution occurs as those organisms with superior physical, biochemical, and behavioural traits continue to live and reproduce while those around it do not. Use this information to complete the following Self-Check activity.
 Self-Check
Using the following graph illustrating exponential and logistic growth, answer the questions. Check your work and file your answers in your course folder.
Logistic (S) vs. Exponential (J) Growth Curves
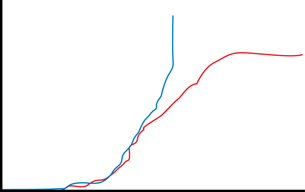
SC 2. Label the region as (A) on the logistic curve where you would expect there to be the greatest competition and, therefore, selection of favourable alleles. Support your answer.
SC 3. Label the region as (B) on the logistic graph where you would expect to see the highest concentration of “winners”—those with the most favourable alleles that have been naturally selected for. Support your answer.
SC 4. Label the region as (C) on this graph where you would expect to see the predator-prey cycles that were discussed in a previous lesson occurring. Support your answer.
Self Check Answers
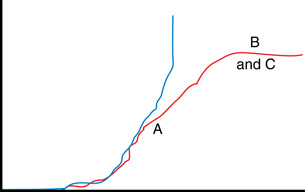
SC 2. During this period, environmental resistance is high due to the competition that results from scarcity and other density-dependent factors. Competition is weeding out the unfavourable alleles and increasing the frequency of favourable alleles.
SC 3. At carrying capacity (the stationary phase of the logistic growth curve) the alleles that are present are those of the “survivors”—those that have survived the competitive weeding-out process and have been naturally selected.
SC 4. At carrying capacity the number of prey is held in check by the number of predators. However, the reverse is also true. High prey numbers result in high predator numbers, which lead to low prey numbers and, in turn, to low predator numbers. So, the two populations cycle together, helping to keep populations at carrying capacity.
Self-Check
To review your skills with r- and K-selected life strategies, complete the following questions.
SC 5. K-selected species typically have all of the following characteristics EXCEPT
- large size
- nurture their young
- reproduce early in life
- live in stable environments
- controlled by density-independent factors
- able to grow at their biotic potential
- likely to show boom and bust population cycles
- all of the above
- large body size
- late reproductive age
- stable environment
- large number of offspring
- display a J-shaped growth curve
- display an S-shaped growth curve
- show logistic growth
- stabilize at a population number called the carrying capacity
- humans
- mosquitoes
- bees
- ducks
Self-Check Answers
SC 5. C
SC 6. D
SC 7. D
SC 8. A
SC 9. B
1.46. Page 4
Module 8—Populations, Individuals, and Gene Pools
 Reflect and Connect
When wildlife managers see population numbers deviate from an expected growth curve, it indicates a problem. Apply your knowledge of growth curves to different species and their problems by completing the following questions.
 Self-Check
SC 10. In Lesson 10, you graphed the data from a population of caribou from 1910 to 1950. The graph showed an extended period of exponential growth followed by a crash. Considering what you know now about the characteristics of K-selected species, was the graph typical? Why or why not?
SC 11. According to the table you created in SC 1 earlier in this lesson, are humans r- or K-selected? View “Figure 20.22” on page 733 of your textbook. Does the population growth curve support your decision? Why or why not?
SC 12. Review pages 733 and 735 in your textbook and view the age pyramids in “Figure 20.23” on page 735 to see age-pyramid representations of growth rates in the Congo, Sweden, and Germany. Which of the countries shows exponential growth? Negative growth? Stationary growth?
Self-Check Answers
SC 10. No, caribou are K-selected (large, long lifespan, nurture their young) and should show an S population growth curve. There should be a short period of exponential growth that flattens out due to environmental resistance, followed by a relatively stable carrying capacity population.
SC 11. Humans are K-selected by definition, but the human growth curve shows extended exponential growth typical of r-selected species. The best explanation is that technology has raised the carrying capacity of the environment to extend the period of exponential growth. There is evidence that, in recent years, the slope of the curve is starting to flatten somewhat.
SC 12. Congo shows exponential growth.
Germany shows negative growth.
Sweden shows stationary growth.
 Module 8: Lesson 11 Assignment
Before you begin the Lesson 11 Assignment, you may wish to do the review questions on pages 716 and 737. Your teacher can help you select the questions best suited to your needs.
Retrieve the Module 8: Lesson 11 Assignment that you downloaded at the beginning of the lesson. Complete the assignment, save a copy to your course folder, and submit a copy to your teacher for assessment.
1.47. Page 5
Module 8—Populations, Individuals, and Gene Pools
 Lesson Summary
This lesson focused on the following questions:
- What are the different types of population growth patterns?
- How do growth patterns illustrate these types of changes over time?
In this lesson you learned to describe a population as r-selected (J curve) or K-selected (S curve). The terms are used in comparison to each other. K-selected species live close to carrying capacity, have long lifespans, are generally large in mass, reproduce later in life, and have small numbers of offspring, which they nurture. In comparison, r-selected species are growing close to their biotic potential, have short lifespans and early reproductive ages, are generally small in mass, and have large numbers of offspring with large die-off and little, if any, parental care. Furthermore, K- and r-selection are two extremes of a continuum—most species fit in between.
You have studied how the phenomena influenced by human activity, such as climate change, over-harvesting, pollution, and introduction of invasive species into foreign environments, can greatly affect populations. You have also learned that age pyramids are useful tools for predicting future populations.
Human populations were at carrying capacity for most of history. Technology has increased life expectancies and decreased infant mortality, causing the carrying capacity and population growth rates to increase exponentially. Today, due to reduced birth rates, many human populations are no longer growing exponentially, though a few are. The human carrying capacity will be influenced by growth rates, age structures, the state of the environment, and technological developments, but will likely be approximately nine billion.
Lesson Glossary
Consult the glossary in the textbook for other definitions that you may need to complete your work.
K-selected strategy: takes advantage of stable conditions; characterized by few offspring with much investment and nurturing to increase offspring survival
K-selected organisms: species that have K-selected strategies, such as longer life span, later reproductive age, few offspring, and parental care
reproductive strategy: the strategies used in reproduction to ensure survival of a species; may be r- or K-selected strategies
r-selected strategy: takes advantage of favourable conditions; characterized by early reproduction and high reproductive rate with little investment in offspring survival
r-selected organisms: species that have r-selected strategies, such as a short life span, early reproductive age, large numbers of offspring, and little parental care
1.48. Module Summary/Assessment
Module 8—Populations, Individuals, and Gene Pools
 Module Summary
In this module you were asked the following inquiry questions:
- How does the biology of populations differ from the biology of individual organisms?
- How can an individual’s contributions to the gene pool of a population, and the interactions within a population and between populations, result in changes in communities?
The focus of this module was populations rather than individuals. You have learned that each individual that is part of a population experiences the same struggle for survival as its neighbours. Coded in its DNA, each individual brings its physical, chemical, and behavioural characteristics to the population into which it is born or migrates. Limiting factors act on this genetic raw material, selecting some individuals and rejecting others, thereby shaping the genetic composition of the population.
The more variation or biodiversity in a species, population, and community, the better the species' chances are to adapt to changes and disruptions in the environment. You have also come to understand that, in order to prevent extinction of any species, the immediate challenge for the human population of the world is to protect biodiversity and prevent disruption of habitat, climate, and other environmental limiting factors of natural populations.
In this module you explored concepts and developed skills related to populations and communities:
- The genes of all the individuals in a population together form a gene pool. Using Hardy and Weinberg’s work, you discovered the conditions that keep the frequency of alleles in the gene pool at equilibrium. By reversing the conditions for Hardy-Weinberg Equilibrium, you learned the mechanisms that are responsible for change or microevolution in a population’s gene pool. Those mechanisms are genetic drift, change in mutation rate, natural selection, gene flow, and mate selection. The only populations not evolving are those that humans have controlled. You learned how to use the Hardy-Weinberg Equation to calculate allele and genotype frequencies to determine if a population is evolving.
- You learned that variation in the gene pool is desirable because it prevents extinction in the face of environmental change and allows organisms to adapt to new conditions. You learned that many human activities have acted to reduce the amount of variation in wild and domestic populations, thereby putting the populations at risk.
- You learned that all members of a population are always interacting with each other and members of other populations in either predator-prey or symbiotic relationships (commensalism, parasitism, and mutualism). All organisms have either structural, chemical, or behavioural defences that allow them to compete interspecifically or intraspecifically, hopefully staying alive long enough to pass on their genes to the next generation. Staying alive means competing intraspecifically and interspecifically for scarce resources in one’s habitat. You learned that human activities often destroy habitat—limiting food, water, and territory and increasing competition for survival between wild organisms, reducing population numbers, and threatening extinction.
- You learned that the landscape undergoes a progressive change or aging called succession that begins with pioneer species and ends with a climax species unique to that biome. You learned what natural and artificial factors can result in a new primary or secondary succession and why, in some cases, it is a good thing.
- In terms of reproduction, you learned of two major kinds of growth patterns seen in living things: exponential growth, as shown in a J growth curve, and logistic growth, as shown in an S growth curve. In logistic growth, density-dependent limiting factors such as food, predators, and disease, flatten the growth curve to reach a population size known as carrying capacity (K) that can be supported by the environment. Carrying capacity will fall if habitat destruction occurs. In exponential growth, growth rates are at a maximal rate known as biotic potential (r). Population growth is exponential until the population crashes—often the result of density-independent factors, such as climate.
- You learned of two reproductive strategies for maximizing the number of offspring that will survive. Organisms that are r-selected will produce many young but with no investment in nurturing or teaching, so most offspring die. Organisms that are K-selected produce very few offspring, but nurture and teach them for a long time, increasing their chances of survival.
- You learned how organisms in a population are counted, and several ways of expressing that growth mathematically so that it has meaning to those whom are interested. Different patterns of distribution were studied showing that organisms live in different groupings.
- Finally, you looked at our own species as a population that is growing rapidly and is having a major effect on the species around you due to humankind's unique ability to alter environments to suit its needs. As human habitat increases, the habitat of other species decreases. You looked at several biotechnologies and how they have affected populations in both good and bad ways, emphasizing that human activities done with good intentions often have far-reaching, unintended consequences.
To review and summarize the concepts of Module 8, you may wish to complete a concept organizer. You may have saved a copy of this document when you encountered it at the beginning of Module 8. If you didn’t, you may download the Module 8 Concept Organizer now. The concept organizer provides an outline of the lessons and the focusing questions for each lesson you studied in Module 8. Fill in the concept organizer with the ideas that you have mastered in each lesson, and show how these ideas helped you answer the focusing questions. You can use keywords, point form, or any amount of detail that meets your needs. You may choose to work from the file on your computer, print the document and work from the paper copy, or copy the outline onto a large sheet of poster paper. This is a great tool to review and use for study purposes.
For an excellent review guide to Unit D: Module 8, conduct an Internet search for “Gene School Population Genetics.” The website you will find offers helpful explanations and clear graphics to guide you and prepare you for your module and unit assessments. You have also been encouraged to complete the review questions at the end of the unit chapters on pages 700 to 701 and 740 to 741 in the textbook. You will find additional support at the textbook’s online website, www.albertabiology.ca. You can use the unit pre-quizzes, web links, chapter highlights, study tips, research tools, and other opportunities to review.
Module Assessment
For your Module 8 Assessment you will have a choice of two options. Option 1 consists of multiple-choice and numeric-response questions based on your studies of population dynamics and communities. This assessment is worth 40 marks. Option 2 is based on a population study and is a written response to a series of bullets for your essay. This assessment is worth 30 marks. After you finish the Module 8 Assessment, you will do the final Unit D Assessment.
Before you begin the Unit Assessment, you are reminded to do the Unit Review questions on pages 744 to 747 of your textbook. Your teacher may suggest particular questions for your review and will provide you with solutions to the questions.
Option 1 (40 marks)
This option for Module 8 Assessment consists of two parts:
Part A: multiple-choice and numerical-response questions based on your studies of Population Dynamics and Communities (26 marks)
Part B: written-response (14 marks)
If you want to complete Option 1, download the Module 8 Assessment now.
Option 2—Coyote Management Report (30 marks)
This assessment is worth 30 marks. Before beginning your work, study the rubric for assessment, which appears at the end of this section, carefully.
The assessment requires you to assume the role of a wildlife biologist who is preparing a report for the Alberta Department of Fish and Wildlife regarding the changes in the coyote population in a particular 1000-km2 area from 1990 to 2000. In addition to the population counts available in the chart below, you have the following data: increased sightings of coyotes, more livestock kills, more coyote-human interactions, and more attacks on pets. You will create a report with the following sections: data analysis, interpretations, conclusions. To do this you will need to use the concepts and vocabulary you’ve learned in Module 8.
- Data analysis should involve the formulas you have learned to quantify growth of populations: ∆N, growth rate, and per capita growth rate. You should also create a population growth graph to determine trends and identify and explain the reproductive growth pattern.
- Interpretations of analyzed data should indicate that you have understood what the analyzed data means. What do the calculated values and graphs tell you about the coyote population currently? What kind of reproductive strategy is in play and what factors might be influencing it currently? You need to consider both the qualitative and quantitative data, and use them to come up with possible explanations of the observed changes.
- Your conclusions should be presented in the form of a report to the wildlife manager responsible for the region. From the analysis of your findings you should be able to make clear recommendations to the wildlife manager regarding the management of this population in terms of hunting, habitat, and protection of livestock and the public. You must show evidence of using a risk/benefit model to determine what the best solutions might be. Your supervisor will need to look at the advantages and disadvantages of your recommendation and what evidence you have to support them. Be sure to date and sign your report.
- The report should include all data, calculations, graphs, mathematical analyses, interpretations of data, conclusions and recommendations.
Data Set for analysis
Coyote populations over a 150-year period in a 100-km2 parcel of land.
Year |
Population Size (N) |
1850 |
402 |
1860 |
50 |
1870 |
90 |
1880 |
150 |
1890 |
300 |
1900 |
700 |
1910 |
1000 |
1920 |
1100 |
1930 |
1120 |
1940 |
1000 |
1950 |
720 |
1960 |
700 |
1970 |
710 |
1980 |
720 |
1990 |
710 |
2000 |
1000 |
Your work will be assessed using the following rubric. (The mark will be taken out of 15 then multiplied by two for a mark out of 30.)
Data Analysis (5 marks)
Has the student
- made use of the formulas to calculate trends: DN, gr, cgr
- made calculations correctly
- created graphs to identify trends
- graphed the data correctly
- taken into account the qualitative data in the analysis
- other reasonable criteria
Interpretations (5 marks)
Has the student
- made a statement that indicates the meaning in the changes in population size, growth rate, and per capita growth rate
- made a statement(s) indicating what the trends indicated in the graph mean
- made a statement regarding the reproductive strategy used by the coyote
- indicated what limiting factors might be in play to explain the current changes in population size
- interpretated the qualitative as well as the quantitative information
- show creative or innovative interpretation of the data
- used the vocabulary and concepts from the module to discuss her or his interpretations
- any other reasonable criteria
Conclusions (5 marks)
Has the student
- formed conclusions
- evaluated different explanations to form conclusions
- made recommendations that can be supported by the data and interpretations
- shown advantages and disadvantages in deciding on recommendations
- shown evidence of using a risk/benefit model to decide on appropriate recommendations
- shown an understanding of the concepts in the module in making his or her conclusions
- any other reasonable criteria
1.49. Module Glossary
Module 8—Populations, Individuals, and Gene Pools
Glossary
Consult the glossary in the textbook for other definitions that you may need to complete your work.
antibiotic resistance: the ineffectiveness of an antibiotic that results if a bacterial cell has alleles that make it resistant to being destroyed by antibiotics
Each dose of antibiotics will allow these bacteria to survive and pass on their resistant traits to the next generation—more of each generation are resistant until the resistant allele is the most common; at this point, the antibiotic is no longer effective.
behavioural defences: actions and gestures that are meant to communicate that the organism is dangerous and should be avoided or is harmless and not threatening
biotechnology: manipulation of genes or traits
biotic potential (r): highest per capita growth rate possible
bottleneck effect: a type of genetic drift similar to the founder effect; occurs when a natural disaster thins the population to a small group that happens to be unrepresentative of the original group
Allele frequencies of the two groups will be dissimilar.
carrying capacity (K): the theoretical maximum population size that the environment can sustain over an extended period of time; may change as the quality of the habitat changes; the population is at carrying capacity when it levels off during logistic growth
chemical defences: toxic, bad-tasting, or bad-smelling chemicals secreted by an organism that either discourage consumers from eating it, poison consumers, or prevent competitors from growing or living nearby
climax species: the last species of plant in the succession; is used to name the succession
clumped distribution: organisms grouped together; occurs in highly competitive environments
commensalism: a type of symbiosis in which one species benefits and the other is not affected one way or another
cryptic colouration (camouflage): colours or patterns that allow an organism to blend into its environment and avoid being seen
density (Dp): the number of individuals in a given unit of area (land) or volume (air or water)
![]()
density-dependent limiting factors: biotic factors that limit a habitat’s carrying capacity (e.g., parasites, disease, increase in predators, lack of water, food, or territory); the impact increases with the density of the population
density-independent factors: abiotic factors that limit a habitat’s carrying capacity (e.g., fire, flood, frost); the impact is not affected by the density of the population
emigration: number of individuals that leave the population; due to the same reasons as immigration
environmental resistance: the combined effects of factors that limit population growth; prevents a population from growing at its biotic potential; determines the carrying capacity of the environment
exponential growth: a growth pattern exhibited by a population that doubles with each generation; results in a J-shaped curve; begins with a lag phase, followed by a steep rise
exponential phase: the second phase of a growth graph in which population size increases significantly because limiting factors are not yet significant
fecundity: fertility; the ability of an organism to be fertile or to reproduce
founder effect: a type of genetic drift that occurs when a small population that is not representative of the main population migrates away
Allele frequencies of the two groups will be dissimilar.
frequency: number/total; how common something is; usually expressed as a decimal percentage; e.g., an incidence of “2 in 5” gives the same information as a frequency of 0.4 or 40%
gene flow: movement of alleles into or out of a population by immigration or emigration
genetic drift: a change in allele frequencies caused by chance events in a small gene pool, such as inbreeding caused by isolation of a small non-representative group or a few non-breeding individuals (bachelors)
Founder effect and bottleneck effect are examples of genetic drift.
growth rate (gr): the change in the number of individuals in a unit of time
![]()
gr will be positive if the population size is increasing, and negative if it is decreasing.
Hardy-Weinberg equation: an equation used to determine the frequency of genotypes: p2 + 2pq + q2 = 1, where p = frequency of the dominant allele and q = frequency of the recessive allele
If the frequency of genotypes is known, the equation can be used to work backwards to find the frequency of alleles in the gene pool.
Hardy-Weinberg Equilibrium: a principle that states that allele frequencies in a population will remain the same over time as long as the population is large, there is no gene flow, natural selection is not occurring, there is no change in mutation rate, and no mate selection is occuring
If allele frequencies do change, it indicates that microevolution is occurring in the population.
host: the organism in a type of symbiotic relationship that provides food or a means to complete reproduction for the parasitic organism of another type of species
immigration: number of individuals entering the population from outside; can be due to abiotic factors (e.g., escape from fire, drought, flood, climate change) or biotic (e.g., increased competition)
interspecific competition: when members of two different species compete for scarce resources and survival; competition only occurs when there are too many organisms and not enough resources
intraspecific competition: when members of the same species compete against each other for scarce resources and survival; causes microevolution because one phenotype or allele will have better survival than another
The scarcer the resources, the more extreme the competition and the faster microevolution occurs.
invasive species: species that are introduced to an area and that out-compete the indigenous species in its trophic level for nutrients and/or prey; are less affected by limiting density-dependent and density-independent factors
J curve: population growth with a brief lag phase and a steep increase in the growth curve
K-selected strategy: takes advantage of stable conditions; characterized by few offspring with much investment and nurturing to increase offspring survival
K-selected organisms: species that have K-selected strategies, such as longer life span, later reproductive age, few offspring, and parental care
lag phase: the first phase of a growth graph showing little increase in population numbers
logistic growth: a population increase resulting in an S-shaped curve; begins with slow growth, steepens to exponential growth, and then levels to a carrying capacity due to competition because of environmental resistance
mate selection (non-random mating): the process of choosing mates based on the presence of certain traits or phenotypes and, thus, genotypes
Traits are usually displayed in some form of courtship ritual.
microevolution: a change in the frequency of alleles in the gene pool that results in a change in the characteristics of the population; does not result in a new species
mimicry: when a harmless organism has the same bright colouration of an organism that has protective colouration
monoculture: the cultivation of a single crop
mortality: death; may be due to kill-off (predation) or die-off (disease, starvation, or exposure)
mutualism: a type of symbiosis involving two organisms of different species in which both benefit or depend on the relationship to survive
natality: number of births; tends to increase with food supply and decrease with competition
natural selection: the process by which organisms with heritable traits survive in a particular environment, passing on their successful traits to the next generation
Those selected have greater reproductive fitness that either increases fertility or decreases mortality.
niche: a position or role taken by an organism within its community
parasite: the organism in a symbiotic relationship that benefits by living on or in another organism (host) as a source of food or means of reproduction
The host is harmed in this relationship.
per capita growth rate (cgr): the rate of change per individual; the amount of change each individual in the initial population is responsible for
![]()
cgr can be positive or negative depending on what the initial N is.
pioneer species: the first species of plant to invade a cleared site in a succession
population: organisms of a particular species in a particular place at a particular time
population determiners: four factors that change the numbers of individuals in the population: natality, mortality, immigration, and emigration
predator-prey: a relationship in which one organism (predator) hunts and kills another organism (prey) for food
primary succession: a succession that begins with bare rock; soil-building organisms (e.g., lichen) are pioneers
protective colouration: bright colours that give clear warning to potential attackers
random distribution: no pattern exists in organism distribution; occurs in environments with little competition
reproductive strategy: the strategies used in reproduction to ensure survival of a species; may be r- or K-selected strategies
r-selected strategy: takes advantage of favourable conditions; characterized by early reproduction and high reproductive rate with little investment in offspring survival
r-selected organisms: species that have r-selected strategies, such as a short life span, early reproductive age, large numbers of offspring, and little parental care
S curve: a logistic growth pattern with a lag phase, growth phase, and stationary phase in which limiting factors become significant
secondary succession: a succession that begins with soil
stationary phase: the third stage of a population growth graph in which population size stabilizes because of the balance between environmental resistance and biotic potential
structural defences: physical parts of the organism that either protect the organism from being consumed or allow the organism to compete better for scarce resources
succession: the orderly replacement of one species with another over time; occurs after a disruption, such as fire
symbiotic relationship: any close relationship in which individuals of different species live together in a feeding or protective relationship
transgenic organism: an organism that has genes from more than one species
uniform distribution: organisms are equally spaced apart; occurs in artificial environments (e.g., agricultural crops)
wildlife corridor: a route used by wildlife to move from one territory to another
Wildlife corridors are often part of a migratory pattern.