Module 5
| Site: | MoodleHUB.ca 🍁 |
| Course: | Physics 30 SS |
| Book: | Module 5 |
| Printed by: | Guest user |
| Date: | Wednesday, 17 December 2025, 6:20 AM |
Description
Created by IMSreader
Table of contents
- 1. Module 5
- 1.1. Big Picture
- 1.2. In this Module
- 1.3. Lesson 1
- 1.4. Page 2
- 1.5. Page 3
- 1.6. Page 4
- 1.7. Page 5
- 1.8. Lesson 2
- 1.9. Page 2
- 1.10. Page 3
- 1.11. Page 4
- 1.12. Lesson 3
- 1.13. Page 2
- 1.14. Page 3
- 1.15. Page 4
- 1.16. Page 5
- 1.17. Page 6
- 1.18. Lesson 4
- 1.19. Page 2
- 1.20. Page 3
- 1.21. Page 4
- 1.22. Page 5
- 1.23. Page 6
- 1.24. Lesson 5
- 1.25. Page 2
- 1.26. Page 3
- 1.27. Page 4
- 1.28. Page 5
- 1.29. Lesson 6
- 1.30. Page 2
- 1.31. Page 3
- 1.32. Page 4
- 1.33. Page 5
- 1.34. Module Summary/Assessment
- 1.35. Module Glossary
1. Module 5
Module 5—Wave Theory of Light
Module Introduction
In Physics 20 you examined the properties of waves and the universal wave equation: c = fλ. In Physics 30: Unit B you examined how changing electric fields and magnetic fields can induce each other. In Module 5 you will expand upon your understanding of waves and electric and magnetic fields to see how they form waves of electromagnetic radiation (EMR).
In Module 5 you will explore the wave nature of EMR. You will do this by looking at the electromagnetic spectrum, including visible light, and how EMR properties change as the frequency or wavelength changes. You will study the properties of EMR, reflection, refraction, and diffraction, and evaluate how each property shows evidence of the wave nature of EMR. Along the way you will look at the work of James Clerk Maxwell, who established the theory of the wave nature of EMR. You will also study Heinrich Hertz, who performed the experiments that led to an understanding of EMR. Finally, you will see how experimentation developed to accurately measure the speed of light.
1.1. Big Picture
Module 5—Wave Theory of Light
 Big Picture

© Veronika Vasilyuk/shutterstock
In Module 5 you will investigate the production, propagation, reflection, refraction, diffraction, and interference of light. These characteristics will show that light behaves like a wave, answering the question, “Is light a wave or a particle?” Each lesson will examine a behaviour or characteristic of light and the key experiments that show how that behaviour or characteristic demonstrates the wave nature of light.
What is the first thing that comes to mind when you think of light? For most people, it is sunshine. Sunshine greets us in the morning, warms us in the day, and lets us see the moon at night. In essence, sunshine allows us to observe our environment and understand what surrounds us.
In this respect, light is a tool that helps build our understanding of both the universe and our immediate surroundings, all at the same time. People use light every day without much thought about how light is produced or what it is. Only in recent times have we learned that visible light only makes up a very small section of the electromagnetic spectrum. For example, radio waves, X-rays, infrared heat, and ultraviolet radiation are just a few of the many classifications of electromagnetic radiation (EMR) that demonstrate very similar behaviours to that of visible light.
Understanding such a vast array of applications and observations is simplified using a model. In this module you will explore many parts of the electromagnetic spectrum using a wave model, particle model, or both.
Using both observations and models, you will investigate the nature and behaviour of light and electromagnetic radiation in general.
As you are working in Module 5, keep the following questions in mind:
- What roles do electricity and magnetism play in the production of electromagnetic radiation (EMR)?
- Does EMR exhibit wave- or particle-like characteristics?
- What does experimental evidence suggest about the nature of EMR?
 Module Assessment
Each lesson has a teacher-marked assignment, based on work completed in the lesson. In addition, you will be graded on your contributions to the Discuss section of each lesson.
You will also be asked to complete Self-Check or Try This questions, which you should place in your Physics 30 course folder. These are not formally assessed but are a valuable way to practise the concepts and skills of the lesson. These activities can provide you with reflective feedback on your understanding of the lesson work.
You will be marked for your lesson work on the following items:
- Module 5: Lesson 1 Assignment
- Module 5: Lesson 2 Assignment
- Module 5: Lesson 3 Assignment
- Module 5: Lesson 4 Assignment
- Module 5: Lesson 5 Assignment
- Module 5: Lesson 6 Assignment
At the end of the module you will complete a module assessment that consists of two diploma-style written response questions. The first question will assess your ability to perform a refraction experiment, and the second will assess your comparison of the spectrum created by a diffraction grating with the spectrum produced by a prism. You will find these questions in the Module 5 Summary and Assessment. If you have any questions, contact your teacher.
1.2. In this Module
Module 5—Wave Theory of Light
In This Module
In Module 5 the wave model of light will be used to describe the following characteristics of electromagnetic radiation:
- its production
- its speed and propagation
- reflection
- refraction
- diffraction and interference
Lesson 1—Electromagnetic Radiation
In this lesson you will explore the properties of the many forms of electromagnetic radiation that form the electromagnetic spectrum, including how radiation is generated, transmitted, and received. You will also learn how electrical charge and magnetic field are related to the production of electromagnetic radiation.
You will investigate the following essential questions:
- Is electromagnetic radiation more than just visible light?
- How is the electromagnetic spectrum organized?
- How are electrical charge and magnetic field related to the production of electromagnetic radiation?
- How are electromagnetic waves generated, transmitted, and received in technologies such as the radio?
Lesson 2—The Speed of Light
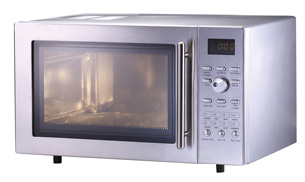
In this lesson you will learn how to measure the speed of light by using another planet, in a laboratory, and in a microwave.
You will investigate the following essential questions:
- How can you measure the speed of light using another planet?
- How can you measure the speed of light in a laboratory?
- How can you measure the speed of light using a microwave oven?
Lesson 3—Reflection
In this lesson you will explore the law of reflection in various contexts. You will learn about the two different types of reflection, what a ray diagram represents, and how to draw and use ray diagrams to predict and explain the characteristics of images formed in flat and curved mirrors.
You will investigate the following essential questions:
- What is regular and diffuse reflection?
- What is the law of reflection?
- How do I draw a ray diagram, and what does it represent?
- How are images formed in flat and curved mirrors, and how are ray diagrams used to predict and explain their characteristics?
Lesson 4—Refraction
In this lesson you will learn about the nature and cause of refraction and how Snell’s Law can describe it mathematically. You will also explore other properties of refraction and the role of these properties when a prism produces a rainbow.
You will investigate the following essential questions:
- What is the nature and cause of refraction?
- What is an “index of refraction”?
- How does Snell’s Law describe refraction mathematically?
- What is total internal reflection?
- How do you calculate a critical angle?
- How does a prism produce a rainbow, and how is a prism similar to a natural rainbow?
Lesson 5—Refractions, Lenses, and Optical Systems
In this lesson you will learn what is meant by a thin lens and how ray diagrams and the thin lens equation are both used to predict image characteristics for thin lenses.
You will investigate the following essential questions:
- What is a thin lens?
- How are ray diagrams used to predict image characteristics for thin lenses?
- How is the thin lens equation used to predict image characteristics for thin lenses?
Lesson 6—Diffraction and Interference
In this lesson you will investigate what is meant by diffraction and interference patterns. You will also explore the significance of Thomas Young’s experiment as it relates to the wave model of light.
You will investigate the following essential questions:
- What is diffraction?
- What is an interference pattern?
- What is the significance of Thomas Young’s experiment as it relates to the wave model of light?
- How are diffraction patterns solved mathematically in ideal and experimental conditions?
1.3. Lesson 1
Module 5—Wave Theory of Light
Lesson 1—Electromagnetic Radiation
 Get Focused
© Noel Powell, Schaumburg/shutterstock
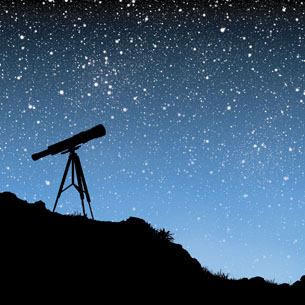
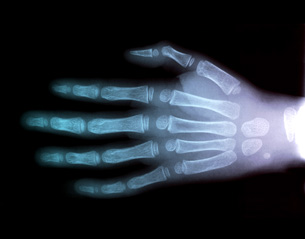
The night sky reveals an untold number of stars, each one producing light that propagates outward in all directions. Eventually, some of the light reaches Earth, as shown by this illustration of the night sky. In another image, the bone structure of the human hand is revealed by X-rays that can travel only through certain tissues. At first glance, the images seem completely unrelated; but they are not.
What do these two photographic images have in common? Are they both formed by light passing through space and material? Are both images based on exposure to electromagnetic radiation? Do X-rays travel through human tissue the same way visible light passes through the universe?
Jim Wehtje/Photodisc/Getty Images
Both visible light and X-rays belong to the electromagnetic spectrum, a classification system that describes all electromagnetic radiation. X-rays and visible light are also produced similarly and demonstrate a relationship between electric and magnetic fields.
In this lesson you will answer the following essential questions:
- Is electromagnetic radiation more than just visible light?
- How is the electromagnetic spectrum organized?
- How are electrical charge and magnetic field related to the production of electromagnetic radiation?
- How are electromagnetic waves generated, transmitted, and received in technologies such as the radio?
 Module 5: Lesson 1 Assignment
Your teacher-marked Module 5: Lesson 1 Assignment requires you to submit a response to the following:
- Assignment—A 1, A 2, A 3, A 4, A 5, and A 6
- Discuss—D 3
The other questions in this lesson are not marked by the teacher; however, you should still answer these questions. The Self-Check and Try This questions are placed in this lesson to help you review important information and build key concepts that may be applied in future lessons.
After a discussion with your teacher, you must decide what to do with the questions that are not part of your assignment. For example, you may decide to submit to your teacher the responses to Try This questions that are not marked. You should record the answers to all the questions in this lesson and place those answers in your course folder.
1.4. Page 2
Module 5—Wave Theory of Light
 Explore

© Jip Fens/shutterstock
In scientific terms, electromagnetic radiation, or EMR, is radiant energy travelling outwards from a source in the form of a wave. Unlike the mechanical waves studied in your previous physics courses, EMR does not require a material medium in which to move. The EMR wave is classified by its wavelength (length) or by its frequency (oscillations per second). For example, when you turn on a light, microwave popcorn, use a cordless remote control, talk on a cellphone, or tune into a radio station, you are using devices that operate with different types of electromagnetic radiation based on their wavelengths and frequencies. Organizing all of the different types of electromagnetic radiation by frequency or wavelength produces an electromagnetic spectrum.
wavelength: the distance between adjacent points on a wave that vibrate in phase with one another (m)
frequency: the number of cycles per unit of time (Hz = 1 cycle/second)
electromagnetic spectrum: a general classification of all electromagnetic radiation based on wavelength, frequency, and energy

Adapted from image courtesy of NASA
The rainbow seen in the picture is a natural example of a spectrum. It demonstrates that white light can be separated into a “spectrum” of colours organized by wavelength. The violet light has a wavelength of 400–450 nm (nm is nanometer, ×10–9 m). As you look inward, the wavelengths get longer until you reach red light at 630–700 nm. Therefore, a rainbow is the natural expression of the visible light spectrum. But what is just beyond the violet end of the spectrum? What is just beyond the red end of the spectrum?
Obviously, these will be EMR waves that cannot be sensed by the human eye. Some, however, you may sense with our skin. Infrared waves, for example, are felt as heat; they have a wavelength slightly longer than red light, making them “invisible” (outside the visible spectrum). The term red hot may have more meaning for you now. Ultraviolet waves, for example, cause sunburns; they have a wavelength shorter than violet light, so they are also “invisible” (outside the visible spectrum). Even though you can’t see them they can still affect you.
 Read
Read
Read pages 637–638 in your textbook to find out more about the types of EMR and the electromagnetic spectrum.
 Self-Check
SC 1. Using “Table 13.1” on page 638 of your textbook, identify what is unique about visible light compared to the rest of the EMR spectrum.
SC 2. Open the Spectrum applet. Adjust the wavelength and frequency slider. Observe the energy of the wave. Describe the relationship between the following two characteristics:
- frequency and energy
- wavelength and energy
SC 3. An infrared wave of EMR has a frequency of 2.0×10¹² Hz. What is the wavelength of the wave?
Self-Check Answers
Contact your teacher if your answers vary significantly from the answers provided here.
SC 1. The visible light part of the spectrum is unique because that is the only part of the electromagnetic spectrum that can be sensed by the human eye.
SC 2.
- The frequency and the energy of EMR are proportional; as the frequency doubles, the energy doubles.
- The wavelength and the energy of the EMR are inversely proportional. As the wavelength doubles, the energy halves; and as the wavelength decreases to one-third of its value, the energy triples.
SC 3.
Given
Required
the wavelength of the wave
Analysis and Solution
Paraphrase
The wavelength of the infrared wave is 1.5×10⁻⁴ m.
 Module 5: Lesson 1 Assignment
Remember to submit your answers to A 1, A 2, A 3, and A 4 to your teacher as part of your Module 5: Lesson 1 Assignment.
A 1. Medical technologies related to imaging and cancer treatment use high-frequency EMR. What precautions should medical personnel take when working with these types of technologies?
A 2. A student measures the period of an electromagnetic wave as 3.64×10⁻¹⁵ s.
- What is the frequency of the wave?
- What is the wavelength of the wave?
- To which part of the electromagnetic spectrum does the wave belong?
A 3. What are the two competing models of electromagnetic radiation? Explain how each works.
A 4. Explain Young’s experiment and how it proved one of the theories of electromagnetic radiation.
 Try This—Maxwell’s Electromagnetic Theory, 1865
In 1865, James Clerk Maxwell summarized four basic relationships between electricity and magnetism that predicted the existence of an electromagnetic wave. The four relationships were described in mathematical notation beyond the scope of this course but are presented here as general textual descriptions.
- An electric field surrounds any charged object, and an electrostatic force will act on any other charged object that exists within it, exhibiting action at a distance.
- A magnetic field is a three-dimensional continuous closed loop.
- An electric current, or a changing electric field, will produce a magnetic field.
- A changing magnetic field can produce an electric field capable of causing an induced current and potential difference in a conductor within the field.
From these four relationships, two reverse phenomena exist. A changing magnetic field produces an electric field, and a changing electric field produces a magnetic field. Based on this knowledge, Maxwell was able to correctly predict that it is possible for changing magnetic and electric fields to travel through empty space in the form of an electromagnetic wave. His prediction also described other properties and characteristics of the electromagnetic wave. Specifically, he predicted the following:
- The electromagnetic wave consists of perpendicular, oscillating, electric, and magnetic fields in a constant phase relationship. The direction of propagation is perpendicular to both the magnetic and electric fields.
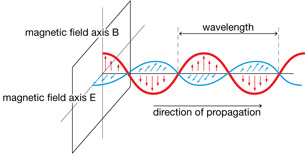
View the animation of a propagating electromagnetic wave. In this animation, an electromagnetic wave is produced whenever a charge is accelerated.
1.5. Page 3
Module 5—Wave Theory of Light
 Read
Read
Read pages 641–643 of your textbook for more information on Maxwell’s Electromagnetic Theory.
 Try This
TR 1. Why is change important in producing EMR?
 Module 5: Lesson 1 Assignment
Remember to submit your answers to A 5 and A 6 to your teacher as part of your Module 5: Lesson 1 Assignment.
A 5. Where does the energy for the EMR originate?
A 6. What new concept did Maxwell introduce?
Try This—Producing, Transmitting and Receiving EMR
Electromagnetic waves were first produced and detected in 1887, shortly after Maxwell’s death. German physicist Heinrich Hertz (1857–1894) used a spark gap to rapidly move an electric charge back and forth producing a wave of 109 Hz, which was detected by a nearby antenna. He was also able to confirm that the waves travelled at nearly 3.0 × 10⁸ m/s. Hertz called these electromagnetic waves “radio” waves. For his significant contribution to the study of science, the SI unit of frequency Hertz, or Hz (cycles per second or seconds–1), was named in his honour. Today, radio waves are very common. AM/FM radios, cellphones, garage-door openers, and cordless telephones operate in the radio range of the spectrum. You will explore how they are produced, transmitted, and received using your own radio station.
Use the Radio Waves simmulation to open your own radio station.
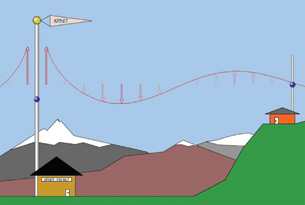
© 2008 University of Colorado. All rights reserved.
Your radio station has a transmitting tower that consists of an electron in a long conductor. Your listening audience is in the small house with a receiver attached to a long conducting antenna.
Select “Manual” on the Transmitter Movement menu and wiggle the electron in the transmission tower. Observe the correlation to the wave that is produced. Next, select "Oscillate" and observe the simple harmonic motion of the electron.
 Self-Check
SC 4. Does the frequency of the simple harmonic motion match the frequency of the radio wave?
SC 5. What causes the electron to accelerate up and down in a real transmission antenna? Explain how this will be related to the frequency of the radio wave produced.
SC 6. Describe the relationship of the direction of the electric wave, the magnetic wave, and the direction of the EMR.
Self-Check Answers
Contact your teacher if your answers vary significantly from the answers provided here.
SC 4. The frequency of oscillation in the transmitter tower matches the frequency of the emitted radio wave, in both manual and oscillation modes. The sine wave that is produced is a perfect representation of the acceleration of the electron in the conductor.
SC 5. In a real transmission tower, an electrical potential difference causes the electrons to accelerate. Oscillating the electrical potential difference results in an identical oscillation of the charge, producing a matching sine wave of EMR that propagates outwards.
SC 6. The electric wave, the magnetic wave, and the direction of the EMR are all at 90° to each other, like the x, y, and z axes of a Cartesian coordinate system. One example of the infinite possibilities of the relationship, if the wave were to move into the page, would be that the electric field could oscillate up and down and the magnetic field could oscillate left and right.
Read
Read pages 644–647 of your textbook for more information on Hertz’s experiment and radio technology.
 Discuss

© Dan Briški/shutterstock
Shadows are the result of visible light being unable to pass through solid objects. Gamma rays and radio waves, on the other hand, are on opposite ends of the spectrum, yet they can both pass through solid walls. Visible light is in the centre of the spectrum in terms of frequency and energy, yet it cannot pass through a wall or solid object.
D 1. Why is this? Research and post a solution to this problem. In your explanation, explain how you would determine the smallest possible object you could see with visible light. You may wish to include a diagram to clarify your response. The suggested Internet search phrase, “Why can’t light travel through walls,” may help with your research.
D 2. Post your summary to the discussion area set up by your teacher. Compare your summary to at least one other explanation produced by another student. Identify similarities and differences between your work and the work of other students. Remember to add the answer to this question to your course folder.
Module 5: Lesson 1 Assignment
Remember to submit your answer to D 3 to your teacher as part of your Module 5: Lesson 1 Assignment.
D 3. If you were to update your explanation of why light can’t travel through walls based on what you learned in D 2, what changes would you make?
Discussion Scoring Guide
| Principles involved: wavelength, frequency, waves, and light | ||||
Criteria |
Level 1 |
Level 2 |
Level 3 |
Level 4 |
Knowledge |
||||
Demonstrates a vague and sometimes incorrect understanding of the physics principles involved. Obvious irrelevant or missing information. |
Demonstrates a basic understanding of the physics principles involved. May exhibit minor mistakes or vague information or application to the situation. |
Demonstrates a good understanding of the physics principles involved and applies them properly to the given situation. All necessary information is given. |
Demonstrates a superior understanding of the physics principles involved and their application to the situation. All applications are considered in detail. |
|
Reflection |
||||
The post shows reflection on one’s own and other students’ work. Contributes to the group discussion. |
Does not make an effort to participate. Seems indifferent to discussion. |
Occasionally makes meaningful reflections on the group’s efforts or discussions. Marginal effort is shown to become involved with the group or discussion. |
Frequently makes meaningful reflections on the group’s efforts and presents relevant viewpoints for consideration by the group. Interacts freely with group members. |
Regularly attempts to motivate the group discussion and delve deeper into concepts. Interacts freely and encourages all group members. |
Content and presentation of discussion summary |
||||
The information is logically arranged in a clear and concise manner. |
The information is poorly organized with many concepts implied. Irrelevant or rambling sentences make reading difficult. |
The information is somewhat organized with implied concepts. Excessive words or awkward sentences are used, which hinder reading. |
The information is well-organized and logically arranged. All concepts are explicitly explained. There are a few awkward but understandable sentences. |
The information is well-organized and very easy to understand. Well-worded sentences make reading pleasurable. |
1.6. Page 4
Module 5—Wave Theory of Light
 Reflect and Connect
© Micah May/shutterstock
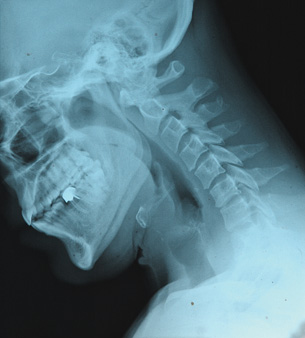
X-ray technologies are one of many diagnostics tools deployed in the health-care system. They also illustrate the production and transmission of electromagnetic waves.
An X-ray machine similar to those found in hospitals and dental offices uses a high voltage to accelerate an electron towards a tungsten metal target. With sufficiently high voltage, the electron gains enough energy to knock an inner shell electron out of the atom when it collides with the metal target. In an instant, an outer shell electron accelerates and replaces the lost inner electron to create an electromagnetic wave with the frequency and energy of an X-ray.
The wave then propagates outward toward the patient or specimen. Those waves that contact dense material—such as metal fillings, bones, and teeth—are absorbed and cast a shadow. Those waves that encounter less dense, soft tissues pass through and cause the white X-ray film to turn black and produce a negative image similar to the one in the photo.
Since X-rays have sufficient energy to knock out free electrons, they are considered a type of “ionizing radiation,” capable of damaging biological systems. Therefore, exposure to X-rays is minimized by taking images only when medically necessary and by protecting technicians by blocking X-rays with dense materials such as lead.
In the past, people did not always take such care around X-rays. In the 1940s and early 1950s, a shoe-fitting X-ray machine was a common fixture in shoe stores and department stores. These machines had three viewing ports so that your salesperson and a friend could look at your feet with you! The dangers of these machines became known in the 1950s; by the 1970s, their use was banned.
 Module 5: Lesson 1 Assignment
Remember to submit the Module 5: Lesson 1 Assignment to your teacher.
1.7. Page 5
Module 5—Wave Theory of Light
 Lesson Summary
In this lesson you focused on the following questions:
- Is electromagnetic radiation more than just visible light?
- How is the electromagnetic spectrum organized?
- How are electrical charge and magnetic field related to the production of electromagnetic radiation?
- How are electromagnetic waves generated, transmitted, and received in technologies such as the radio?
A rainbow is a natural example of the visible light spectrum. It is organized by wavelength and frequency and illustrates all of the colours that, taken together, form white light. Visible light, however, represents only a small portion of the entire electromagnetic radiation spectrum, which is organized by wavelength and frequency. Low frequency, low-energy EMR includes AC power, radio waves, microwaves, and infrared heat. High frequency, high-energy EMR includes ultraviolet waves, X-rays, gamma rays, and cosmic rays, which can permanently damage biological systems.
In 1865, James Clerk Maxwell predicted that perpendicular, oscillating, electric, and magnetic fields propagated in the form of an electromagnetic wave. He added that an electromagnetic wave is produced whenever a charge is accelerated. And if the electric charge exhibits simple harmonic motion, the frequency of the wave matches the frequency of the simple harmonic motion. Maxwell also concluded that all electromagnetic waves travel through a vacuum at a common speed and obey the universal wave equation. Furthermore, the waves exhibit similar properties to that of transverse waves: interfering, diffracting, refracting, and reflecting.
In 1887, Heinrich Hertz experimentally verified Maxwell’s predictions by using a spark gap to produce a 109-Hz wave that was received by a nearby antenna. Radio technology uses accelerating charges in a similar way to produce EMR waves that propagate outwards from a transmitter tower. The EMR waves are capable of inducing a current in a distant conducting antenna. Furthermore, the sine wave produced at the transmitter tower is identical to the sine wave of the induced current in the receiving antenna, facilitating the delivery and reproduction of sounds, music, and voices.
Lesson Glossary
electromagnetic spectrum: a general classification of all electromagnetic radiation based on wavelength, frequency, and energy
frequency: the number of cycles per unit of time (Hz = 1 cycle/second)
wavelength: the distance between adjacent points on a wave that vibrate in phase with one another (m)
1.8. Lesson 2
Module 5—Wave Theory of Light
Lesson 2—The Speed of Light

© Olaru Radian-Alexandru/shutterstock
 Get Focused
In 1983, the international system of units (SI) adopted the following new definition of the metre: “A metre is the length of the path travelled by light in vacuum during a time interval of 1/299 792 458 of a second.”
This means that the speed of light in vacuum is exactly 299 792 458 m/s and that the definitions related to distance and length are based on this value. In fact, the global positioning system, or GPS, depends on it. A GPS receiver can pinpoint its location on the surface of Earth by calculating its distance from the global positioning satellites.
How is the distance between a receiver and a satellite determined? Each GPS satellite broadcasts a precise, synchronized time signal. A receiver, such as the one in the photo, measures how long it takes the time signal to travel from the satellite to a receiver. Using this time information and the value for the speed of light in a vacuum, the precise distance separating the receiver and the satellite is determined. Repeating this process for a minimum of three satellite time signals provides enough information to determine the receiver’s exact position using a process called trilateration.
 Watch and Listen
Watch Global Positioning Systems to see how trilateration is used to determine the precise location of a GPS receiver.
GPS is just one example of an optical system that is based on our understanding of the speed of light. Obviously, the speed of light is very fast—so fast that it takes only 1.3 seconds for light to travel from Earth to the Moon. When the first humans orbited the Moon in Apollo 8, there was nearly a three-second delay in all communications as the EMR made its way from Earth to the command module and back again. On Earth, it would take about 0.0668 s for light to travel from Canada to Japan.
Connecting two computers by sending the light through fibre optics and switching equipment on the Internet would take about 0.18 s. Even with a stopwatch, you would have difficulty accurately measuring the time it takes for light to travel anywhere on Earth.
So how was the speed of light determined if it travels so fast? Was it determined using astronomical observations? Can it be measured on a lab bench? Does it slow down when it enters water and other materials, such as glass? In Lesson 2 you will investigate the speed of light.
In this lesson you will answer the following essential questions:
- How can you measure the speed of light using another planet?
- How can you measure the speed of light in a laboratory?
- How can you measure the speed of light using a microwave oven?
 Module 5: Lesson 2 Assignment
Your teacher-marked Module 5: Lesson 2 Assignment requires you to submit responses to the following:
- Assignment—A 1
- Laboratory—LAB 1, LAB 2, LAB 3, LAB 4, LAB 5, LAB 6, and LAB 7
The other questions in this lesson are not marked by the teacher; however, you should still answer these questions. The Self-Check and Try This questions are placed in this lesson to help you review important information and build key concepts that may be applied in future lessons.
After a discussion with your teacher, you must decide what to do with the questions that are not part of your assignment. For example, you may decide to submit to your teacher the responses to Try This questions that are not marked. You should record the answers to all the questions in this lesson and place those answers in your course folder.
1.9. Page 2
Module 5—Wave Theory of Light
 Explore

Physics (Pearson Education Canada, 2007) p. 648, fig 13.21. Reproduced with permission.
Olaus Roemer (1664–1710) and Christiaan Huygens made one of the earliest attempts to measure the speed of light using astronomical data. The period of revolution for Jupiter’s moon, Io, was well known. It would periodically disappear from sight, or eclipse, as it travelled behind Jupiter only to reappear on the other side every 42.5 hours.
However, depending on the time of year you observed the eclipse, it would appear 22 minutes behind schedule. Presumably, this time difference is caused by the extra distance the light has to travel when Jupiter and Earth are on opposite sides of the Sun. Given that the extra distance is equal to Earth’s orbital diameter and the time it takes to travel that distance, Roemer was able to measure the speed of light to be 2.3 × 10⁸ m/s. And although it was very close to the currently accepted value of 3.0 × 10⁸ m/s, this figure was rejected by the scientific community of the time, who assumed it to be much too high a figure because no such speed even remotely near had ever been measured.
 Self-Check
SC 1. The radius of Earth’s orbit is 1.49 × 10¹¹ m. If the eclipse of Io took 22 minutes longer, demonstrate the calculations Roemer and Huygens used to calculate the speed of light.
SC 2. The value that Roemer and Huygens measured was considered much too large. In the 1700s, what was considered really fast?
Self-Check Answers
Contact your teacher if your answers vary significantly from the answers provided here.
SC 1.
Given
Required
the speed of light
Analysis and Solution
Paraphrase
Roemer and Huygens determined the value was 2.3 × 10⁸ m/s.
SC 2. In the 1700s the fastest form of transportation was a horse, with a top speed of approximately 70 kph or 20 m/s. Even the fastest animal, a cheetah, had a maximum speed of only approximately 27 m/s. William Derham (1657–1735) was the first person to measure the speed of sound as 3.4 × 10² m/s. The speed of light measured at 3.0 × 10⁸ m/s, which was about a million times faster than sound and was fast beyond imagination.
Even today, the space shuttle, the fastest human vehicle ever, has a maximum speed of 7800 m/s, which is approximately 0.0026% or twenty-six ten-thousandths of one percent of the speed of light.
 Read
Read
In 1848, the first terrestrial attempt to measure the speed of light was done by Armand Fizeau using a toothed wheel. See his experimental design on page 649 of your textbook.
Self-Check
SC 3. What was the manipulated variable in Fizeau’s experiment?
SC 4. What was the responding variable in Fizeau’s experiment?
SC 5. What did Fizeau see during his first experiment?
Self-Check Answers
Contact your teacher if your answers vary significantly from the answers provided here.
SC 3. The manipulated variable in Fizeau’s experiment was the speed at which the toothed wheel turned. This is also called the wheel’s frequency of rotation.
SC 4. The responding variable in Fizeau’s experiment was whether or not the observer could see the light.
SC 5. In the first experiment, Fizeau would see the light reflected from the mirror. As the toothed wheel spun faster, the tooth would start to block the reflected light source so Fizeau would not be able to see the reflected light source. As the wheel continued to speed up, the light source would again become visible as the tooth would move all the way through the path of the light before the reflected light reached the toothed wheel.

Physics (Pearson Education Canada, 2007) p650, fig 13.24. Reproduced with permission.
Michelson Experiment
In 1905, Albert Michelson accurately measured the speed of light using a set of rotating mirrors. In his now-famous experiment, light was directed at an eight-sided, rotating mirror. The light was reflected from one side of the rotating mirror toward a distant curved mirror that sent the light back toward the rotating mirror. If the rotating mirror completed one-eighth of a rotation (or a multiple of 1/8) by the time the light returned, the light would be reflected to an observer (as seen in the illustration). Knowing the period of rotation that causes the light to be observed gives the time it takes the light to travel to and from the distant curved mirror. Therefore, the speed of light was equal to the distance to and from the curved mirror divided by 1/8 of the period of rotation.
Read
Read “Michelson’s Experiment” and “Example 13.1” on pages 650 and 651 of your textbook.
 Try This
TR 1. Complete “Practice Problems” 1–3 on page 650 of your textbook. Try question 3 first.
TR 2. Now that you have read about several methods scientists have used to measure the speed of light, design a procedure for your own experiment to measure the speed of light.
 Module 5: Lesson 2 Assignment
Remember to submit your answer to A 1 to your teacher as part of your Module 5: Lesson 2 Assignment.
A 1. Do Application questions 4, 7, 8, and 10 on page 652 of your textbook.
 LAB: Determining the Speed of Light Using a Microwave Oven
© trailexplorers/shutterstock
Retrieve your copy of the Module 5: Lesson 2 Assignment you saved earlier in this lesson. Before performing this lab, read “Quicklab” on page 651 of your textbook. Perform the procedure that follows.
Problem
How can a microwave oven be used to determine the speed of light?
Materials
- microwave oven
- microwave-safe dish, such as a casserole dish
- marshmallows
Procedure
- Place a layer of marshmallows in a microwave-safe dish or casserole dish, ensuring the marshmallows cover the bottom of the dish with no empty spaces between the marshmallows.
- Remove the turntable from the microwave oven.
- Place the dish in the centre of the microwave, and cook on high power until you see the marshmallows begin to melt in various locations.
- Remove the dish from the oven and let it cool.
- Measure the distance between adjacent melted spots from centre to centre. This distance is one-half the wavelength of the microwave.
- Calculate the average distance of separation for all the spots.
- Calculate the wavelength by multiplying the average separation distance by two.
- Record the frequency of the microwave oven, which is listed on the door or back of the microwave or in its documentation.
Observations
Record the distance of separation between adjacent melted spots (measured centre to centre) in a table like this one. If you do not have access to a microwave, use the values in the table.
Measurement Number |
Distance of Separation (cm) |
1 |
approx. 6.0 |
2 |
approx. 6.0 |
3 |
approx. 6.0 |
4 |
approx. 6.0 |
microwave frequency = 2.5 × 10⁹ Hz
Module 5: Lesson 2 Assignment
Remember to submit your answers to LAB 1, LAB 2, LAB 3, LAB 4, LAB 5, LAB 6, and LAB 7 to your teacher as part of your Module 5: Lesson 2 Assignment.
Analysis
LAB 1. Calculate the average distance of separation for at least four measurements.
LAB 2. Convert the average distance from centimetres to metres.
LAB 3. Determine the microwave wavelength.
LAB 4. Calculate the speed of light in metres per second using the microwave’s frequency and wavelength according to the universal wave equation (c = fλ).
Conclusions
LAB 5. According to your observations, at what speed do microwaves travel?
LAB 6. Determine the percentage of error when your measured speed is compared to the currently accepted speed of 3.00 × 10⁸ m/s.
![]()
LAB 7. Why is the prefix “micro” used to describe “microwaves”?
 Discuss

© Sergey Popov V/shutterstock
Do light and all other classifications of EMR always travel at 3.00 × 10⁸ m/s? This common value gives the speed of light when it travels in a vacuum or in air. But what happens to the speed of light when it enters water or a glass? Does the speed slow down, speed up, or stay the same? Can it be stopped? Furthermore, if the medium, such as water, in which light travels is moving, can light travel faster than 3.00 × 10⁸ m/s?
D 1. See Fizeau’s apparatus on page 649 of your textbook. How did Fizeau’s water experiment support the wave model of light? Post an explanation to the discussion questions to the discussion area for your class.
1.10. Page 3
Module 5—Wave Theory of Light
 Reflect and Connect
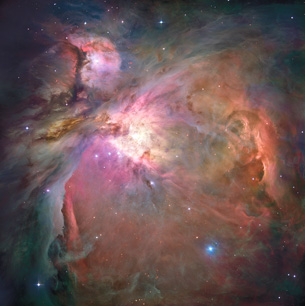
NASA, ESA, M. Robberto (Space Telescope Science Institute/ESA) and the Hubble Space Telescope Orion Treasury Project Team
When you look at the night sky, you are witnessing history. In essence, astronomy is all about ancient history. When you look at the Moon, you are seeing it as it existed 1.3 seconds in the past. Light from the Sun has to travel for eight minutes to reach Earth, so when you look at the Sun you are seeing what it really looked like eight minutes in the past.
The following table shows how old some of the images in the night sky are.
Object |
Time for the Light to Reach Earth |
Moon |
1.3 seconds |
Sun |
8 minutes |
Jupiter |
35–52 minutes (depending on orbital positions) |
Pluto |
5.5 hours (average) |
Alpha Centauri (nearest star system) |
4.3 years |
Sirius (brightest star in our sky) |
9 years |
Betelgeuse (bright star) |
430 years |
Orion Nebula |
1500 years |
Andromeda Galaxy |
2.5 million years |
According to this table, the universe is so vast that common units, such as the metre, would be awkward for describing the distance between Earth and even our nearest neighbouring star system, Alpha Centauri. In such cases, distance is reported in terms of time—as in the light year. For example, the Orion Nebula, as seen in the photo, is 1500 light years away from Earth. One light year is equivalent to the distance that light can travel through a vacuum in a one-year time interval.
1 light year = 299 792 458 m/s × 60 s/min × 60 min/hr × 24 hr/day × 365.25 days/yr
![]()
1 light year = 9.460 730 × 1015 m
Looking at more distant objects, such as the Andromeda Galaxy, reveals the nature of the universe as it existed many millions of years ago. Understanding the speed of light allows you to investigate and understand the nature and history of our universe.
 Module 5: Lesson 2 Assignment
Remember to submit the Module 5: Lesson 2 Assignment to your teacher.
1.11. Page 4
Module 5—Wave Theory of Light
 Lesson Summary
At the start of this lesson you were asked the following essential questions:
- How can you measure the speed of light using another planet?
- How can you measure the speed of light in a laboratory?
- How can you measure the speed of light using a microwave oven?
The earliest attempts to accurately measure the speed of light involved astronomical distances. The periodic eclipse of Jupiter’s moon, Io, provided the first reasonable estimate for the speed of light in a vacuum.
Years later, a more accurate measurement of the speed of light was performed by Albert Michelson. In his apparatus, a rotating mirror was used to reflect light to and from a distant mirror, allowing the measurement of very small time intervals based on the periodic rotation of an eight-sided mirror. Given data about the period of rotation and the distance separating the rotating and fixed mirror, it is possible to determine the speed of light using v = d/t.
In other experiments it is possible to measure the wavelength of EMR based on a standing wave pattern, such as the one that exists in a microwave oven. Given the wavelength and frequency, it is possible to determine the speed of light using the universal wave equation, c = fλ.
Given that light and all other classifications of EMR travel at a constant speed in air or in a vacuum, it is possible to develop precise technologies for measuring both terrestrial and astronomical distances.
1.12. Lesson 3
Module 5—Wave Theory of Light
Lesson 3—Reflection
 Get Focused
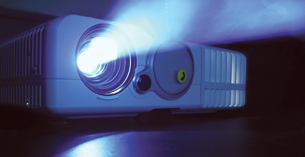
© Mikolaj Tomczak/shutterstock
This projector is an application of DLP technology.
Have you ever wondered how a small box with one really bright, white light can make the most brilliant, colourful images come to life on a movie screen? Many computer-projection systems and rear-projection televisions use digital light processing (DLP) to generate high-definition colour images that can change in an instant. At the heart of a DLP television or projection system is a digital micromirror device (DMD).
About the size of a postage stamp, a DMD contains several hundred thousand microscopic mirrors arranged in a rectangular array. Each microscopic mirror is a semiconductor-based light switch that controls one pixel in the image (a pixel is a single point in an image). The microscopic mirror can be orientated in one of two ways. In one orientation, the micromirror will reflect light from the bulb through the lens and onto a screen to turn the pixel on. In the other orientation, the microscopic mirror will reflect light away from the lens to an absorber, effectively turning that pixel in the image off. Various shades of light are achieved by continuously changing the orientation of the micromirrors between on and off. If more time is spent in the on position, the pixel becomes brighter.
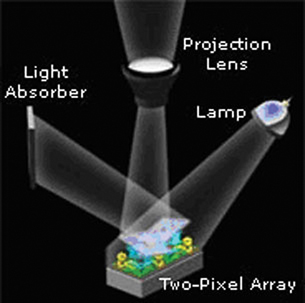
© Courtesy of Texas Instruments
Colour is introduced by placing a rotating disk with colors between the bulb and the DMD. A computer then controls each micromirror orientation so that the desired colours are reflected through the projection lens at precise times as the colour wheel rotates. The various colour images appear so quickly they appear to merge into one, fluid, full-colour image. You can learn more about the “digital micromirror device” by using these terms in an Internet search.
In digital light processing, the orientation of a mirror determines which path the light will follow. It does this in a very predictable way, making it possible to determine the orientation of the lamp, light absorber, and projection lens. The placement of these components is based on the behaviour of the light as the light reflects from the mirror according to the law of reflection. You will look at how the law of reflection can be expressed graphically using light ray diagrams and, mathematically, using equations.
In this lesson you will answer the following essential questions:
- What is regular and diffuse reflection?
- What is the law of reflection?
- How do I draw a ray diagram, and what does it represent?
- How are images formed in flat and curved mirrors, and how are ray diagrams used to predict and explain their characteristics?
 Module 5: Lesson 3 Assignment
Your teacher-marked Module 5: Lesson 3 Assignment requires you to submit responses to the following questions:
- Laboratory—LAB 1, LAB 2, LAB 3, and LAB 4
- Assignment—A 1, A 2, A 3, A 4, and A 5
- Discuss—D 1
The other questions in this lesson are not marked by the teacher; however, you should still answer these questions. The Self-Check and Try This questions are placed in this lesson to help you review important information and build key concepts that may be applied in future lessons.
After a discussion with your teacher, you must decide what to do with the questions that are not part of your assignment. For example, you may decide to submit to your teacher the responses to Try This questions that are not marked. You should record the answers to all the questions in this lesson and place those answers in your course folder.
1.13. Page 2
Module 5—Wave Theory of Light
Explore

© Image courtesy of shutterstock.com
The Law of Reflection
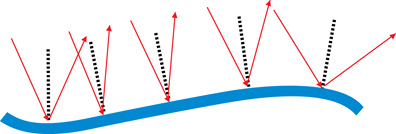
In the photo on the right, light is reflected from a mountain stream. Notice that the image seen in the centre, where the water forms a smooth, flat surface, is very clear. Also observe that the image is lost near the edges of the stream where the water is disturbed by the shoreline. Can this help explain how and why an image forms as light reflects from a surface?
Light travels in straight lines, as you learned in Lesson 1. The oscillating, perpendicular electric and magnetic fields propagate at right angles to both fields in a straight line. This is called rectilinear propagation. When the EMR wave encounters a smooth, flat surface, such as the water in the centre of the stream, it exhibits regular, specular reflection.
Specular reflection can be illustrated using a ray diagram, which identifies the path of the light using arrows.
Notice that the organization of the light rays is maintained, but the orientation is reversed.
A ray diagram can also explain why an image does not form near the sides of the stream where the surface is rough. This type of reflection is called diffuse or irregular reflection.

Predicting the path of the reflected light, for both regular and irregular reflection, is based on the law of reflection. The simulation Light Reflection will be used to explore the law of reflection.
- Open the Light Reflection simulation, and
select one mirror (
 ) mode.
 - Click the “Show Calcs” button (
 ). A box with the Θin and Θout values will appear.
You should see an image similar to the one shown here. Take note of the labels and definitions that do not appear on the simulation display.
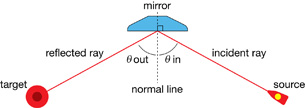
incident ray: an incoming ray of light
reflected ray: an outgoing ray of light
Θin: the angle between the incident ray and the normal line
Θout: the angle between the reflected ray and the normal line
 Module 5: Lesson 3 Assignment
Remember to submit your answers to LAB 1 and LAB 2 to your teacher as part of your Module 5: Lesson 3 Assignment.
LAB 1. The mirror angle can be adjusted using the angle slider (![]() ). Adjust the mirror position by clicking and dragging the mirror on the screen.
). Adjust the mirror position by clicking and dragging the mirror on the screen.
Adjust the position and/or angle of the mirror. Record the values for Θin and Θout for five different rays when the mirror is at various angles or positions. Record your observations.
Θin |
Θout |
|
|
|
|
|
|
|
|
|
|
LAB 2. The law of reflection is one of the most basic of all laws in optics. It relates the angle of incidence to the angle of reflection. On the basis of the investigation that you just performed, state the law of reflection.
 Try This
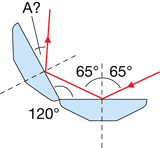
TR 1. Two mirrors are joined at a 120°-angle (as shown in the diagram). An incident ray contacts the first mirror at an angle of 65° to the normal. Calculate the angle, A, that the ray has with respect to the normal line of the second mirror. Hint: Remember that the sum of the interior angles in a triangle is 180°.
TR 2. Orient both mirrors so that multiple reflections occur and the final reflected ray is still travelling in its original direction. How must the mirrors be oriented for this to happen?
TR 3. Orient the mirrors so that they meet at a right angle (as shown in the ray diagram given). Mirrors in this configuration form what is called a corner reflector. Position the mirrors so that a multiple reflection occurs (e.g., the ray hits both surfaces), but be sure to maintain the 90° orientation between the mirrors. What special property does the direction of the reflected ray have?
TR 4. Corner reflectors are commonly used in reflective tape on clothing and in roadside reflectors. Explain why this technology is particularly effective for nighttime visibility applications.
1.14. Page 3
Module 5—Wave Theory of Light
 Read
Read
Read “The Law of Reflection” on pages 653–654 in your textbook.
 Try This
TR 5. Why is the angle of incidence and reflection measured from the normal instead of from the mirror’s surface? (Hint: Look at the specular reflection and diffuse reflection diagrams.)
Image Formation in Plane Mirrors
Ray diagrams, similar to those that have been used in the previous activities, can illustrate the process of image formation. Consider two light rays originating from the top of a tree by a smooth lake. Constructing a ray diagram that illustrates the law of reflection predicts that an image of the tree will form upside down. The dotted lines “appear” to your eyes to be rays of light from the image, but they don’t actually come from the image. Since the two light rays only appear to have originated from a single point, the image formed in this ray diagram is said to be a “virtual image.”

Any image formed by a plane mirror is a virtual image. Its orientation and size may be predicted by constructing a simple ray diagram based on the law of reflection.
Try This
TR 6. Complete "QuickLab" on page 655 of your textbook. Answer questions 1, 2, 3, and 4.
TR 7. Using page 656 of your textbook, complete the following table by defining each image characteristic for plane mirrors. The definitions are found in the text and in “Table 13.2” in the textbook. “Table 13.2” gives you vocabulary you should use when discussing these characteristics.
Image Characteristic |
Definition |
magnification |
|
attitude |
|
position |
|
real image |
|
virtual image |
|
© Danger Jacobs /shutterstock
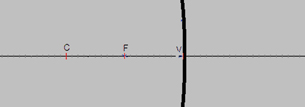
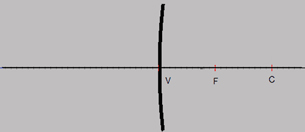
Image Formation for Curved Mirrors
Images formed by curved mirrors look different than those from flat mirrors. The process of image formation, however, is easily demonstrated graphically by ray diagrams, or mathematically using equation, both of which obey the law of reflection.
Similar to flat mirrors, the real or virtual image produced by a curved surface can be described by magnification, attitude (erect or inverted), and position. A curved mirror can be formed by cutting off a section of a spherical mirror. The inside surface would be a converging mirror. It has a concave surface that reflects rays to a central focal point. The outside surface would be a diverging mirror. It has a convex surface that causes the reflected light to spread out. See "Figure 13.38" on page 659 in your textbook.
Read
Read “Image Formation in a Curved Mirror” on page 657 of your textbook.
TR 8. Using “Figure 13.36” on page 657 of your textbook as a guide, complete the following table:
Term |
Definition |
centre of curvature (C) |
|
radius of curvature (r) |
|
vertex (V) |
|
principal axis (PA) |
|
principal focal point (F) |
|
focal length (f) |
|
© F. Hwang, NTNU JAVA Virtual Physics Laboratory. Used with permission.
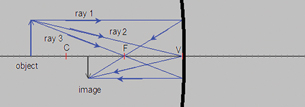
Ray diagrams can be used to explain and predict how an image forms in a curved mirror. Similar to that of a flat mirror ray diagram, several rays are sketched to determine the location, size, orientation, and type of image. Generally, three rays are used to follow the path of the light. Note that there are many rays that make the image, but only a few rays are required to identify its location and characteristics.
In the ray diagram for a concave mirror on the right, ray 1 travels parallel to the principal axis and is reflected through the mirror’s focal point. Ray 2 is incident to the mirror’s vertex. At the vertex, the surface of the mirror is perpendicular to the principal axis, so the angles of incidence and reflection are equal. Ray 3 travels through the focal point and is reflected parallel to the principal axis. These guidelines for drawing ray diagrams are summarized in the following table.
Ray Number |
Incident Ray |
Reflected Ray |
1 |
parallel to principal axis |
through F |
2 |
to vertex |
Θr = Θi |
3 |
through F |
parallel to principal axis |
A real image is formed where the rays meet, or converge. A virtual image is formed if the rays “appear” to have converged at some point.
The image in this figure is real (the light rays converge at the image), inverted (upside down relative to the object), diminished in size, and located beyond the focal point.
A simulation will be used to explore the image characteristics for both concave and convex mirrors.
 Module 5: Lesson 3 Assignment
Remember to submit your answers to LAB 3 and LAB 4 to your teacher as part of your Module 5: Lesson 3 Assignment.
LAB 3. Open the Thin Lens simulation and select “Mirror” from the drop-down menu.
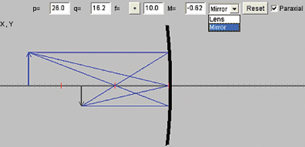
© F. Hwang, NTNU JAVA Virtual Physics Laboratory. Used with permission.
Click the object arrow and move it to various locations on the principal axis. Using the simulation as a guide, draw ray diagrams and describe the image characteristics when the object is located at the positions listed in Table 1.
Table 1: Using Ray Diagrams to Predict Image Characteristics: Converging Mirror
| Object Position | Ray Diagram |
Image Characteristics |
very far away (very left side) |
|
|
outside C |
|
|
at C |
|
|
between C and F |
|
|
at F |
|
|
inside F |
|
|
© F. Hwang, NTNU JAVA Virtual Physics Laboratory. Used with permission.
LAB 4. Switch the mirror in the simulation to a diverging, convex mirror by making the focal length negative ![]() . Complete Table 2. For image characteristics, record real or virtual, attitude, magnification, and position relative to mirror surface.
. Complete Table 2. For image characteristics, record real or virtual, attitude, magnification, and position relative to mirror surface.
Table 2: Using Ray Diagrams to Predict Image Characteristics: Diverging Mirror
| Object Position | Ray Diagram |
Image Characteristics |
very far away (very left side) |
|
|
close to the mirror |
|
|
© F. Hwang, NTNU JAVA Virtual Physics Laboratory. Used with permission.
1.15. Page 4
Module 5—Wave Theory of Light
 Read
Read
Read pages 658–659 of your textbook for more explanation and help drawing ray diagrams. Note that in the textbook, the ray through the vertex is replaced with a ray through the centre point.
The Mirror Equation
Ray diagrams are a useful tool for revealing image characteristics using the law of reflection and basic geometry. This same tool can also be used to derive a mathematical equation for finding and identifying image characteristics. The derivation of the mirror equation can be seen on pages 661–662 of your textbook.
The mirror equation relates the focal length of a curved mirror to the image and object positions.
Expressed as an equation, it is as follows:
![]()
| Quantity | Symbol |
SI Unit |
object position relative to the vertex |
do |
m |
image position relative to the vertex |
di |
m |
focal length |
f |
m |
The image and object characteristics are also described in these equations using sign conventions.
- Positive distances describe real images and objects.
- Negative distances describe virtual images and objects.
- Converging mirrors have a real focal length that is positive.
- Diverging mirrors have a virtual focal length that is negative.
Magnification is the ratio of the image height to the object height. A negative sign is used to accommodate the preceding sign conventions.
- Negative height describes an inverted image or object.
- Positive height describes an upright image or object.
|
Quantity |
Positive if |
Negative if |
Attitude |
h |
erect |
inverted |
Image Type |
d |
real |
virtual |
Mirror Type |
f |
converging (convex) |
diverging (concave) |
Note: If the image type is real, the mirror type must be convex.
Read
See “Example 13.2” on page 664 of the textbook for an example of how to use the mirror equation.
 Module 5: Lesson 3 Assignment
Remember to submit your answers to A 1, A 2, A 3, A 4, and A 5 to your teacher as part of your Module 5: Lesson 3 Assignment.
A 1. Complete “Concept Check” questions 1 and 2 on page 662 of your textbook.
A 2. A converging mirror has a focal length of 20 cm. The object is placed 30 cm in front of the mirror. Where will the image appear?
A 3. A diverging mirror has a focal length of 0.12 m. The image is located 0.070 m from the mirror. Where is the object located?
A 4. A student places a 5.0-cm-tall object 15 cm away from a converging mirror. The image is 12 cm from the mirror. What is the height and orientation of the image?
A 5. A 1.5-cm-tall object is placed 12 cm away from a converging mirror. The image is magnified to four times its original height and is inverted. What is the mirror’s focal length?
 Discuss
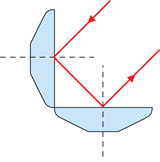
The Newtonian telescope is also known as the poor man’s telescope. It is a reflecting telescope that was invented by Sir Isaac Newton in 1689. It consists of a large tube open at one end with a large converging mirror at the opposite end. Light from a distant object enters the tube and is reflected from the surface of the large, concave, primary mirror. The reflected light is then incident on a small, flat, secondary mirror that redirects the light into an eyepiece for viewing. The geometric location of the secondary mirror is related to the curvature of the primary mirror.
Module 5: Lesson 3 Assignment
Remember to submit your answer to D 1 to your teacher as part of your Module 5: Lesson 3 Assignment.
D 1. Work with another student to determine where, exactly, the secondary mirror should be placed so that the telescope produces a clear image of the distant object. Use a ray diagram to answer this question, and design an experiment to determine the focal length of the large, primary mirror. Your design should include the problem, prediction, materials, procedure, and analysis required to answer the problem.
Discussion Scoring Guide
| Principles involved: scientific method, lab procedures, reflection, and ray diagrams | ||||
Criteria |
Level 1 |
Level 2 |
Level 3 |
Level 4 |
Knowledge |
||||
| Demonstrates understanding of the situation, physics principles and technology, and their connections. | Demonstrates a vague and sometimes incorrect understanding of the physics principles involved. Obvious irrelevant or missing information. |
Demonstrates a basic understanding of the physics principles involved. May exhibit minor mistakes or vague information or application to the situation. |
Demonstrates a good understanding of the physics principles involved and applies them properly to the given situation. All necessary information is given. |
Demonstrates a superior understanding of the physics principles involved and their application to the situation. All applications are considered in detail. |
Reflection |
||||
The post shows reflection on one’s own and other students’ work. Contributes to the group discussion. |
Does not make an effort to participate. Seems indifferent to discussion. |
Occasionally makes meaningful reflections on the group’s efforts or discussions. Marginal effort is shown to become involved with the group or discussion. |
Frequently makes meaningful reflections on the group’s efforts and presents relevant viewpoints for consideration by the group. Interacts freely with group members. |
Regularly attempts to motivate the group discussion and delve deeper into concepts. Interacts freely and encourages all group members. |
Content and presentation of discussion summary |
||||
The information is logically arranged in a clear and concise manner. |
The information is poorly organized with many concepts implied. Irrelevant or rambling sentences make reading difficult. |
The information is somewhat organized with implied concepts. Excessive words or awkward sentences are used, which hinders reading. |
The information is well-organized and logically arranged. All concepts are explicitly explained. There are a few awkward but understandable sentences. |
The information is well-organized and very easy to understand. Well-worded sentences make reading pleasurable. |
1.16. Page 5
Module 5—Wave Theory of Light
 Reflect and Connect
Robert Glusic/Photodisc/Getty Images
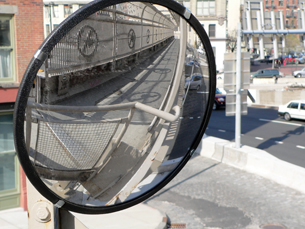
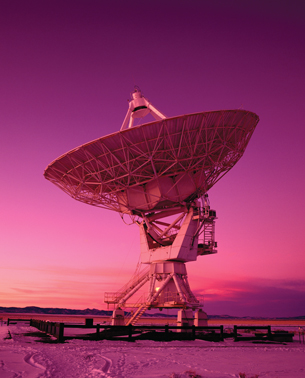
Large reflecting telescopes are related to television projection systems by the law of reflection. They are both examples of technology based on the law of reflection. Can you think of other devices designed around the law of reflection? Can these devices be understood easily with ray diagrams? For example, mirrors work well to reflect visible light, but are there other materials that act like mirrors for other types of EMR, such as those used for radar and satellite communication?
The photo on the right shows a satellite communication dish. Notice that it is very similar in style to that of a Newtonian telescope. Can you tell where the focal point is? What kind of an “image” forms there?
Satellite dishes are a good illustration of how much technology has evolved over the last 300 years without deviating from the laws of reflection.
 Module 5: Lesson 3 Assignment
Remember to submit the Module 5: Lesson 3 Assignment to your teacher.
1.17. Page 6
Module 5—Wave Theory of Light
 Lesson Summary
At the start of this lesson you were asked the following essential questions:
- What is regular and diffuse reflection?
- What is the law of reflection?
- How do I draw a ray diagram, and what does it represent?
- How are images formed in flat and curved mirrors, and how are ray diagrams used to predict and explain their characteristics?
Specular (regular) and diffuse reflection can be illustrated using ray diagrams, which use arrows to identify the path of the light.

All reflections are governed by the law of reflection, which states that the angle of incidence is equal to the angle of reflection measured from the normal to the surface.
Ray diagrams are based on the law of reflection, which states that the angle of reflection relative to the normal line is equal to the angle of incidence relative to the normal line. Ray diagrams are used to predict the position and characteristics of images in both plane (flat) and curved mirrors.
Images are defined by their magnification (relative to the object), attitude (up or down relative to the principal axis), and position (relative to the mirror surface). They are also classified as being real, where light rays converge, or virtual, where light rays only appear to have converged.
The mirror equation also describes image formation. It is based on the geometry of ray diagrams and relates the focal length of a curved mirror to the image and object positions according to ![]() . In addition, the magnification of an image is the ratio of the image height to the object height according to
. In addition, the magnification of an image is the ratio of the image height to the object height according to ![]() . Positive and negative sign conventions are used in conjunction with these equations to describe all the characteristics of the image.
. Positive and negative sign conventions are used in conjunction with these equations to describe all the characteristics of the image.
Many of today’s modern technologies have evolved from our understanding of reflection. Digital light processing, telescopes, and satellite dishes are all excellent applications of the law of reflection.
Lesson Glossary
incident ray: an incoming ray of light
normal line: a straight, dashed line drawn perpendicular to the mirror surface at the point of reflection
reflected ray: an outgoing ray of light
Θi (Θin): the angle between the incident ray and the normal line
Θr (Θout): the angle between the reflected ray and the normal line
1.18. Lesson 4
Module 5—Wave Theory of Light
Lesson 4—Refraction
 Get Focused
Look very closely at these photos. The drinking straws appear to be disconnected, or shifted horizontally where they exit the water. When the straws are removed from the water, they are straight.
Try this now if you have a clear glass and some water. Partially submerge various objects. You will find that any partially submerged object will appear to disconnect or shift at the water line.

© Adam Gryko /shutterstock

© cheyennezj /shutterstock
This visual effect is caused by refraction, a process that occurs as light, or any other form of EMR, passes from one medium to another. In this example the light reflected from the straw passes from water into air, where you observe refraction. As light moves from the water into the air, it undergoes refraction, which is a change in its direction.
In this lesson you will answer the following essential questions:
- What is the cause of refraction?
- What is an index of refraction, and how does Snell’s Law use it to describe refraction mathematically?
- What is total internal reflection? How does it relate to the critical angle?
- How does a prism produce a rainbow, and how is a prism similar to a natural rainbow?
 Module 5: Lesson 4 Assignment
Your teacher-marked Module 5: Lesson 4 Assignment requires you to submit responses to the following:
- Laboratory—LAB 1, LAB 2, LAB 3, LAB 4, LAB 5, LAB 6, and LAB 7
The other questions in this lesson are not marked by the teacher; however, you should still answer these questions. The Self-Check and Try This questions are placed in this lesson to help you review important information and build key concepts that may be applied in future lessons.
After a discussion with your teacher, you must decide what to do with the questions that are not part of your assignment. For example, you may decide to submit to your teacher the responses to Try This questions that are not marked. You should record the answers to all the questions in this lesson and place those answers in your course folder.
1.19. Page 2
Module 5—Wave Theory of Light
 Explore

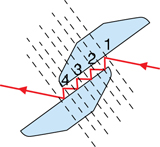
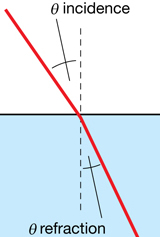
Refraction is a change in the direction of a light wave caused by a change in its speed as the light wave passes at an angle from one medium to the next. In the ray diagram example, a light ray is incident on the surface of water. Some of the light is reflected and some of the light slows down as it enters the water and is refracted.
According to the law of reflection, the angle of reflection is identical to the angle of incidence.
The angle of refraction, however, is not the same as the angle of incidence. It is determined by Snell’s Law. The simplest way to write Snell’s Law is as follows:
![]() , where n is the index of refraction
, where n is the index of refraction
The simple form of Snell’s Law assumes that the medium the light is leaving is air. The refractive index of air is 1.0003, which is close to, and usually assumed to be the same as, the refractive index of a vacuum (n = 1.000). This is true because the speed of light in air is nearly identical to its speed in a vacuum so, as it passes from air into a vacuum, it is only refracted by a very small amount, making the ratio of the ![]() equal to 1. The amount of refraction in other materials, as light enters them from air or a vacuum, is much more and leads to higher indexes of refraction. Therefore, the index of refraction is a relative measure of how much the light changes speed and is bent as it moves between two mediums.
equal to 1. The amount of refraction in other materials, as light enters them from air or a vacuum, is much more and leads to higher indexes of refraction. Therefore, the index of refraction is a relative measure of how much the light changes speed and is bent as it moves between two mediums.
refraction: a change in the direction of a wave due to a change in its speed
Snell’s Law: for any angle of incidence greater than zero, the ratio of
![]()
refractive index: a ratio comparing the speed of light in a vacuum to its speed in a given medium
Table 1: Absolute Refractive Indexes of Some Common Materials
| Medium | Index of Refraction |
vacuum |
1.0000 |
air |
1.0003 |
ice |
1.31 |
water |
1.33 |
quartz glass |
1.47 |
crown glass |
1.52 |
lucite (plexiglass) |
1.52 |
diamond |
2.42 |
 Try This
TR 1. Based on Table 1, in which medium is light most refracted as it enters the medium from air?
A useful rule of thumb to remember concerns how light bends as it either enters a region of increased refractive index or vice versa. You can discover this rule using this Light Refraction simulation.
Once the simulation is open, do the following:
- Click the “Add” button (
 ). This will add a second medium to the display window (medium 1 and medium 2), both with a refractive index (n) = 1.0.
- Double-click anywhere in the bottom layer and enter the refractive index (n) of water 1.33.
- Click and drag the laser into the top layer. Next, click the tip of the laser and point it down into the water layer. Vary the angle of the beam by adjusting the laser’s direction. Note the way in which the light bends as it enters the denser (water) layer. (Toward or away from the normal?)
- Move the laser pointer to the water layer and point it upward into the air layer. Vary the angle and note the way in which the light bends as it enters the rarer (air) layer. (Toward or away from the normal?)
 Module 5: Lesson 4 Assignment
Remember to submit your answers to LAB 1 to your teacher as part of your Module 5: Lesson 4 Assignment.
LAB 1. Use the Light Refraction simulation to determine the answer to the following two questions:
- When light travels from a low-index medium (fast) into a high-index medium (slower), does the ray bend toward or away from the normal?
- When light travels from a high-index (slower) medium into a low-index (fast) medium, does the light ray bend toward or away from the normal?
 Self-Check
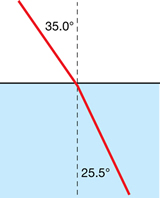
SC 1. A laser is directed into a pool of water (nwater = 1.33). The beam contacts the air-water interface with an angle of incidence equal to 35.0°. Using the simple form of Snell’s Law, calculate the angle of refraction (relative to the normal) with which it travels through the water. Show your calculations and label the ray diagram showing the angle of incidence and angle of refraction. Verify your answer using the Light Refraction simulation.
Self-Check Answers
Contact your teacher if your answers vary significantly from the answers provided here.
SC 1.
Given
![]()
Required
the angle of refraction, n2
Analysis and Solution
Paraphrase
The angle of refraction is 25.5°.
A More General Form of Snell’s Law
The general form of Snell’s Law is used to describe the change in direction of light when it moves between any two media and not just out of air. The Light Rerfraction simulation will be used to determine the general form of Snell’s Law.
Module 5: Lesson 4 Assignment
Remember to submit your answer to LAB 2 to your teacher as part of your Module 5: Lesson 4 Assignment.
LAB 2. Set up the Light Refraction simulation with two refractive layers. You will need to vary the refractive index for each layer and the angle of the light ray in order to complete Table 2. Select "Show Calcs" (![]() ) to assist in recording angles. Get as close to the θin as you can, but record the actual value that you use.
) to assist in recording angles. Get as close to the θin as you can, but record the actual value that you use.
Table 2: Refraction Data
| n1 | θin |
n1sinθin |
n2 |
θout |
n2sinθout |
1.20 |
45° |
|
1.40 |
|
|
1.30 |
32° |
|
1.66 |
|
|
1.45 |
45° |
|
1.23 |
|
|
1.51 |
40° |
|
1.00 |
|
|
1.65 |
45° |
|
1.80 |
|
|
According to your data in Table 2, which two values are always equal to one another?
Snell’s Law: The general form of Snell’s Law relates the ratio of the indexes of refraction to the ratio of the sine of the angles of incidence and refraction.
Expressed as an equation,
![]()
| Quantity | Symbol | SI Unit |
| refractive index of the first medium | n1 | coefficient (no units) |
| refractive index of the second medium | n2 | coefficient (no units) |
| angle of incident (measured from the normal) | θ1 | degrees |
| angle of refraction (measured from the normal) | θ2 | degrees |
Try This
TR 2. Snell’s Law may also be written as n1sinθ1 = n2sinθ2. Does the data collected in Table 2 support the general form of Snell’s Law? Explain and provide two sample calculations to support your explanation.
Self-Check
SC 2. A laser is submerged in oil (noil = 1.48) and directed into a pool of water (nwater = 1.33) with an angle of incidence equal to 35.0°. Calculate the angle of refraction. Show your calculations and use the Light Refraction simulation to verify your answer.
Self-Check Answers
Contact your teacher if your answers vary significantly from the answers provided here.
SC 2.
Given

Required
the angle of refraction, θ2
Analysis and Solution
Paraphrase
The angle of refraction is 39.7°.
Try This
TR 3. Complete “Practice Problems" 1–4 on page 668 of your textbook.
Snell’s Law can be expanded when you consider light as a transverse wave. In the expanded form, frequency, wavelength, and speed are related according to the following equation:
![]()
 Read
Read
Read “Snell’s Law, Refraction, and Wavelength” on pages 669–670 for a derivation of this equation based on the transverse wave model of EMR.
Try This
TR 4. Complete “Practice Problems” 1(a), 1(b), 2, and 3 on page 670 of your textbook. Note: Index of refraction values are given on page 667.
1.20. Page 3
Module 5—Wave Theory of Light
 LAB: Determining the Refractive Index of a Variety of Materials
Retrieve your copy of the Module 5: Lesson 4 Assignment.
Read “Inquiry Lab” on page 671 of your textbook before performing this lab. See the two images that follow to collect your observations. The same wavelength of light was used. The lines are coloured to let you match the incident ray with the refracted ray. The semi-circular dish (light blue) is placed on a circular polar paper that acts like a 360° protractor. The polar paper has a radial line every ten degrees. You will have to use a real protractor to measure or you will estimate the values between the lines.
Note: Don’t forget to measure your angles from the normal to the surface.
Water Refractions
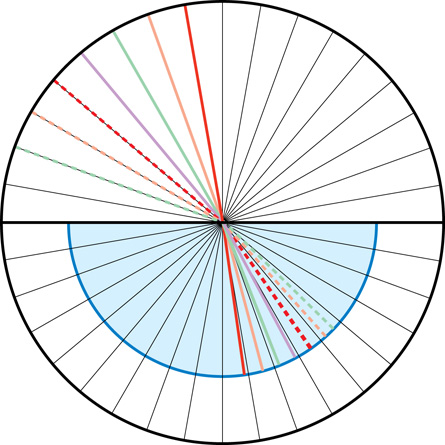
Ethanol Refractions
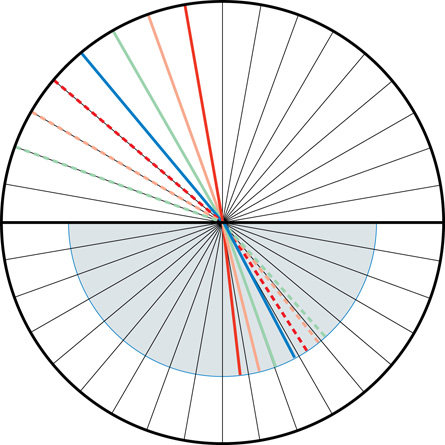
Problem
What are the refractive indexes of water and ethanol?
Materials
- polar coordinate paper
- graphing paper
- water
- ethanol
- single-slit ray box or laser
- semicircular plastic dish
Procedure
Follow the Procedure on page 671 of your textbook. If you do not have access to a supervised laboratory, use the diagrams to fill in the table and to answer the questions that follow.
Observations
 Module 5: Lesson 4 Assignment
Remember to submit your answers to LAB 3, LAB 4, and LAB 5 to your teacher as part of your Module 5: Lesson 4 Assignment.
LAB 3. Use the Water Refractions diagram and the Ethanol Refractions diagram to gather data regarding water refractions and ethanol refractions. Record your data for water refractions and your data for ethanol refractions in a table like the following. (Note: You will need two tables.)
θ1 |
θ2 |
sin θ1 |
sin θ2 |
|
10 |
|
|
|
|
20 |
|
|
|
|
30 |
|
|
|
|
40 |
|
|
|
|
50 |
|
|
|
|
60 |
|
|
|
|
70 |
|
|
|
|
Graph
LAB 4. Plot a graph of the sine of the angle of incidence versus sine of the angle of refraction. Plot a line for water and a line for ethanol. Calculate the slope of each line on this graph.
Calculations and Questions
LAB 5. Complete “Analysis” questions 3–8 on page 671 of your textbook.
Total Internal Reflection
According to the second rule of thumb for refraction, when light travels from a high-index, optically dense slow medium into a low-index, optically les dense faster medium, the ray bends away from the normal. If the angle of refraction reaches or exceeds 90°, the beam is unable to escape the high-index medium. This phenomenon is called total internal reflection and it can be demonstrated using the Light Refraction simulation.
Module 5: Lesson 4 Assignment
Remember to submit your answers to LAB 6 to your teacher as part of your Module 5: Lesson 4 Assignment.
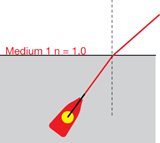
LAB 6. Using the Light Refraction simulation, set the refractive index of the top layer to equal 1.00 and the refractive index of the bottom layer to equal 1.33. Position the laser pointer in the bottom layer near the left side and project it upward (as shown on the right).
- Complete Table 3 by rotating the laser pointer to the angles specified and calculating the angle of refraction using Snell’s Law. (It has been manipulated to solve for the angle of refraction.) Note: Refraction will not occur for all the angles in the table.
Table 3: Total Internal Reflection Data
| θ1 |
|
θ2 |
35° |
|
|
40° |
|
|
45° |
|
|
50° |
|
|
55° |
|
|
- What is the maximum possible angle of incidence that still causes refraction? Describe what happens to the ray of light if the angle of incidence exceeds this value.
The maximum possible angle of incidence that will still cause refraction is known as the critical angle. The critical angle can be calculated by assuming the angle of refraction is 90°. At this point, the ray is refracted parallel to the interface between the mediums. Any increase in the incident angle will cause the refracted ray to no longer refract but to bounce, or reflect, back into the higher index medium.
1.21. Page 4
Module 5—Wave Theory of Light
 Read
Read
Read “Total Internal Reflection” on pages 672–673 of your textbook for more information on critical angles.
 Try This
TR 5. Manipulate Snell’s Law to give an expression that will solve for the critical angle:
![]()
TR 6. Calculate the critical angle for water. Is this critical angle supported by the data collected in Table 3? Verify your answer using the Light Refraction simulation.
Applications of Total Internal Reflection: Light Pipes and Mirages
Light pipes (and fibre optics) are very common in medicine, science, and industry. They work by trapping light using total internal reflection. You can easily produce a light pipe using a long Lucite rod. Lucite is a common type of plastic that has a relatively high index of refraction at 1.49.
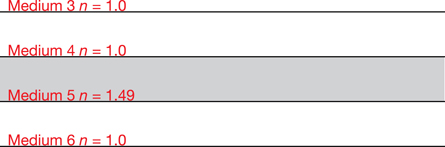
SIM 1. Use the Light Refraction simulation to build a light pipe similar to that shown here. Position the laser pointer in the Lucite layer (n = 1.49) and point it so that total internal reflection occurs. Explain how it traps the light.
SIM 2. Suppose you submerged your Lucite light pipe in water. Would that improve or degrade the performance of your light pipe? Explain.

© vera bogaerts/shutterstock
An old joke says, "Is that a mirage or am I seeing things?" In fact, a mirage is not an optical illusion. You really are seeing something when you see a mirage. One of the most common mirages is the wet appearance of a prairie road or field on a hot summer day. This happens because the air layer above the ground is very hot and has a slightly lower refractive index than the cooler air just above it. Such a refractive index gradient is illustrated by the following ray diagram and observed in the photo on the right.
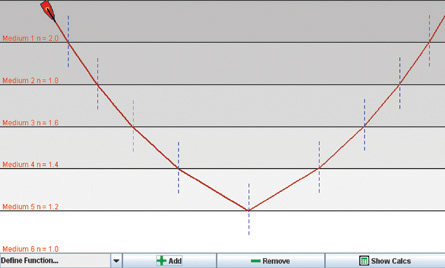
SIM 3. Mirage conditions can be set up in the Light refraction simulation. Use the laser pointer as the Sun and set up multiple layers with the upper layer having the highest index of refraction and the lower ones with progressively smaller indexes of refraction. Can you produce a mirage? What are you seeing when you think you are seeing water on the road? Sketch how this mirage is formed. Why do you see a mirage? See “Figure 13.45” on page 667 of your textbook.
The Refraction of White Light in a Prism: Dispersion
Triangular prisms can be used to separate white light in its spectral components (colours). This occurs because the angle of refraction depends on the index of refraction, which is unique for each wavelength.
Recall that in the expanded form of Snell’s Law, the wavelength and index of refraction are related to one another as follows:
![]()
When any light wave enters the prism from the air, its wavelength is compressed as it slows down. And since the refractive index of air (n1) is equal to 1.0, the ratio of the wavelength before and after the refraction determines the refractive index of the medium for each wavelength.
![]()
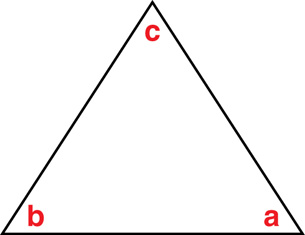
Recall the basic properties of all triangles:
- The sum of the interior angles in a triangle is 180°. According to the noted triangle, a + b + c = 180°.
- The complimentary angles are angles that add to form a 90° angle or right angle.
- The supplementary angles are angles that add to form a 180° angle or a straight angle.
Try This
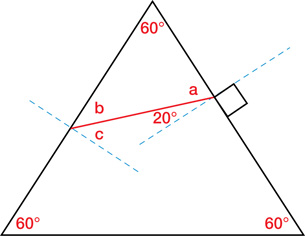
TR 7. In the diagram on the left, the blue dashed lines represent surface normals to the triangle. These lines form 90° angles with the respective faces they pass through. Explain how you know that angle a = 70°.
TR 8. Determine angle b if angle a is 70°.
TR 9. Knowing angle b, determine angle c.
Tracing a Ray Through a Prism to Verify Dispersion
A simulation will be used to verify ray diagrams and calculations that demonstrate that different colours of light will be separated as they pass through a prism. Open the Prism simulation and select “One Prism” to complete the following activities. Note that each prism in the simulation is an equilateral prism with 60° angles at each corner.
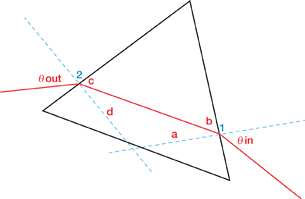
SIM 4. Set the refractive index of the prism to n = 1.55, and rotate the prism to an angle of 100° as shown in the diagram on the right. This will make the incident angle for the ray entering the prism θin = 43.68°.
- Using Snell’s Law and the refractive index of air (n = 1.00), show the calculations for determining angle a. Verify your answer by pressing “Show Calcs” (
 ).
).
- Using the techniques developed in recent Try This activities and the fact that the prism is an equilateral triangle, calculate the angles b, c, d, and θout. Verify your final answer on the simulation by pressing “Show Calcs” ().
 Module 5: Lesson 4 Assignment
Remember to submit your answer to LAB 7 to your teacher as part of your Module 5: Lesson 4 Assignment.
LAB 7. Consider white light entering an equilateral prism at a 50° angle with respect to the normal of one of its faces. If the index of refraction is 1.66 for blue light and 1.62 for red light, how far apart, in degrees, will the two rays emerge? Trace the path of the blue and red light on each of these prisms. Sketch and label all angles, and determine the angular separation between the blue and red rays as they leave the prism. Use the Prism simulation to verify your answer.


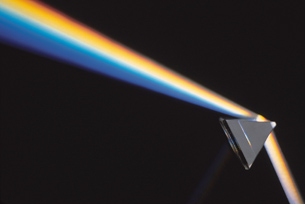
© 2009 Jupiterimages Corporation
Read
Read “Prisms—Dispersion of White Light” on pages 675–676 of your textbook for more information on the composition of white light.
1.22. Page 5
Module 5—Wave Theory of Light
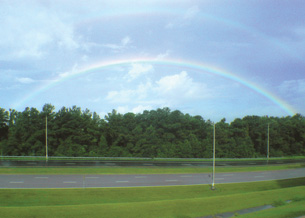
© Tad Denson/shutterstock
 Reflect and Connect
Seen here is a double rainbow, a fantastic, natural demonstration of refraction resulting in the dispersion of white light. This rainbow appears to be very close to the photographer, compliments of the light rain and mist coming from above. The illusion is produced when sunlight is incident on water droplets in the atmosphere.
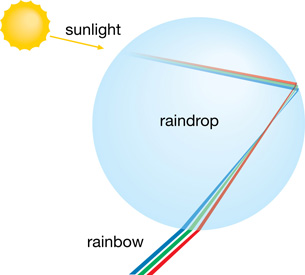
The various wavelengths of visible light in sunlight are refracted as they enter the raindrop. Each wavelength is reflected at the back of the droplet reversing the order of the spectrum as it passes through an internal focal point before being refracted a second time when it emerges. If this process occurs in many water droplets simultaneously, the optical illusion of a rainbow can be observed. The illusion only appears to exist at a particular location in the sky or land, but this position depends on the position of the Sun, water, and observer. As the observer moves, the rainbow moves with the observer, so you will never get to the end of a rainbow to recover a pot of gold!
Reflect on the Big Picture
Do refraction, total internal reflection, and dispersion support the wave model of light? The bending or refracting of light can be understood in terms of a transverse wave. Recall that the universal wave equation relates the speed, wavelength, and frequency of a transverse wave:
v = fλ
Consider a transverse light wave travelling from air into water. As the light wave enters the water, it slows down and the wavelength gets compressed. The frequency, however, remains unchanged, since the waves do not pile up at the boundary. The number of waves arriving at the boundary each second is equal to the number of waves leaving the boundary every second. Therefore, the frequency of the wave is constant as the wavelength shrinks. This helps us understand the change in speed when EMR is considered as a transverse wave. If the wavelength shrinks and the frequency remains constant, then the speed must also be reduced according to the universal wave equation.
As the wave fronts are compressed and slowed in the water, they change direction relative to the arriving, uncompressed, faster wave fronts still in the air. To visualize this in terms of wave fronts, imagine a line of 100 people all holding hands and running on the beach. If those runners closest to the water enter it and slow down, what happens to the shape of the line?
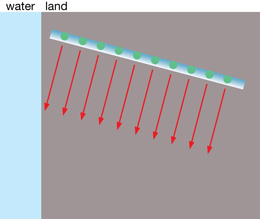
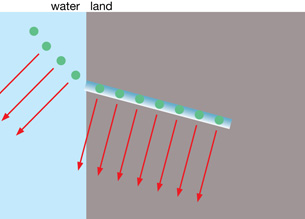
 Module 5: Lesson 4 Assignment
Remember to submit the Module 5: Lesson 4 Assignment to your teacher.
1.23. Page 6
Module 5—Wave Theory of Light
 Lesson Summary
At the start of this lesson you were asked the following essential questions:
- What is the cause of refraction?
- What is an index of refraction, and how does Snell’s Law use it to describe refraction mathematically?
- What is total internal reflection? How does it relate to the critical angle?
- How does a prism produce a rainbow, and how is the prism similar to a natural rainbow?
Refraction is a change in the direction of a light caused by a change in its speed as it passes at an angle from one medium to the next.
The index of refraction is a relative measure of how fast a light wave travels in a specific medium. The higher the index of refraction, the slower light moves through the medium. When light travels from a low-index medium into a high-index medium, the ray bends toward the normal as the wave slows down. When light travels from a high-index medium into a low-index medium, the ray bends away from the normal as the wave speeds up.
Mathematically, refraction is described by the general form of Snell’s Law, which is based on the transverse wave nature of the oscillating electric and magnetic fields making up light:
![]()
When light travels from a high-index medium into a low-index medium, if the angle of refraction reaches 90°, the light ray is reflected internally and does not escape the high-index medium. This occurs once the angle of incidence is larger than the critical angle, which is the boundary between refraction and total internal reflection. If the angle of incidence is less than the critical angle, light is refracted as it exits the higher-index medium. If the angle of incidence is greater than the critical angle, the light is reflected internally and does not escape the higher-index medium.
The refraction of white light as it enters and exits a prism or a water droplet produces a spectrum of colours, which is known as dispersion. Refraction demonstrates that white light is composed of a variety of colours, each associated with a specific wavelength. This occurs because the index of refraction is related to the speed of the wave and its unique wavelength, according to Snell’s Law and the universal wave equation, which is an explanation that supports the wave model of light.
Lesson Glossary
critical angle: for any two mediums, the size of the incident angle that causes the angle of refraction to be 90°
refraction: a change in the direction of a wave due to a change in its speed
refractive index: a ratio comparing the speed of light in a vacuum to its speed in a given medium
Snell’s Law: for any angle of incidence greater than zero, the ratio of ![]()
total internal reflection: the reflection of a wave that is travelling from a high-index medium into a low-index medium at an angle equal to or greater than the critical angle
1.24. Lesson 5
Module 5—Wave Theory of Light
Lesson 5—Refraction, Lenses, and Optical Systems
 Get Focused
© andrei nacu/shutterstock
The lens in your eye is part of an optical system that projects a clear image of the visual world onto the light-sensitive cells of your retina located at the back of your eye.
Light-sensitive rod cells and cone cells line the retina of the human eye in a very specific pattern. The rod cells, found throughout the retina, are sensitive to low levels of light and are used for primary vision in dark environments. The cone cells, found near the centre of the retina, are sensitive to various colours of light (wavelength) and produce colour vision in normal light environments.
© Andrew Chin/shutterstock
To achieve clear vision, light rays must be refracted when they enter the eye to accommodate the distribution of various light-sensitive cells in the retina at the back of the eye. Most of the light is directed at the fovea, a small region on the retina directly opposite the lens, which has a very high density of cone receptors. The light is focused in this region due to refraction that occurs as light enters the eye through the cornea and again as it passes through the lens.
The process is similar to that of a camera, which uses lenses to focus light on other photosensitive materials, such as film or electronic sensors.
Subtle changes or irregularities in the shape of the lens change the direction of the refracted light, which can cause impaired vision, such as near- and far-sightedness. In these cases, external lenses, such as glasses or contact lenses can be used to correct the path of the light. These lenses refocus the image clearly on the light-sensitive areas of the retina.
In essence, glasses are custom-designed lenses that correct imperfections in the natural lens of the eye to restore image formation on the retina. This complex process can be understood in terms of ray diagrams and refraction through thin lenses.
In this lesson you will answer the following essential questions:
- What is a thin lens?
- How are ray diagrams used to predict image characteristics for thin lenses?
- How is the thin lens equation used to predict image characteristics for thin lenses?
 Module 5: Lesson 5 Assignment
Your teacher-marked Module 5: Lesson 5 Assignment requires you to submit responses to the following:
- Laboratory—LAB 1 and LAB 2
- Assignment—A 1, A 2, and A 3
- Discuss—D 3
The other questions in this lesson are not marked by the teacher; however, you should still answer these questions. The Self-Check and Try This questions are placed in this lesson to help you review important information and build key concepts that may be applied in future lessons.
After a discussion with your teacher, you must decide what to do with the questions that are not part of your assignment. For example, you may decide to submit to your teacher the responses to Try This questions that are not marked. You should record the answers to all the questions in this lesson and place those answers in your course folder.
1.25. Page 2
Module 5—Wave Theory of Light
 Explore
converging lens: a lens that refracts rays travelling parallel to the principal axis inward to the focal point of the lens
diverging lens: a lens that refracts rays travelling parallel to the principal axis outward so that they appear to have originated or passed through the virtual focal point of the lens
A thin lens, similar to that found in the human eye, is a circular piece of transparent material with a spherically shaped surface. With any curved lens, light rays will be refracted at various angles depending on where they contact the curved surface. There are two types of thin lenses.
A converging lens with convex surfaces refracts rays that are parallel to the principal axis toward a focal point producing a real image (as shown in the diagram).
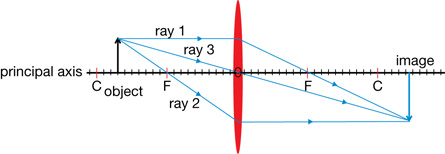
A diverging lens with concave surfaces refracts rays that are parallel to the principal axis outward so that they appear to have originated from a virtual focal point. Therefore, a diverging lens can only produce a virtual image.
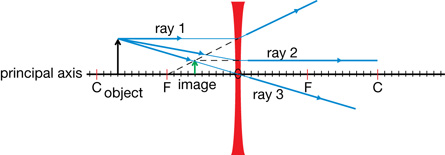
The following table summarizes all the relevant labels for each ray diagram.
Label |
Definition |
C |
centre of curvature, the radius of the spherical surface of the lens |
F |
focal point, primary on the object side, secondary on the other side |
O |
optical centre of the lens |
principal axis |
imaginary line that is perpendicular to the lens surface at the optical centre |
ray 1 |
travels parallel to the principal axis and is refracted through, or appears to have passed through, the principal focus |
ray 2 |
travels through, or appears to have passed through, the secondary focus and emerges parallel to the principal axis |
ray 3 |
passes straight through the optical centre (See “Physics Insight” on page 678 of your physics textbook.) |
As with ray diagrams used for curved mirrors, many rays produce the image but only a few are required to identify the image characteristics. The three rays used in the illustrations can be used with any ray diagram to predict the image characteristics.
Recall the following image characteristics from Lesson 3.
Image Characteristic |
Definition |
magnification |
ratio of the size of the image to the size of the object |
attitude |
vertical orientation of the image relative to the object |
position |
where the image and object are located relative to the reflecting surface |
real or virtual image |
a real image forms where light rays converge, a virtual image forms where light rays “appear” to have converged or originated |
A simulation will be used to explore the image characteristics for both converging and diverging lenses.
 Module 5: Lesson 5 Assignment
Remember to submit your answers to LAB 1 and LAB 2 to your teacher as part of your Module 5: Lesson 5 Assignment.
LAB 1. Open the Thin Lens simulation and select “Lens” from the drop-down menu (if needed).
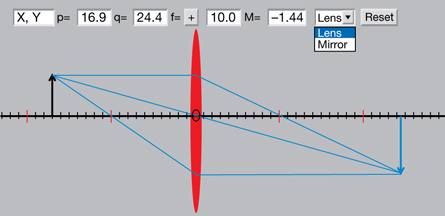
© F. Hwang, NTNU JAVA Virtual Physics Laboratory. Used with permission.
Click the object arrow and move it to various locations on the principal axis. Using the simulation as a guide, draw ray diagrams and describe the image characteristics when the object is located at the positions listed in Table 1. The first one is done as an example. You can find a copy of the table in your Module 5: Lesson 5 assignment document.
Table 1: Using Ray Diagrams to Predict Image Characteristics—Converging Lens
Object Position |
Ray Diagram |
Image Characteristics |
very far away |
|
The image is real, inverted, much smaller than the object, and is located at F. |
outside C |
|
|
at C |
|
|
between C and F |
|
|
at F |
|
|
inside F |
|
|
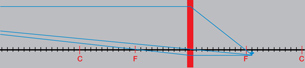
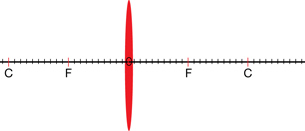
LAB 2. Switch the lens in the simulation to a diverging lens by making the focal length negative (![]() ). Complete Table 2.
). Complete Table 2.
Table 2: Using Ray Diagrams to Predict Image Characteristics—Diverging Lens
| Object Position | Ray Diagram |
Image Characteristics |
very far away |
|
The image is real, inverted, much smaller than the object, and is located at F. |
outside C |
|
|
at C |
|
|
between C and F |
|
|
at F |
|
|
inside F |
|
|
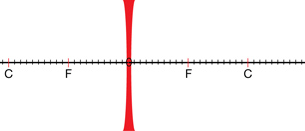
1.26. Page 3
Module 5—Wave Theory of Light
 Read
Read
Read pages 677–679 of your textbook for more explanations and help in drawing ray diagrams for thin lenses.
The Lens Equation
While ray diagrams are useful tools for revealing image characteristics, they can also be used to derive a mathematical equation for finding and identifying image characteristics. The derivation of the lens equation, which is identical to the mirror equation in Lesson 3, can be seen on page 680 of your textbook.
The lens equation relates the focal length of a curved lens to the image and object positions.
Expressed as an equation, it is as follows:
![]()
| Quantity | Symbol |
SI Unit |
object position relative to the optical centre |
do |
m |
image position relative to the optical centre |
di |
m |
focal length |
f |
m |
The image and object characteristics are also described in these equations using sign conventions:
- Positive distances describe real images and objects.
- Negative distances describe virtual images.
- Converging lenses have a real focal length that is positive.
- Diverging lenses have a virtual focal length that is negative.
![]()
- Negative height describes an inverted image or object.
- Positive height describes an upright image or object.
Read
Read “Equations for Thin Lenses” on page 680 of the textbook.
 Try This
TR 1. Complete “Practice Problems” 1–3 on page 681 of the textbook.
 Module 5: Lesson 5 Assignment
Remember to submit your answers to A 1, A 2, and A 3 to your teacher as part of your Module 5: Lesson 5 Assignment.
A 1. A lens with a focal length of 5.0 cm is placed 12 cm away from an 8.0-cm-tall object.
- How far from the lens is the image?
- How tall is the image?
- Describe the image characteristics: real/virtual, inverted/erect, enlarged/smaller.
A 2. A scientist uses a lens with a 17-cm focal length to focus light to create a holograph. The lens is 30 cm from the 25-cm-tall image.
- How far from the lens is the object?
- What is the height of the image?
- Describe the image characteristics: real/virtual, inverted/erect, enlarged/smaller.
A 3. A student is given the challenge of determining the focal length of the lens in an LCD projector. The projector creates an image 600-cm-tall 12 m from the lens. The object is 12-cm-tall.
- What is the distance to the object?
- What is the focal length of the lens?
 Discuss
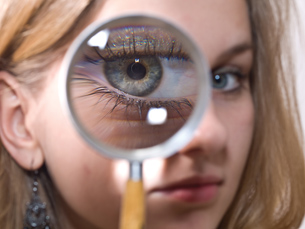
© luchschen/shutterstock
A magnifying glass is a double-convex converging lens. Using a ray diagram, prove that the magnified image you see in a magnifying glass is a virtual image. Explain how the focal length of the lens and the position of the object affect its magnifying power.
Your posting should consist of at least one ray diagram and an explanation relating the focal length and the object’s position to the amount of magnification and the characteristics of the image.
D 1. Using the simulation, you can explore ray diagrams for a magnifying glass by positioning the object inside the focal point of a converging lens on the simulation. Compare different positions to find how they relate to the object’s magnification and image characteristics. Also, adjust the focal length on the simulation, which defaults to 10.0 units of length.
D 2. Create rules to describe the relationship between the object distance and image distance relative to the focal point and real/virtual images. Post your rules and read the rules of other students in your discussion forum.
Module 5: Lesson 5 Assignment
Remember to submit your answer to D 3 to your teacher as part of your Module 5: Lesson 5 Assignment.
D 3. Now that you have seen other students’ rules, reflect on your rules and improve them. What are your new rules, and how did reading the other students’ rules help you to improve your own understanding?
Discussion Scoring Guide
| Principles involved: refraction, lens, and ray diagrams | ||||
Criteria |
Level 1 |
Level 2 |
Level 3 |
Level 4 |
Knowledge |
||||
Demonstrates a vague and sometimes incorrect understanding of the physics principles involved. Obvious irrelevant or missing information. |
Demonstrates a basic understanding of the physics principles involved. May exhibit minor mistakes or vague information or application to the situation. |
Demonstrates a good understanding of the physics principles involved and applies them properly to the given situation. All necessary information is given. |
Demonstrates a superior understanding of the physics principles involved and their application to the situation. All applications are considered in detail. |
|
Reflection |
||||
The post shows reflection on one’s own and other students’ work. Contributes to the group discussion. |
Does not make an effort to participate. Seems indifferent to discussion. |
Occasionally makes meaningful reflections on the group’s efforts or discussions. Marginal effort is shown to become involved with the group or discussion. |
Frequently makes meaningful reflections on the group’s efforts and presents relevant viewpoints for consideration by the group. Interacts freely with group members. |
Regularly attempts to motivate the group discussion and delve deeper into concepts. Interacts freely and encourages all group members. |
Content and presentation of discussion summary |
||||
The information is logically arranged in a clear and concise manner. |
The information is poorly organized with many concepts implied. Irrelevant or rambling sentences make reading difficult. |
The information is somewhat organized with implied concepts. Excessive words or awkward sentences are used, which hinder reading. |
The information is well-organized and logically arranged. All concepts are explicitly explained. There are a few awkward but understandable sentences. |
The information is well-organized and very easy to understand. Well-worded sentences make reading pleasurable. |
1.27. Page 4
Module 5—Wave Theory of Light
 Reflect and Connect

© Scott Hales/shutterstock
Myopia, commonly known as near-sightedness or short-sightedness, occurs when the light entering the eye is refracted too sharply. This causes the image to form in front of the retina. To correct this type of disorder, a diverging lens can be placed in front of the eye to alter the light-ray paths so that they converge on the surface of the retina and restore clear vision.

The diverging lens is identified as a negative prescription, since it has a negative, virtual focal length. The amount of refraction caused by the lens is identified numerically using a unit called diopters, which is the reciprocal of the lens’s focal length. For example, a −2 lens prescription is a diverging lens with a virtual focal length of ![]() metre. A −3 lens will refract light to a greater extent than the −2 lens, since it has a shorter focal length of
metre. A −3 lens will refract light to a greater extent than the −2 lens, since it has a shorter focal length of ![]() metre. The strength of the lens is related to both the refractive index of the material from which it is made and the curvature of the surface. Different prescriptions are manufactured by altering either the lens material or its curvature.
metre. The strength of the lens is related to both the refractive index of the material from which it is made and the curvature of the surface. Different prescriptions are manufactured by altering either the lens material or its curvature.
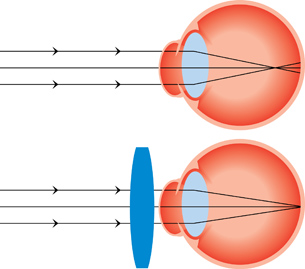
Hyperopia, or far-sightedness, occurs when light is not refracted enough to converge on the retina. To correct this condition, a converging lens is used to refract the light farther, effectively moving the image formation forward so that the light occurs on the retina tissue.
Far-sightedness is treated with positive diopter prescriptions. For example, a +3 lens has a real focal length of ![]() m. Reading glasses are a good example of a positive prescription lens that many people use to view objects up close, such as the text in books.
m. Reading glasses are a good example of a positive prescription lens that many people use to view objects up close, such as the text in books.
In a general sense, eyeglasses are an extension of the optical system of the human eye and are capable of causing specific amounts of refraction to remedy imperfections in the lens or cornea of the user. The thin lens equation and ray diagrams are used to understand and predict image formation in such applications.
 Module 5: Lesson 5 Assignment
Remember to submit the Module 5: Lesson 5 Assignment to your teacher.
1.28. Page 5
Module 5—Wave Theory of Light
 Lesson Summary
At the start of this lesson you were asked the following essential questions:
- What is a thin lens?
- How are ray diagrams used to predict image characteristics for thin lenses?
- How is the thin lens equation used to predict image characteristics for thin lenses?
In this lesson you learned that a thin lens is a circular piece of transparent material with a spherically shaped convex or concave surface. A converging lens has a convex surface that refracts rays parallel to the principal axis toward a focal point, producing a real image (assuming the object is farther than 1 focal length away from the lens). A diverging lens has a concave surface, refracting rays that are parallel to the principal axis outwards so that they appear to have originated from a virtual focal point, producing a virtual image.
Similar to ray diagrams for curved mirrors, many rays produce the image but only a few are required to identify its characteristics. A ray diagram with three or more rays can be used to accurately predict the image characteristics formed by both types of lenses.
The lens equation ![]() , which is identical to the curved mirror equation, can also be used to identify and predict image characteristics. Human vision is a good example of an optical system that can involve multiple lenses causing precise amounts of refraction to produce a clear image on the retina of the observer.
, which is identical to the curved mirror equation, can also be used to identify and predict image characteristics. Human vision is a good example of an optical system that can involve multiple lenses causing precise amounts of refraction to produce a clear image on the retina of the observer.
Lesson Glossary
converging lens: a lens that refracts rays travelling parallel to the principal axis inward to the focal point of the lens
diverging lens: a lens that refracts rays travelling parallel to the principal axis outward so that they appear to have originated or passed through the virtual focal point of the lens
thin lens equation: an equation that relates image distance, object distance, and the focal length of a thin lens
1.29. Lesson 6
Module 5—Wave Theory of Light
Lesson 6—Diffraction and Interference
 Get Focused

© Tischenko Irina/shutterstock
If you pick up any DVD or CD and look at the disc at an angle in the sunlight, you will see a spectrum like the one in this photo. If the reflected light from the disc is directed onto a nearby screen or wall, you will see a spectrum very similar to that of the rainbow produced by refraction in a prism.
In this case, however, refraction cannot explain the pattern since the light does not pass through the disc and only travels in one medium (air). So, how is the spectrum produced? How is it comparable to the spectrum produced by refraction in a prism?
In the manufacturing of a CD or DVD, small grooves or pits are cut into the polycarbonate material in a very tightly packed spiral pattern to make a track. This pattern appears as many thousands of concentric rings on the surface of the disc. Underneath all the rings is a layer of aluminum or gold metal that makes the pits highly reflective when being read by a CD or DVD player.
As a side effect, when light is reflected from the metal layer, it is slightly bent as it emerges from the opening of each ring. The amount of bending, or diffraction, is slightly different for each colour, or wavelength of light, creating an interference pattern that reveals all the colours that make up white light.
Is this process strong evidence for the wave nature of light and EMR in general? In this lesson you will explore the wave characteristics of light.
In this lesson you will answer the following essential questions:
- What is diffraction?
- What is an interference pattern?
- What is the significance of Thomas Young’s experiment as it relates to the wave model of light?
- How are diffraction patterns solved mathematically in ideal and experimental conditions?
 Module 5: Lesson 6 Assignment
Your teacher-marked Module 5: Lesson 6 Assignment requires you to submit responses to the following questions:
- Assignment—A 1, A 2, A 3, A 4, and A 5
- Discuss—D 3
The other questions in this lesson are not marked by the teacher; however, you should still answer these questions. The Self-Check and Try This questions are placed in this lesson to help you review important information and build key concepts that may be applied in future lessons.
After a discussion with your teacher, you must decide what to do with the questions that are not part of your assignment. For example, you may decide to submit to your teacher the responses to Try This questions that are not marked. You should record the answers to all the questions in this lesson and place those answers in your course folder.
1.30. Page 2
Module 5—Wave Theory of Light
 Explore
Diffraction
diffraction: the bending and spreading of waves when they interact with obstacles in their path
By the early nineteenth century it was well known by scientists that mechanical waves, such as those of water, displayed the unique property of diffraction.

Diffraction occurs when any wave front bends or changes direction as it passes by the sharp edge of an obstacle or through a small opening in the obstacle. As illustrated, waves are diffracted as they pass through a small opening in a barrier. The amount of diffraction depends on the wavelength and the size of the opening. A barrier with multiple openings is called a grating. The CD or DVD is an example of a grating; it has many small openings in the form of concentric rings from which light waves may emerge after reflecting off the metal backing of the disc.
 Watch and Listen
To observe diffraction of mechanical and electromagnetic waves, such as visible light, open the Wave Interference simulation. You may select any one of three wave forms: water, sound, and light.
![]()
In each mode, select one slit (![]() ); then click the barrier and drag it close to the wave source. Observe the circular shape of the wave front that emerges from the opening. You may add walls to the sound and water sections and explore diffraction around corners as well.
); then click the barrier and drag it close to the wave source. Observe the circular shape of the wave front that emerges from the opening. You may add walls to the sound and water sections and explore diffraction around corners as well.
Diffraction and Interference
A barrier with a single slit acts as a single point source of light producing ever-expanding circular wave fronts. If a second slit is introduced beside the first one, there will be two identical point sources of light, each producing circular wave fronts that will contact one another. Therefore, if light has wave-like characteristics, the two point sources should interfere to produce a distinct interference pattern. Interference patterns were explored in your previous physics course and are reviewed here.
Interference refers to the way in which two or more wave forms combine to produce a resultant wave form. There are two different types of interference: constructive interference and destructive interference.
constructive interference: occurs when two waves combine to produce a resultant wave larger than either of the original waves
destructive interference: occurs when two waves combine to produce a resultant wave smaller than either of the original waves
node: a point on a standing wave pattern where there is no displacement and the wave appears to be standing still
antinode: opposite of node, a point on a standing wave pattern where there is maximum displacement
If complete destructive interference occurs, both waves cancel each other out and produce no resultant wave. On an interference pattern this is referred to as a node.
If complete constructive interference occurs, both waves combine to produce the largest possible resultant wave. On an interference pattern, this situation is referred to as an antinode.
Watch and Listen
See how two waves interfere constructively and destructively in the video Young’s Double-slit Experiment. Note that in the destructive phase, it’s as if a positive amplitude (above the middle line) is added to a negative amplitude (below the middle line) to produce a zero amplitude.
 Module 5: Lesson 6 Assignment
Remember to submit your answers to A 1 to your teacher as part of your Module 5: Lesson 6 Assignment.
A 1. After viewing the video, draw two waves (one below the other) and the resultant wave to illustrate the following.
- complete constructive interference
- complete destructive interference
When a wave front encounters two slits, each slit produces a circular wave front, leading to a distinctive interference pattern characterized by repeating regions of destructive and constructive interference. In terms of light, this is observed as repeating dark and bright regions on a screen.
Watch and Listen
Watch Young’s Double-slit Experiment again. Pay close attention to the production of a two-slit interference pattern.
 Try This
TR 1. Sketch the two-slit interference pattern seen in the previous video clip.
Thomas Young’s Double-slit Experiment
The two-slit interference pattern was first demonstrated at the turn of the nineteenth century. At the time there was a long-running, heated debate surrounding the nature of light. Was it a stream of particles or was it a wave? The scientific community of the time was split with many scientists supporting Isaac Newton’s theory that light was made of tiny particles, which would be unable to interfere as waves would.
In 1801, Thomas Young, a professor of natural philosophy and physics at the Royal Institution in London, performed a key experiment to support the wave characteristics of visible light. He placed a narrow card similar to that of a playing card into a beam of light coming from a nearby window.
When the card was held sideways, splitting the beam into two identical light sources, an interesting pattern was observed on a nearby wall, which is illustrated in the image. In the illustration, the light of a single wavelength (colour) is directed at two small slits. After passing through the slits it falls on a distant screen to produce an interference pattern, which has many sequential bright and dark bands.

Watch and Listen
You can perform a similar experiment to that of Thomas Young using a simulation. Open the Wave Interference simulation, and select the light wave form.
Select (![]() ) and then click the barrier and drag the barrier close to the wave source. Click on “Show Screen.” Observe the interference pattern produced. The pattern is easier to observe with high amplitude waves. You can adjust the amplitude slider on the light source when observing the interference pattern.
) and then click the barrier and drag the barrier close to the wave source. Click on “Show Screen.” Observe the interference pattern produced. The pattern is easier to observe with high amplitude waves. You can adjust the amplitude slider on the light source when observing the interference pattern.
Young’s double-slit experiment showed that light, when shone through two slits, was diffracted and produced a definite interference pattern on a screen. This evidence helped to convince the scientific community that the behaviour of light could be explained with a wave model. Light displays properties unique to waves: interference and diffraction.
Watch and Listen
Watch Young’s Double-slit Experiment for a final time. This time pay close attention to the overview of diffraction, interference, and Young’s Experiment.
1.31. Page 3
Module 5—Wave Theory of Light
Diffraction, Path Difference, and Interference
Path difference can explain interference patterns seen by Thomas Young. Each wave must travel a certain length, along a specific path, from the slit to the distant screen.
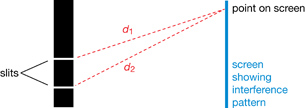
The length from any one point on the screen to each slit is slightly different, as shown in d1 and d2, since the slits are located some distance apart. This means that light leaving both slits must travel slightly different lengths, d1 and d2, to arrive at the same spot on a distant screen. The difference in the path lengths is called the path difference.
Path difference, Δd = |d1 – d2|
If the path difference to a common point on the screen is an integral number of wavelengths, then the waves arrive at the common point in phase and constructively interferes producing a bright fringe. However, if the path difference is a half-number of waves, then the waves arrive completely out of phase and destructively interfere leaving a dark fringe.
bright fringes: regions of constructive interference along antinodal lines
dark fringes: regions of destructive interference along nodal lines
Path difference explains the interference patterns created by two-slit diffraction. When the light reaches a screen, bright and dark bands are observed. These bands are called interference fringes. Bright fringes (antinodal lines) are regions of constructive interference and dark fringes (nodal lines) are regions of destructive interference. The following image illustrates the fringes and the path differences for the interference pattern created when light is diffracted in a two-slit experiment. Notice that the bright and dark fringes are symmetrical around the central antinode.
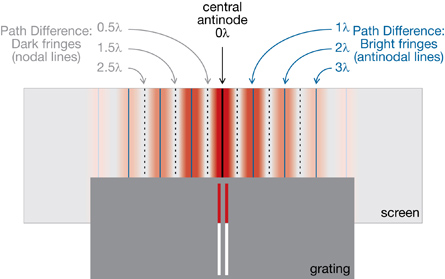
 Read
Read
Read “The Interference Pattern” on pages 686–687 of your textbook. Look at “Figure 13.72” to “Figure 13.74” for some great illustrations of the path difference explanation described earlier. These figures will help with SC 1 and SC 2.
 Self-Check
Answer the following questions based on your readings and observations in the previous video and simulations.
SC 1. Why is there always a bright fringe at the centre of the screen? (This fringe is called the central antinode.)
SC 2. Explain why this central antinode is always the brightest fringe.
Self-Check Answers
Contact your teacher if your answers vary significantly from the answers provided here.
SC 1.
The central antinode is the result of constructive interference. The path length from each hole in the grating to the central antinode is identical so the path difference is zero (as shown in the diagram). Both waves arrive in phase and interfere constructively to produce the bright fringe.
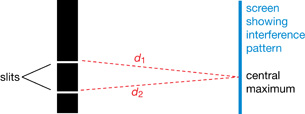
SC 2.
All of the waves arriving at the central antinode are completely in phase, causing complete constructive interference. The other bright fringes will have some destructive interference due to multiple slits or the light is naturally dimmer because it is not the first order maximum, which is the brightest.
Read
Two-slit diffraction patterns can be understood mathematically based on the concept of path length and the wavelength. For example, the location of bright antinodes and dark nodes in the two-slit interference pattern can be used to determine the exact wavelength of the light causing them.
Read pages 687–689 in your textbook for a full derivation of the mathematical relationships.
The interference pattern produced by diffraction through a double slit can be analyzed using the following equation:
![]()
| Quantity | Symbol |
SI Unit |
wavelength |
λ |
m |
slit spacing (separation between slits) |
d |
m |
path difference* |
n |
none (number of wavelengths) |
angle of diffraction (measured from the central antinode) |
(θ) |
degrees |
* Constructive interference (antinodes − bright fringes) occurs when the path difference is a whole number of wavelengths (n = 0, ±1, ±2, ...). Thus, for antinodes or bright fringes: n = 1, 2, 3, 4, ….
Destructive interference (nodes − dark fringes) occurs when the path difference is offset by half a wavelength (n = ±0.5, ±1.5, ±2.5, ...). Thus, for nodes or dark fringes: n = 0.5, 1.5, 2.5, 3.5, ….
Example Problem 1.
Light with a wavelength of 457 nm is shone through two slits separated by 0.20 mm.
a. What is the angle of diffraction to the second bright fringe (n = 2)?
Given
Required
the angle of diffraction
Analysis and Solution
Paraphrase
The angle of diffraction is 0.26° from the central bright fringe.
The light producing the second order bright fringe, or n = 2 antinode, is diffracted through a 0.26° angle as it exits the two slits. A simulation can be used to verify this calculation and visualize the interference pattern near the n = 2 bright antinode.
Open the Diffraction Grating simulation and set the slit width, wavelength, and slit count as indicated in the following screen shot.
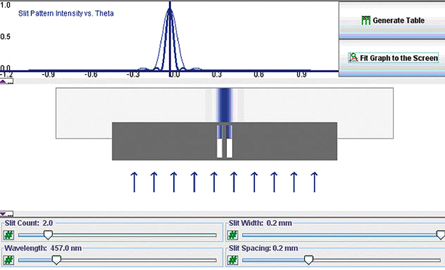
While holding down the Ctrl key, you can drag out a region of the intensity graph to zoom in. You may do this a number of times to get an appropriate scale, where the 0.26° angle is visible.
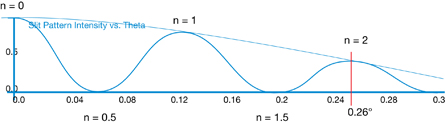
You can see that the n = 2 region is located 0.26° from the central antinode.
b. What is the angle of diffraction to the second dark fringe?
Given
Remember that destructive interference, dark fringes, have n values that end in .5. The first dark fringe is 0.5, so the second one is 1.5.
Required
the angle of diffraction to the second dark fringe
Analysis and Solution
Paraphrase
The angle of diffraction to the second dark fringe is 0.20°. If you look at the previous screen shots, you will see that the simulation gives the same result for n = 1.5.
 Module 5: Lesson 6 Assignment
Remember to submit your answer to A 2 to your teacher as part of your Module 5: Lesson 6 Assignment.
A 2. Using the Diffraction Grating simulation, set the slit count to 2.0, the wavelength to 550.0 nm, the slit width to 0.1 mm, and the slit spacing to 0.2 mm. Observe how the following changes affect the interference pattern.
- decreasing the wavelength
- increasing the wavelength
- decreasing the slit width
- increasing the slit width
- decreasing the slit spacing
- increasing the slit spacing
Summarize your observations on how the wavelength, slit width, and slit spacing affect the interference pattern in the simulation in a table or graphic organizer of your choice.
Self-Check
SC 3. If some light passes through two slits, separated by 0.33 mm, and the first dark fringe is located 0.035° from the central antinode, what is the wavelength of the light? Show the calculation and check your answer with the simulation.
SC 4. Blue light of wavelength 465 nm is incident on a double slit where the slits are spaced 0.5 mm apart and are 0.05 mm wide. At what angle of diffraction will the fourth order antinodal line appear? Show the calculation and check your answer with the simulation.
Self-Check Answers
Contact your teacher if your answers vary significantly from the answers provided here.
SC 3.
Required
the wavelength of the light
Analysis and Solution
Paraphrase
The wavelength is 4.0 × 10⁻⁷ m.
SC 4.
Given
Required
the angle of diffraction to the fourth order antinodal line
Analysis and Solution
Paraphrase
The angle of diffraction to the fourth order antinodal line is 0.21°.
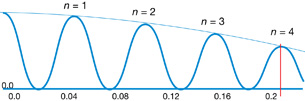
 Try This
TR 2. Radiation of 400 nm passes through two slits and produces the following interference pattern. Given the angle of diffraction for the second order dark fringe, determine the slit separation. Show the calculation and check your answer with the simulation.
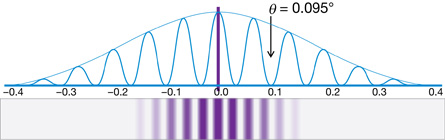
Read
As you will have noticed from each of the noted scenarios, the angle of diffraction is always very small, making it difficult to measure accurately in many experimental conditions. In such cases, a second equation is used that approximates the small angle using a ratio of the distance separating the screen and slits to the distance between any two antinodes. For very small angles, use the equation sin θ = x/L.
Read the “infoBIT” on page 690 of your textbook for the derivation of the small angle approximation.
The interference pattern produced by diffraction through a double slit can be analyzed using the following equation.
![]()
| Quantity | Symbol |
SI Unit |
wavelength |
λ |
m |
distance from central antinode to antinodal line |
x |
m |
slit spacing (separation) |
d |
m |
path difference* |
n |
none (number of wavelengths) |
distance between slits and screen |
L |
m |
* Constructive interference (antinodes − bright fringes) occurs when the path difference is a whole number of wavelengths (n = 0, ±1, ±2, …). Thus, for antinodes or bright fringes: n = 1, 2, 3, 4, ….
* Destructive interference (nodes − dark fringes) occurs when the path difference is offset by half a wavelength (n = ±0.5, ±1.5, ±2.5, …). Thus, for nodes or dark fringes: n = 0.5, 1.5, 2.5, 3.5, ….
Work through “Example 13.9” on page 691 of the textbook.
Try This
TR 3. Complete “Practice Problems” 1–3 on page 691 of the textbook.
Read
diffraction grating: an optical component that has a surface covered by a regular pattern of parallel lines or grooves that are usually separated by a distance comparable to the wavelength of light
The tightly spaced concentric rings on a CD or DVD from the Get Focused section of this lesson are an example of a diffraction grating.
The equations that describe a two-slit experiment are equally useful for gratings, since they only rely on the spacing between any two slits. Dividing the width of the grating by the total number of lines or spaces on it gives the distance between any two lines, which is the slit separation that can be used with any diffraction equation.
Read “Diffraction Gratings” and “Example 13.10” on pages 692–693 of your textbook.
Try This
TR 4. Complete “Practice Problems” 1–3 on page 693 of the textbook.
Module 5: Lesson 6 Assignment
Remember to submit your answers to A 3, A 4, and A 5 to your teacher as part of your Module 5: Lesson 6 Assignment.
A 3. A scientist is double-checking the wavelength of a new laser. The scientist sets up a diffraction grating with 5.00×10⁻⁶ m between slits, in front of the laser 1.50 m in front of a screen. The scientist measures the distance from the central maximum to the second bright fringe, which is 0.330 m. What is the wavelength of the laser?
A 4. As part of a laser light show, the technician is adjusting a diffraction grating. A green laser with a wavelength of 532 nm is shone on a diffraction grating with 2700 lines/cm. The screen is 35 m from the diffraction grating.
- What is the distance between the slits of the diffraction grating?
- How far from the central maximum will the bright fringe be?
A 5. A student is looking at a monochromatic light source and is looking for the third bright fringe. The light has a wavelength of 625 nm and has passed through a diffraction grating with a slit separation of 2.80×10⁻⁶ m. At what angle should the student look for the third bright fringe?
Try This
Read “Inquiry Lab” on pages 694–695 of your textbook.
A student performs the “Inquiry Lab” and gathers the following data.
Light |
Left |
Right |
Red |
0.214 m |
0.209 m |
Green |
0.150 m |
0.152 m |
Blue |
0.135 m |
0.139 m |
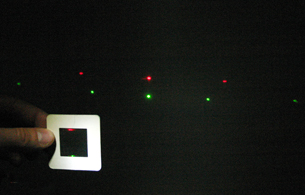
TR 5. Do “Analysis” questions 1 to 4 on page 695 in your textbook using the results from the previous data.
Read
polarization: the production of a state in which the plane of the electric field for each electromagnetic wave occurs only in one direction
The purpose of Thomas Young’s experiment was to demonstrate the wave nature of light. Polarization gave further evidence to support the wave model of light.
Read pages 695–696 of your textbook to find out about polarization. Then view the animation Polarization.
Self-Check
SC 5. What part of an electromagnetic wave does the polar filter affect?
SC 6. Polarized sunglasses are popular with people who fish and drive boats. Why are polarized sunglasses popular with those groups of people?
SC 7. The liquid crystal display (LCD) used on calculator screens, cellular phones, MP3 players, LCD TVs, and computer projectors use polar filters to block some colours and let other colours be projected onto the screen. What is a possible problem if you wear polarized sunglasses and attempt to use an LCD product?
Self-Check Answers
Contact your teacher if your answers vary significantly from the answers provided here.
SC 5. The polar filter absorbs the electric field; however, you can’t have a magnetic field without an electric field so the wave is stopped by the filter when the electric field is not parallel to the slits of the filter.
SC 6. The polar filter absorbs the horizontally polarized light reflected from the water that causes the most irritating glare. Without the glare, it is much easier to see what is under the water, be it a submerged hazard or a fish. Avoiding glare causes less eyestrain when outside near reflective surfaces.
SC 7. If the polar lens on the sunglasses lines up at 90° to the polar filter in the LCD, then the picture could be colour distorted or completely invisible.
 Discuss
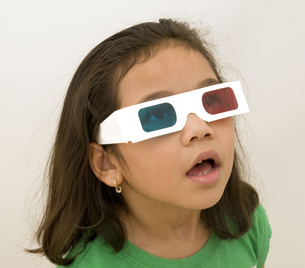
© Jesse Kunerth/shutterstock
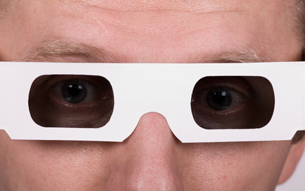
© Andrew Buckin /shutterstock
3-D (three-dimensional) movies are popular again at movie theatres. The technology uses the fact that we have binocular vision because we use two eyes that each takes a picture of the world at a slightly different angle. Your brain assembles the two pictures to create a three-dimensional view of the world. You can test this by looking at something and closing one eye and then the other. You will see the same object but from a slightly different angle.
In the 1950s and 1960s, 3-D movies were developed that projected a red-coloured version of the movie and a blue-coloured version. The audience members wore a pair of cardboard glasses with a blue lens to block the blue version and a red lens to block the red version (as in the photo). In this way, each eye saw only one version of the picture from its perspective.
The viewer’s brain interpreted this as a 3-D image of objects coming out of the screen. Unfortunately, the colours were often distorted because of the colour filters. If you buy a DVD of a 3-D movie to watch on your home TV, this colour, filtering technology creates the 3-D effect.
Today in theatres, however, polar filter glasses and two projectors are used to create the 3-D effect. The big advantage is that the polar filters don’t distort the colours of the movie.
D 1. Using what you know about polar filters, explain how polarized glasses and two projectors can be used to create a 3-D picture. Post your answer in your discussion area.
D 2. Read what other students have suggested, and think about how you can use this information to improve your answer.
Module 5: Lesson 6 Assignment
Remember to submit your answer to D 3 to your teacher as part of your Module 5: Lesson 6 Assignment.
D 3. Improve your answer to D 1, and state what improvements you made to your solution and why.
Discussion Scoring Guide
| Principles involved: polarized light and filters | ||||
Criteria |
Level 1 |
Level 2 |
Level 3 |
Level 4 |
Knowledge |
||||
Demonstrates a vague and sometimes incorrect understanding of the physics principles involved. Obvious irrelevant or missing information. |
Demonstrates a basic understanding of the physics principles involved. May exhibit minor mistakes or vague information or application to the situation. |
Demonstrates a good understanding of the physics principles involved and applies them properly to the given situation. All necessary information is given. |
Demonstrates a superior understanding of the physics principles involved and their application to the situation. All applications are considered in detail. |
|
Reflection |
||||
The post shows reflection on one’s own and other students’ work. Contributes to the group discussion. |
Does not make an effort to participate. Seems indifferent to discussion. |
Occasionally makes meaningful reflections on the group’s efforts or discussions. Marginal effort is shown to become involved with the group or discussion. |
Frequently makes meaningful reflections on the group’s efforts and presents relevant viewpoints for consideration by the group. Interacts freely with group members. |
Regularly attempts to motivate the group discussion and delve deeper into concepts. Interacts freely and encourages all group members. |
Content and presentation of discussion summary |
||||
The information is logically arranged in a clear and concise manner. |
The information is poorly organized with many concepts implied. Irrelevant or rambling sentences make reading difficult. |
The information is somewhat organized with implied concepts. Excessive words or awkward sentences are used, which hinder reading. |
The information is well-organized and logically arranged. All concepts are explicitly explained. There are a few awkward but understandable sentences. |
The information is well-organized and very easy to understand. Well-worded sentences make reading pleasurable. |
1.32. Page 4
Module 5—Wave Theory of Light
 Reflect and Connect
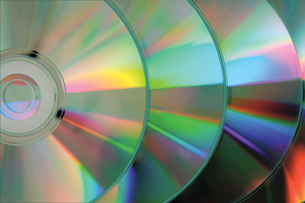
© langdu/shutterstock
Why does a diffraction grating, such as on a CD or DVD, produce a full spectrum rainbow when white light is incident on the grooves making up the track? In both simulations used in this lesson, you can vary the colour (wavelength) of light and you will notice that the interference pattern shifts location. In other words, the dark and light bands of green light appear at different locations than the dark and light bands of red or blue light.
This occurs because the amount of diffraction depends on the wavelength of light when all other variables are held constant. Longer wavelengths diffract through larger angles. When white light is incident on a diffraction grating, each colour diffracts to varying degrees according to its wavelength, effectively separating the colours. This makes each bright fringe appear as a mini-rainbow in a larger interference pattern of bright and dark fringes similar to the patterns observed when monochromatic (single colour) light is used.
The processes of polarization, diffraction, and interference, as observed in double-slit interference experiments like Thomas Young’s, provide strong evidence that light and EMR in general exhibit wave-like characteristics.
 Module 5: Lesson 6 Assignment
Remember to submit the Module 5: Lesson 6 Assignment to your teacher.
1.33. Page 5
Module 5—Wave Theory of Light
 Lesson Summary
At the start of this lesson you were asked the following essential questions:
- What is diffraction?
- What is an interference pattern?
- What is the significance of Thomas Young’s experiment as it relates to the wave model of light?
- How are diffraction patterns solved mathematically in ideal and experimental conditions?
In this lesson you learned that diffraction occurs when any wave front bends or changes direction as it passes by the sharp edge of an obstacle or through a small opening in the obstacle.
If light is shone through two small openings (a double slit), the diffracted waves form an interference pattern characterized by a repeating pattern of constructive and destructive interference, which is explained by assuming light has wave-like characteristics. For this reason, Thomas Young’s double-slit experiment and observed interference pattern provided supporting evidence for the wave model of light.
You also learned that the interference pattern is described and analyzed as follows:
- On either side of the central antinode, or bright fringe, in the centre of the pattern, there is a dark fringe, then a bright fringe, then a dark fringe, then a bright fringe, and so on. Each fringe is given an order.
- Double-slit diffraction patterns can be analyzed mathematically with the following two equations. The first equation is valid for a very small angle θ.
![]()
![]()
- The bright fringes, or antinodes, are the location of constructive interference where the path difference for the light travelling from both slits is a whole number of wavelengths, where n = 1, 2, 3, 4, ....
- The dark fringes, or nodes, are the location of destructive interference where the path difference is offset by a half-number of wavelengths, where n = 0.5, 1.5, 2.5, 3.5, ....
You also learned that diffraction gratings have a large number of equally spaced, parallel lines. The equations that describe a two-slit experiment are equally useful for gratings since they only rely on the spacing between any two slits, or grooves, such as those making up the track on a CD or DVD.
Lesson Glossary
antinode: the opposite of node, a point on a standing wave pattern where there is maximum displacement
bright fringes: regions of constructive interference along antinodal lines
constructive interference: occurs when two waves combine to produce a resultant wave larger than either of the original waves
dark fringes: regions of destructive interference along nodal lines
destructive interference: occurs when two waves combine to produce a resultant wave smaller than either of the original waves
diffraction: the bending and spreading of waves when they interact with obstacles in their path
diffraction grating: an optical component that has a surface covered by a regular pattern of parallel lines or grooves that are usually separated by a distance comparable to the wavelength of light
node: a point on a standing wave pattern where there is no displacement and it appears to be standing still
polarization: the production of a state in which the plane of the electric field for each electromagnetic wave occurs only in one direction
1.34. Module Summary/Assessment
Module 5—Wave Theory of Light
 Module Summary and Assessment
Module 5: Wave Theory of Light is all about proving that light is a wave and not a particle. Throughout the module, you studied the key experiments that showed EMR is a wave by examining its characteristics:
- production
- speed and propagation
- reflection
- refraction
- diffraction and interference
Lesson 1 began by looking at the electromagnetic spectrum and how EMR is produced, starting with low-energy radio waves, going up to the rainbow of visible light, and continuing up to high-energy gamma rays. The spectrum is organized by the wavelength and frequency of the EMR wave. The EMR wave is a combination of changing electric and magnetic fields at right angles to each other. They are created by accelerating charges and can induce currents in antennas as a radio does.
All of the wave properties of EMR were summarized by Maxwell’s electromagnetic theory and later proved by Heinrich Hertz, who used a spark gap to create the artificial EMR, now called radio waves. You discovered that radio waves are very common today. AM/FM radios, cellphones, garage-door openers, and cordless phones operate in the radio range of the spectrum.
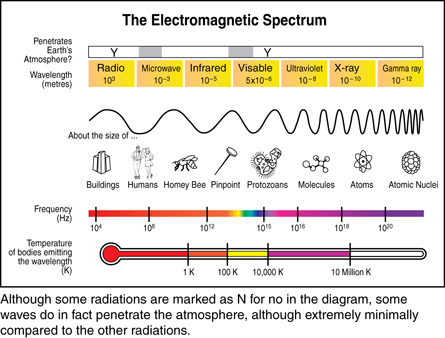
Adapted from image courtesy of NASA
Lesson 2 was about the speed of light and its propagation. You learned that several methods have been used to measure the speed of light. As the technology improved, the experimental results improved, culminating with Michelson’s rotating mirror experiment that produced the current value of c = 3.00 × 10⁸ m/s. You also learned how to measure the speed of light using the interference pattern of the microwaves in a microwave oven. The speed of light further verified Maxwell’s theory of electromagnetic waves.
Lesson 3 was about exploring reflection and how it supports the wave nature of EMR. You saw how specular and diffuse reflection of light waves can be illustrated using ray diagrams, which identify the path of the light waves using arrows (as shown in these two diagrams).

specular reflection

diffuse reflection

You learned that ray diagrams are based on the law of reflection, which states that the angle of reflection relative to the normal line is equal to the angle of incidence. Ray diagrams and equations are used to predict the position and characteristics of images in both plane (flat) and curved mirrors. You saw how reflection and mirrors are used in many of today’s modern technologies, such as digital light processing, telescopes, and satellite dishes.

In Lesson 4 you learned that refraction supports the wave model of light. Refraction occurs when a light wave changes speed when the wave transitions from one medium into another and changes directions (as shown in the diagram on the left). You learned that the index of refraction is based on the velocity of light in a medium and how Snell’s Law uses the index of refraction to mathematically describe the change in direction of the light as it changes media, velocity, and wavelength.
![]()
When light goes from a high-index medium to a low-index medium and the angle of incidence is equal to or larger than the critical angle, the light will experience total internal reflection instead of refraction. The light will stay within the higher index medium. One application of this reflection is high-speed communication networks using light instead of electricity, which can occur because total internal reflection prevents light from exiting the side of fibre optic cables. In nature, refraction causes rainbows to form as the white light entering raindrops is split into the visible light spectrum because the different wavelengths of visible light refract at slightly different angles.

This led to Lesson 5 and the application of refraction with thin lenses. To explore thin lenses, you drew light ray diagrams and solved them mathematically, similar to the curved mirrors. The thin lenses are, for example, used for glasses, telescopes, and microscopes.
The final support of the wave nature of light was diffraction and polarization in Lesson 6. You learned that diffraction is the interference of light after it passes through a system of slits as exhibited by Young’s double-slit experiment. The interference pattern (shown in the picture that follows) could only be explained by using wave theory and is shown mathematically in the equations: ![]() and
and ![]() . The diffraction interference pattern can be seen in the rainbow of light diffracted by everyday objects like CDs and DVDs.
. The diffraction interference pattern can be seen in the rainbow of light diffracted by everyday objects like CDs and DVDs.
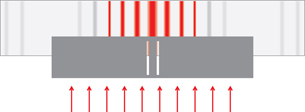
Finally, the wave nature of light was demonstrated using polar filters that block different amounts of light depending on the filters’ orientation. Polar filters absorb the electric field of the EMR and only allow EMR through that is vibrating in one plane. If the filters are oriented at 90° to each other, they absorb all of the wave energy. They are commonly used in sunglasses or camera filters to block glare from reflected surfaces.
Module 5 showed you that the wave nature of EMR is supported by the production, speed, propagation of light, reflection, refraction, diffraction, interference, and polarization of light.
The wave nature of EMR will be built upon in Module 6 where you will be introduced to the principle of wave-particle duality of EMR and the quantum theory of physics.
Module Assessment
Question 1
Use the following information to answer this graphing question.
You will complete the analysis of the following investigation to determine the index of refraction of a glass prism shaped like the letter D.
Materials
- polar graph paper
- D-shaped glass prism
- laser
- small sheet of paper
Procedure
- Place the D on the polar graph paper so that the midpoint of the straight side of the D is centred.
- Shine the laser toward the straight side of the D so that it hits the midpoint exactly. To make observations easily, hold the laser so that the beam shines along the polar graph paper. This is the incident beam.
- Use the small sheet of paper as a screen to observe the refracted beam after it leaves the D.
- Repeat steps 2 and 3 for several angles of incidence in air.
Observations
The polar graph paper with the locations of the D and five beams is shown.
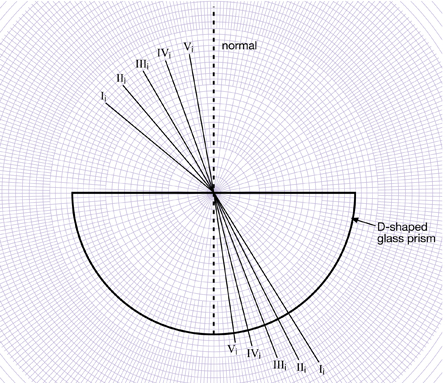
| Observations | Analysis | ||
| Angle of Incidence in Air (degrees) | Angle of Refraction in Glass (degrees) | Sine of Angle of Incidence | Sine of Angle of Refraction |
| 50.0 | 33.0 | ||
| 40.0 | 27.0 | ||
| 30.0 | 21.0 | ||
| 20.0 | 14.0 | ||
| 10.0 | 7.0 | ||
Analysis
Determine the index of refraction of the glass. In your response,
- complete the table by calculating the sines of the angles
- provide a graph of the sine of the angle of refraction as a function of the sine of the angle of incidence
- determine the slope of the graph
- explain the physics significance of the slope
Marks will be awarded based on your graph and on the mathematical treatment of the physics you used to solve this problem.
Graphing Question Scoring Guide
Question 2
Answer the following holistic question.
You have seen two ways to produce a spectrum from white light. Compare and contrast the visible spectrum produced by diffraction gratings with those produced by triangular prisms.
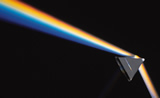
This spectrum was produced by a triangular prism.
© 2009 Jupiterimages Corporation
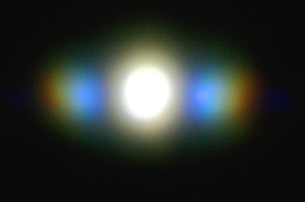
This spectrum was produced by a diffraction grating.
1.35. Module Glossary
Module 5—Wave Theory of Light
Module Glossary
antinode: the opposite of node, a point on a standing wave pattern where there is maximum displacement
bright fringes: regions of constructive interference along antinodal lines
constructive interference: occurs when two waves combine to produce a resultant wave larger than either of the original waves
converging lens: a lens that refracts rays travelling parallel to the principal axis inward to the focal point of the lens
critical angle: for any two mediiums, the size of the incident angle that causes the angle of refraction to be 90°
dark fringes: regions of destructive interference along nodal lines
destructive interference: occurs when two waves combine to produce a resultant wave smaller than either of the original waves
diffraction: the bending and spreading of waves when they interact with obstacles in their path
diffraction grating: an optical component that has a surface covered by a regular pattern of parallel lines or grooves that are usually separated by a distance comparable to the wavelength of light
diverging lens: a lens that refracts rays travelling parallel to the principal axis outward so that they appear to have originated or passed through the virtual focal point of the lens
electromagnetic spectrum: a general classification of all electromagnetic radiation based on wavelength, frequency, and energy
frequency: the number of cycles per unit of time (Hz = 1 cycle/second)
incident ray: an incoming ray of light
node: a point on a standing wave pattern where there is no displacement and it appears to be standing still
normal line: a straight, dashed line drawn perpendicular to the mirror surface at the point of reflection
Θi (Θin): the angle between the incident ray and the normal line
Θr (Θout): the angle between the reflected ray and the normal line
polarization: the production of a state in which the plane of the electric field for each electromagnetic wave occurs only in one direction
reflected ray: an outgoing ray of light
refraction: a change in the direction of a wave due to a change in its speed
refractive index: a ratio comparing the speed of light in a vacuum to its speed in a given medium
Snell’s Law: for any angle of incidence greater than zero, the ratio of ![]()
thin lens equation: an equation that relates image distance, object distance, and the focal length of a thin lens
total internal reflection: the reflection of a wave that is travelling from a high-index medium into a low-index medium at an angle equal to or greater than the critical angle
wavelength: the distance between adjacent points on a wave that vibrate in phase with one another (m)