Lesson 1 - Review and Defining Abnormal Behaviour
Statistical Deviation View of Abnormality
 Without delving into the finer details and concepts surrounding statistics, a simple definition of a statistical deviation is 'a noticeable departure from those traits or behaviours possessed by the majority of people.' If we use adult height as an example, a noticeable departure from the average or norm is a seven-foot tall individual (2.13 metres) or a four-foot tall individual (1.22 metres). Because the heights of the majority of adults are less extreme than either of the two examples, we can say that the two heights (seven feet and four feet) are abnormal. To restate this idea, individuals with characteristics and behaviours that are not within an average range (characteristics falling beyond a particular distance from the average value) can sometimes be considered abnormal. To continue with our height example, let us use 5 feet 10 inches as the mathematical average height of Canadian men. Many men are either taller than 5 feet 10 inches or shorter than 5 feet 10 inches, but they are not considered abnormal with respect to height. Scientists can statistically show abnormal by collecting data, calculating the average, determining the standard deviation (a variation from the arithmetic average), and then finding all individuals that are farther than two standard deviations away from the average. The individuals farther than two standard deviations from the average generally make up about 5% of the sample population. This can be graphically displayed in a distribution curve, also known as a bell curve.
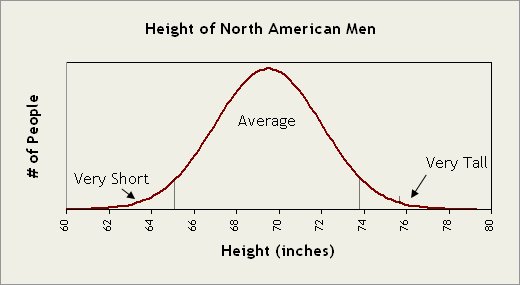
The area on the left labelled "very short" and the white area on the right labelled "very tall" represent individuals who are either abnormally short or abnormally tall. Those individuals fall more than two standard deviation units from the average height. The middle section labelled "average" represents those individuals who have what may be considered "normal height" - those around the average.
Bell Curve of Height
If the bell curve below represented intelligence instead of height (intelligence on the x-axis and number of people on the y-axis), the individuals in the yellow and grey area on the left of the curve would be considered mentally retarded while the individuals falling within the yellow and grey area on the right would be considered gifted or akin to genius! Would you label a mentally challenged individual as abnormal? Would you label a genius as abnormal?
While the statistical method of determining abnormality is scientific and valid, it does nothing to  address certain important issues such as health and welfare. For example, in the past two decades the bell curve for weight (mass) in North America has shifted right (with mass on the x-axis). This means that we, as a society, are on average becoming heavier. This may be the norm, but is it healthy? Is it desirable?
Bell Curve of IQ Scores
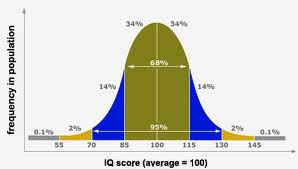
If the entire population took an IQ test, the scores would fall into a bell-shaped curve around the most frequent score of 100. More than two-thirds of people score between 85 and 115 on lQ tests.
Intelligence Quotient: number used to express the apparent intelligence of a person.