Lesson 3
Completion requirements
Created by IMSreader
1. Lesson 3
1.6. Explore 2
Module 7: Rational Functions and Function Operations
You have now used two different graphing methods to estimate solutions to rational equations:
- In Try This 1 you graphed two functions that correspond to each side of the equation. The value of x at the intersection point provides the solution in this method.
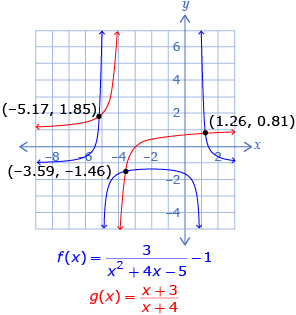
The equation can be solved by graphing
  The x-value of the intersection of these two functions is the solution to the equation.
- In Try This 2 you rearranged the equation so that one side is equal to 0, and then you graphed the function that corresponds to the other side of the equation. The zeros of the function, or x-intercepts of the graph, give the solutions using this method.
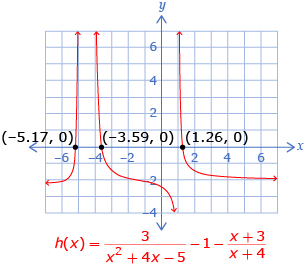
The equation can also be solved by rearranging
the equation to and graphing
 The x-intercepts will give the solutions to the equation.
Determining solutions graphically will usually give approximate solutions rather than exact ones. It is also possible to check solutions by showing that substituting the solutions into the original equation results in a true statement.
Read “Example 2” on pages 460 and 461 of the textbook to see another example of how approximate solutions are determined by graphing functions. Which method listed above do the methods “Use a Single Function” and “Use a System of Two Functions” from the textbook refer to?
Self-Check 1
Complete questions 1, 2, 4.a., and 4.b. on page 465 of the textbook. Answer