Lesson 3
1. Lesson 3
1.5. Explore
Module 7: Rational Functions and Function Operations
Explore
The graphs of rational functions can be used to estimate the solutions to rational equations using methods you have seen in previous lessons. In Try This 1 you may have noticed that if you graph each side of the equation as a separate function, the x-values of the intersections (the r-values in Try This 1) will give you the solutions to the equation.
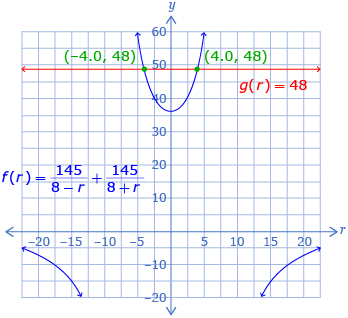
From this graph, the solutions to ![]() can be estimated as —4.0 and 4.0.
can be estimated as —4.0 and 4.0.
In previous sections you saw that there were multiple ways to estimate a solution from graphing. Try This 2 further explores another method.
Try This 2
Consider the equation ![]()
-
- Plot
 and
and  on the same graph.
 - Determine the intersections of f(x) and g(x).
- Plot
-
- How is
 related to
  ?
? - Plot h(x).
- Determine the x-intercepts of h(x). How are these values related to the ones you found in question 1.b?
- How is
-
- Explain a strategy that can be used to show that the x-values you found in questions 1.b. and 2.c. are solutions to
 .
. - Use your strategy to show that the x-values you found in questions 1.b. and 2.c. are solutions to
 .
.
- Explain a strategy that can be used to show that the x-values you found in questions 1.b. and 2.c. are solutions to
![]() Save your responses in your course folder.
Save your responses in your course folder.
Share 2
With a partner or group, discuss the similarities and differences between the two different graphing techniques used to solve rational equations in Try This 2. What benefits and/or drawbacks do you see to each method? Which method do you prefer?
![]() If required, save a record of your discussion in your course folder.
If required, save a record of your discussion in your course folder.