Lesson 6
1. Lesson 6
1.2. Explore
Module 4: Foundations of Trigonometry
Explore
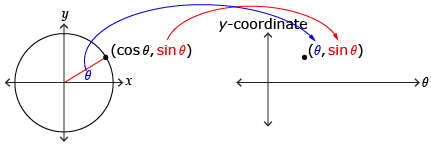
In Discover you plotted the points (θ, y-coordinate of P(x, y)) where P is the intersection of the terminal arm and the unit circle. You may recall from Lesson 4 that the y-coordinate of P(x, y) corresponds to sin θ if P is on the unit circle. This means the points you plotted in Discover are (θ, sin θ) or the function y = sin θ. A similar process can be used to produce a graph of y = cos θ. As in previous modules, y = sin θ and y = cos θ can also be represented using function notation as f(x) = sin θ and f(x) = cos θ.
Try This 2
Use Cosine Table and Graph Template to respond to the following questions.
- Fill in Cosine Table and Graph Template for y = cos θ.
- Graph y = cos θ using the labelled axis provided.
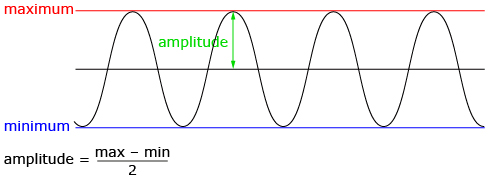
- What are the maximum and minimum values?
- Half the distance between the maximum and minimum value is called the amplitude. What is the amplitude for y = cos θ?

-
Label the y-intercept.
-
What is the range of the graph?
![]() Save your copy of Cosine Table and Graph Template in your course folder.
Save your copy of Cosine Table and Graph Template in your course folder.
Share 2
With a partner or group, discuss the following questions based on the graph you created in Try This 2.
- How is the graph of y = cos θ that you produced similar to the graph of y = sin θ from Discover? How are the graphs different?
- What is the amplitude of y = sin θ from Try This 1?
![]() If required, place a record of your discussion in your course folder.
If required, place a record of your discussion in your course folder.