Module 3 Intro
1. Module 3 Intro
1.6. Lab
Module 3—Ecosystems and Their Diversity
 Read
Read
Interactions between organisms influence how a community is structured. Some possible interactions found in a community are
- competition between individuals of the same species (intraspecific competition)
Example: two elk fighting
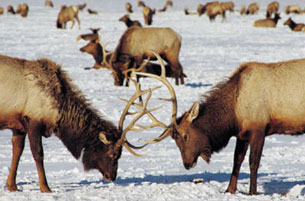
Courtesy of U.S. Dept of the Interior, Bureau of Land Management
- competition between individuals of different species (interspecific competition)
Example: different species of African animals competing for water

© 2007 Jupiterimages Corporation
- predator and prey relationships
Example: wolves hunting elk
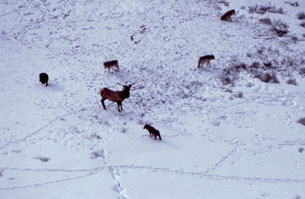
Courtesy of U.S. National Park Service
-
populations interacting with abiotic factors
Example: trout in water vs. bison on land
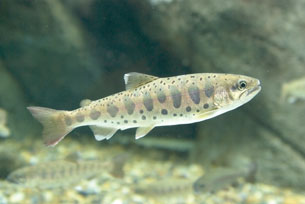
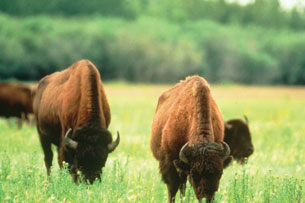
Fish: © Ilya D. Gridnev/shutterstock
Buffalo: © Image courtesy of Syncrude Canada Inc.
All of these interactions are dynamic—they are constantly changing. An area that was once suitable for trees can be made unsuitable by fire, rockslides, or a variety of other disturbances. The new habitat created by these disturbances may be less suitable for trees but will be more suitable to other species, such as moss and lichens. Over time, the moss and lichens can change the habitat so that it once again becomes suitable for shrubs and grasses to grow.
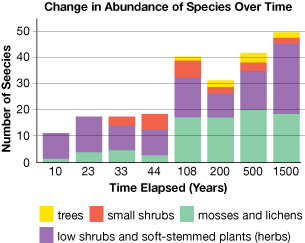
The following graph shows how the types of species change as time passes. The graph describes a habitat recently exposed by a melting glacier.
 Self-Check
SC 2. Why does it take over 100 years for trees to appear in this habitat?
SC 3. Before you continue, think of some abiotic conditions that could influence the size of leaves on a plant.
 Self-Check Answer
SC 2. It takes a long time for the nutrients in the soil to build up so that they could supply enough nutrients to the extensive root system of a tree.
SC 3.
- amount of moisture
- amount of nutrients in soil
- amount of available sunlight